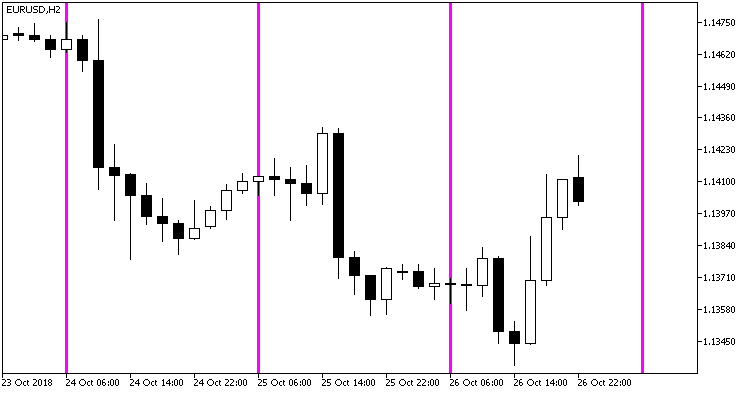
这个指标在每天的指定时间画一条垂直线。
//+----------------------------------------------+
//| 指标输入参数                                   |
//+----------------------------------------------+
input string LinesSirname="VLine_Grid_Custom_";     //线的名称
input HOURS  LineHours=ENUM_HOUR_0;                 //线的设置线 (小时)
input MINUTS LineMinuts=ENUM_MINUT_0;               //线的设置线 (分钟)
input color Line_Color=clrMagenta;                  //线的颜色
input ENUM_LINE_STYLE Line_Style=STYLE_DASHDOTDOT;  //线的显示风格
input ENUM_WIDTH Line_Width=w_1;                    //线的宽度
input bool SetBackground=true;                      //线的背景显示
input uint LinesTotal=10;                           //历史中的线数
input uint FutureTotal=1;                           //未来空白历史中的线数
如果在图表中使用了多个不同参数的这个指标的实例,LinesSirname 参数在每个指标中应当是不同的。

图 1. VGridLine_Custom 指标
由MetaQuotes Ltd译自俄语
原代码: https://www.mql5.com/ru/code/22962
