Fan sayfamıza katılın

iCrossAD - MetaTrader 5 için gösterge

------------------------------------------------
Reliable, high quality. Help you check your strategy in StrategyTester, offer options to increase profitability. I write as a tester, and for demo and live trading.
- Görüntülemeler:
- 12307
- Derecelendirme:
- Yayınlandı:
- Güncellendi:
-
 Alım-satım fırsatlarını kaçırıyorsunuz:
- Ücretsiz alım-satım uygulamaları
- İşlem kopyalama için 8.000'den fazla sinyal
- Finansal piyasaları keşfetmek için ekonomik haberler
Kayıt Giriş yapWeb sitesi politikasını ve kullanım şartlarını kabul edersiniz
Hesabınız yoksa, lütfen kaydolun -
 Bu koda dayalı bir robota veya göstergeye mi ihtiyacınız var? Freelance üzerinden sipariş edin
Freelance'e git
Bu koda dayalı bir robota veya göstergeye mi ihtiyacınız var? Freelance üzerinden sipariş edin
Freelance'e git
Indicator SCAD (iCrossAD). It shows possible reversals or price roll-backs. The indicator is based on the intersecting by A/D a trend line built on the extreme values of indicator A/D.
The indicator is based on the "MT4 signal function based on the Accumulation/Distribution (A/D) indicator" described in article "An Insight into Accumulation/Distribution and Where It Can Get You. Briefly: If a trend line built on the A/D indicator chart is crossed by the indicator line, then the price will most probably cross the trend line based on the price chart, too. Thus, upon a signal from the indicator, a reversal or a roll-back can be expected.
The indicator has twenty-three adjustable parameters:
- AD applied volume — volume used when calculating AD
- Bars for calculate — number of bars where the intersection is looked for.
- Unchecked bars — number of the last bars on the right, the intersection with which is not considered as a signal ("sensitivity" filter).
- Filtering indicator — filtering indicator
- Without filtration - without filtering on additional indicators
- Filter by CCI - filter on indicator CCI
- Use setting by default CCI parameters — if CCI is used for filtering the signals, then the Yes value allows using the CCI default settings.
- CCI period — CCI calculation period if default CCI settings are not used.
- CCI appled Price — CCI calculation price if default CCI settings are not used.
- The upper level of the filter indicator — upper level of the filtering indicator.
- The lower level of the filter indicator — lower level of the filtering indicator.
- Draws arrow on chart — draw signal arrows on the price chart (Yes/No).
- The size of the arrows on the chart — size of signal arrows on the price chart.
- Bullish arrows color — color of bullish arrows.
- Bearish arrows color — color of bearish arrows.
- Draw a trend line — draw a trend line on the A/D indicator chart, intersections with which are searched for (Yes/No).
- Trend line thickness — thickness of the trend line.
- Trend line style — style of the trend line.
- Downtrend line color — color of the downtrend line.
- Uptrend line color — color of the uptrend line.
- Draw the search area — draw the area for searching the intersections (Yes/No).
- Search area style — drawing style of the search area
- Fill - filling
- Frame - frame
- Search area line width (if Frame mode) — line width of the search area (if drawing with a frame is selected).
- Search area line style (if Frame mode) — line style of the search area (if drawing with a frame is selected).
- Search area color — color of the search area line/filling.
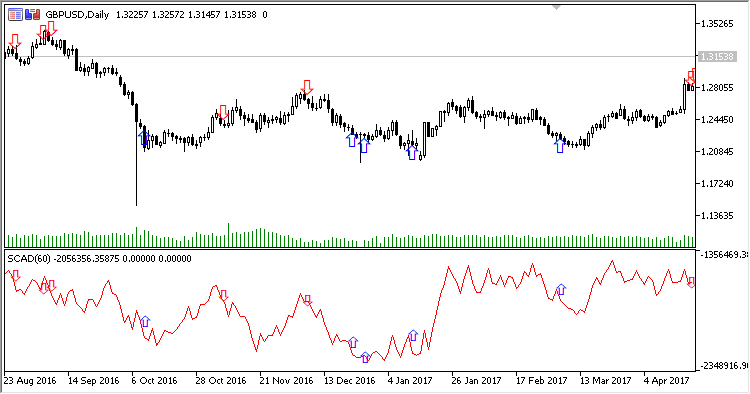
Fig.1. SCAD, default settings
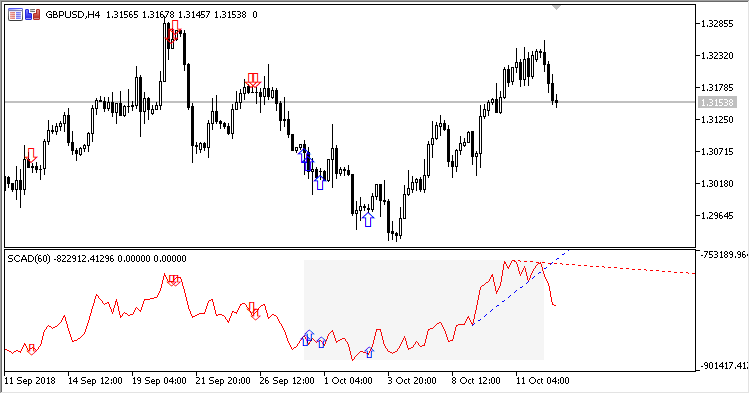
Fig. 2. SCAD, default settings. Draw a trend line = Yes, Draw the search area = Yes, Search area style = Fill
MetaQuotes Ltd tarafından Rusçadan çevrilmiştir.
Orijinal kod: https://www.mql5.com/ru/code/22753
Pivot_Fibs_Custom
A set of Fibo levels (pivot points) built on candles of the timeframe specified in the inputs
Pivot_Fibs_Custom_Arr
A set of Fibo levels (pivot points), based on candles of a timeframe specified in the inputs, made in the form of labels
ATR Dual
The indicator displays two indicators ATR with different averaging periods in a single window.
Fractal_Channel
Indicator Fractal Channel