Fan sayfamıza katılın
Öyleyse bir link gönderin -
başkalarının da faydalanmasını sağlayın
- Görüntülemeler:
- 4978
- Derecelendirme:
- Yayınlandı:
-
Bu koda dayalı bir robota veya göstergeye mi ihtiyacınız var? Freelance üzerinden sipariş edin Freelance'e git
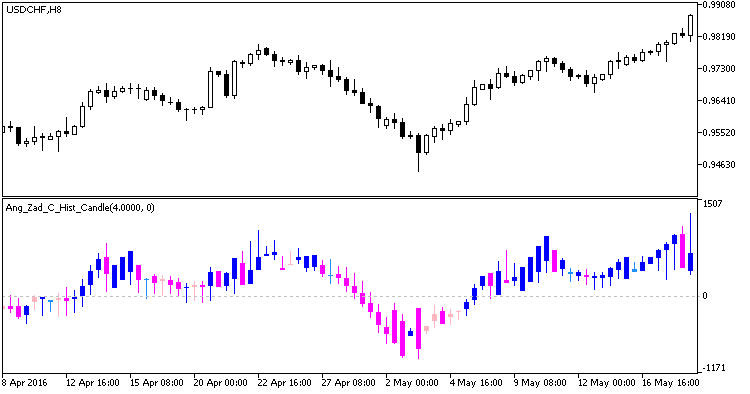
A candlestick-based chart based on histograms Ang_Zad_C_Hist calculated on the Open, High, Low, and Close timeseries of the price chart. Growing candlesticks are made in blue colors, while falling candlesticks are in pink ones. Growing candlesticks, the close prices of which have grown as compared to the preceding candlesticks, are bright, while pale colors are used for falling close prices. Falling candlesticks with falling close prices are bright pink, those with the growing ones are pale pink.
//+----------------------------------------------+
//| Indicator input parameters                   |
//+----------------------------------------------+
input double ki=4.000001;  // Indicator smoothing ratio
input int Shift=0;         // Horizontal indicator shift in bars

Fig 1. Ang_Zad_C_Hist_Candle
MetaQuotes Ltd tarafından Rusçadan çevrilmiştir.
Orijinal kod: https://www.mql5.com/ru/code/21154
 VR Atr pro Lite MT5
Indicator Atr Lite calculates the average price motion
 Candle shadows v1
Candlestick size and shadow analysis. In OnTradeTransaction, opening (DEAL_ENTRY_IN) and closing (DEAL_ENTRY_OUT) the positions are intercepted, as well as closing by Stop loss (DEAL_REASON_SL).
 SymbolX
This indicator calculates the index of a given currency, using the USD index. The Close prices of six currency pairs are used to calculate the index.
 SymbolX_Candle
This indicator calculates the index of a given currency, using the USD index. It is based on indicator SymbolX, but four prices are used for calculations: OHLC instead of just one Close price.