Fan sayfamıza katılın

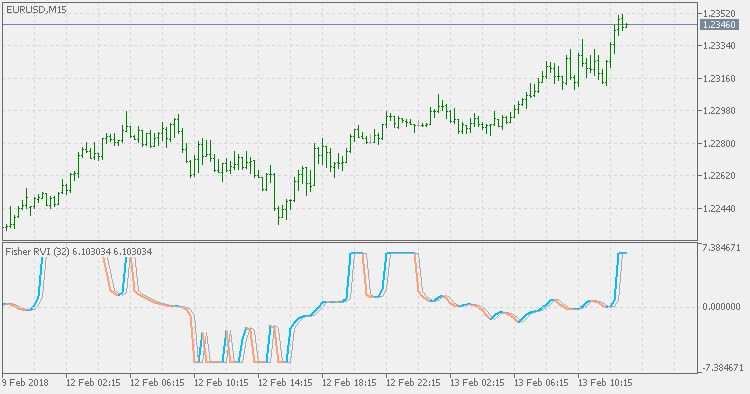
Fisher RVI - MetaTrader 5 için gösterge

- Görüntülemeler:
- 8284
- Derecelendirme:
- Yayınlandı:
-
 Alım-satım fırsatlarını kaçırıyorsunuz:
- Ücretsiz alım-satım uygulamaları
- İşlem kopyalama için 8.000'den fazla sinyal
- Finansal piyasaları keşfetmek için ekonomik haberler
Kayıt Giriş yapWeb sitesi politikasını ve kullanım şartlarını kabul edersiniz
Hesabınız yoksa, lütfen kaydolun -
 Bu koda dayalı bir robota veya göstergeye mi ihtiyacınız var? Freelance üzerinden sipariş edin
Freelance'e git
Bu koda dayalı bir robota veya göstergeye mi ihtiyacınız var? Freelance üzerinden sipariş edin
Freelance'e git
Relative Vigor Index (RVI) indicator is used in technical analysis to measure the conviction of a recent price action and the likelihood that it will continue. The RVI compares the positioning of a security's closing price relative to its price range, and the result is smoothed by calculating an exponential moving average of the values.
The indicator is calculated by using the following formula:
This indicator has an addition of Fisher Transform to the RVI. The Fisher Transform enables traders to create a nearly Gaussian probability density function by normalizing prices. In essence, the transformation makes peak swings relatively rare events and unambiguously identifies price reversals on a chart. The technical indicator is commonly used by traders looking for extremely timely signals rather than lagging indicators.
Stochastic Extended
This version of Stochastic Oscillator allows you to use any of the 4 basic types of averages (default is SMA, but you can use EMA, SMMA or LWMA too) - some are "faster" then the default version (like EMA and LWMA versions) and SMMA is a bit "slower" but this way you can fine tune the "speed" to signals ratio.
T3 Stochastic Momentum Index
This version is doing the calculation in the same way as the original Stochastic Momentum Index, except in one very important part: instead of using EMA (Exponential Moving Average) for calculation, it is using T3. That produces a smoother result without adding any lag.
Inverse Fisher RVI
The Inverse Fisher Transform normalizes the values in the desired range (-1 to +1 in this case) which helps in assessing the overbought and oversold market conditions.
 Get M1 OHLC data for MetaTrader 4 backtesting
Usually most brokers do not provide M1 data over 3 months in MetaTrader 4, but they provide M1 data over 3 years in MT5. So we can use this tool to obtain the M1 data in MetaTrader 5 tester and save the data into .hst file for MetaTrader 4 backtesting.