Fan sayfamıza katılın

CCI alternative - MetaTrader 5 için gösterge

- Görüntülemeler:
- 7654
- Derecelendirme:
- Yayınlandı:
-
 Alım-satım fırsatlarını kaçırıyorsunuz:
- Ücretsiz alım-satım uygulamaları
- İşlem kopyalama için 8.000'den fazla sinyal
- Finansal piyasaları keşfetmek için ekonomik haberler
Kayıt Giriş yapWeb sitesi politikasını ve kullanım şartlarını kabul edersiniz
Hesabınız yoksa, lütfen kaydolun -
 Bu koda dayalı bir robota veya göstergeye mi ihtiyacınız var? Freelance üzerinden sipariş edin
Freelance'e git
Bu koda dayalı bir robota veya göstergeye mi ihtiyacınız var? Freelance üzerinden sipariş edin
Freelance'e git
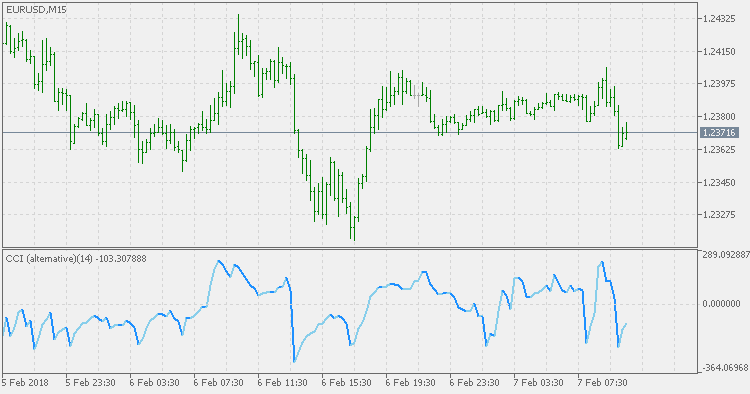
Developed by Donald Lambert and featured in "Commodities" magazine in 1980, the Commodity Channel Index (CCI) is a versatile indicator that can be used to identify a new trend or warn of extreme conditions. Lambert originally developed CCI to identify cyclical turns in commodities, but the indicator can be successfully applied to indices, ETFs, stocks, and other securities.
In general, CCI measures the current price level relative to an average price level over a given period of time:
- CCI is relatively high when prices are far above their average.
- CCI is relatively low when prices are far below their average.
In this manner, CCI can be used to identify overbought and oversold levels.
Usually CCI uses typical price, but this version uses an interesting variation of a typical price : instead of using (high+low+close)/3 it uses (highest high + lowest low + close)/3. That might seem as a small change, but it enhances the extremes and make the CCI values more responsive to sudden price changes
Volume Rate of Change
The Volume Rate of Change indicator (VROC) measures the rate of change in volume over the past "n" sessions. In other words, the VROC measures the current volume by comparing it to the volume "n" periods or sessions ago.
DevStops
A variation of Deviation Stops (DevStops) indicator. Some are wrongly calling this version a Kase DevStops (which it is not - Kase DevStops indicator is calculated in a quite different way), but this version has its good points too and can be used in regular support/resistance mode. Additionally each DevStop value is colored according to the slope (trend) of the line - when all are aligned in the same direction, it can be treated as a confirmed trend change.
Smoothed Kijun-Sen
The Kijun-Sen is a major indicator line and component of the Ichimoku Kinko Hyo indicator, also known as the Ichimoku cloud. It is generally used as a metric for medium-term momentum.
MACD DEMA
MACD that is using DEMA fo calculation.