Fan sayfamıza katılın
Öyleyse bir link gönderin -
başkalarının da faydalanmasını sağlayın
- Görüntülemeler:
- 5355
- Derecelendirme:
- Yayınlandı:
- Güncellendi:
-
Bu koda dayalı bir robota veya göstergeye mi ihtiyacınız var? Freelance üzerinden sipariş edin Freelance'e git
Real author:
klot
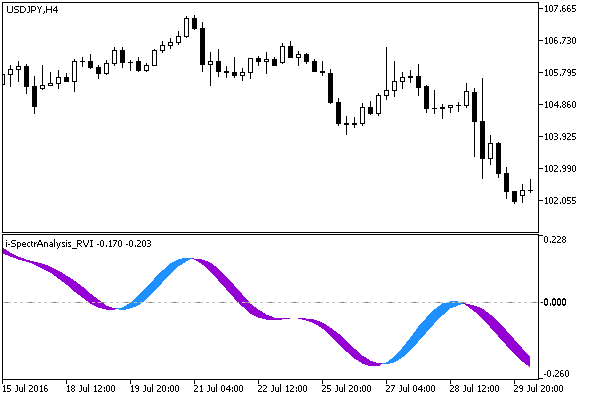
The indicator is an example of smoothing a time series of the RVI indicator by filtering harmonics of higher order.
This approach can be applied to smooth the values of any indicators. The main advantage of the method is virtually no delay.
Indicator input parameters:
//+----------------------------------------------+
//| Indicator input parameters                   |
//+----------------------------------------------+
input uint RVIPeriod=14;                          // averaging period
input uint N = 7;                                 // number Length
input uint SS = 20;                               // smoothing factor
input int Shift=0;                                // The shift indicator in the horizontal bars
where:
- N — series length (power of two);
- SS — Smoothing coefficient, zeroes the frequencies above the specified value in the obtained spectrum. SS cannot be greater than 2^N. If SS = 2^N, the RVI series is fully repeated.
The indicator operation requires the library: https://www.mql5.com/en/code/7000.

Fig.1. The i-SpectrAnalysis_RVI indicator
MetaQuotes Ltd tarafından Rusçadan çevrilmiştir.
Orijinal kod: https://www.mql5.com/ru/code/16075
 i-SpectrAnalysis_ADX
The indicator is an example of smoothing a time series of the ADX indicator by filtering harmonics of higher order.
 i-CAi_Cloud_Digit
The i-CAi indicator that fills the chart space with a colored background and displays the most recent value as a price label with the possibility to round the channel levels up to a required number of digits, as well as displays a price grid with those rounded values.
 i-SpectrAnalysis_OsMA
The indicator is an example of smoothing a time series of the OsMA indicator by filtering harmonics of higher order.
 RAVI_HTF
The RAVI indicator with the timeframe selection option available in input parameters.