Auto AndrewFork

1

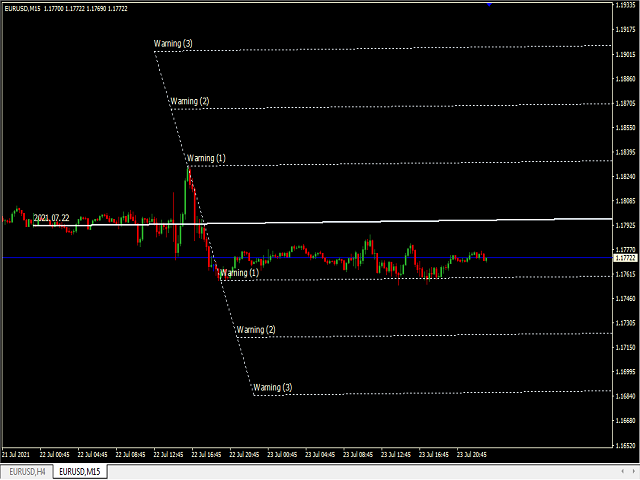
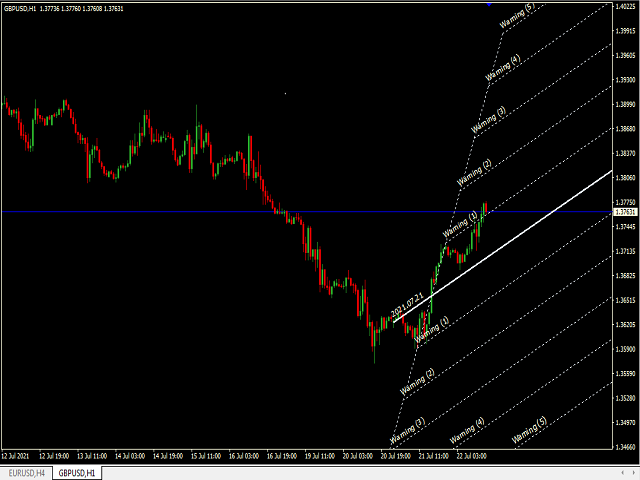
Auto Pitchfork Indicator

The indicator calculate the Pitch fork for the previous Day (Selectable) with multiple Support and Resistance lines from the Median price which acts as Magnet for the Price that if price touch the above warning (1) or below warning (1) lines and not cross up or down then there is maximum possibilities that it will return to the Median Line, and thus maintain the Price Action in Cyclic Pattern to the Market Move.

You are able to select how many warning lines you want to keep and Timeframe of the Previous Candle

Thanks,...

Рекомендуем также
Fibonacci Wave Bands Indicator The Fibonacci Wave Bands indicator utilizes Fibonacci ratios to create dynamic bands around a central moving average. These bands are derived from key Fibonacci ratios (typically 38.2%, 50%, 61.8%) and adapt to market volatility, offering insights into potential support and resistance zones. Key Features: Fibonacci Levels: The indicator plots multiple bands above and below a central moving average based on Fibonacci ratios. Dynamic Support and Resistance: Bands ser
mql5 version:  https://www.mql5.com/en/market/product/44815 Simple indicator to calculate profit on fibonacci retracement levels with fixed lot size, or calculate lot size on fibonacci levels with fixed profit. Add to chart and move trend line to set the fibonacci retracement levels. Works similar as default fibonacci retracement line study in Metatrader. Inputs Fixed - select what value will be fix, lot or profit Fixed value - value that will be fix on all levels Levels - levels for which to ca
Free automatic fibonacci - это индикатор, который автоматически строит коррекции Фибоначчи, основываясь на количестве баров, выбранных в параметре BarsToScan. Линии Фибоначчи автоматически обновляются в реальном времени при появлении новых максимальных и минимальных значений среди выбранных баров. В настройках индикатора можно выбрать уровни, значения которых будут отображены. Также можно выбрать цвет уровней, что позволяет трейдеру прикреплять индикатор несколько раз с разными настройками и цве
FREE
VaviStar - это индикатор, основанный на коррекциях тренда, определяемых сегментами ZigZag. Предполагается, и статистика подтверждает, что акции реагируют на определенные уровни коррекции. Многие используют уровни коррекции Фибоначчи (23,6%, 38,2%, 61,8%). Предполагается, что как только цена выйдет за пределы 61,8% коррекции, мы уже можем говорить о развороте тренда. Данный индикатор позволяет комфортно отобразить сегмент Зигзага с выбранными относительными рабочими уровнями. С разворотным мы
MultiFiboDynamicMT4 - мощный, профессиональный индикатор для оценки важных уровней поддержки и сопротивления. Главное преимущество - он строит уровни Фибоначчи на всех временных периодах одновременно, что позволяет трейдеру видеть полную картину возможного движения цены торгового инструмента! Преимущества индикатора Индикатор прекрасно подходит для скальпинга и торговли бинарными опционами; Подходит для начинающих и опытных трейдеров; Работает на любых таймфреймах; Работает на любых финансовых
FREE
DMS Fibo
Diogo Mitsunaga Dos Santos
Fibonacci retracements are trend lines drawn between two significant points, usually between absolute lows and absolute highs, plotted on a chart. Intersecting horizontal lines are placed at the Fibonacci levels. Fibonacci retracements are useful tools that help traders identify support and resistance levels. With the information gathered, they can place orders, identify stop-loss levels, and set price targets. Although useful, traders often use other indicators to make more accurate assessments
Fibonacci SR Indicator Индикатор рисует линии поддержки и сопротивления. Продукт основан на уровнях коррекции и расширения Фибоначчи (Fibonacci Retracement and Extension levels). Индикатор учитывает многочисленные комбинации уровней Фибоначчи и рисует линии поддержки/сопротивления. При этом в расчетах используются значения вершин и оснований, построенных индикатором ZigZag. При необходимости ZigZag также может быть отображен на графике. Индикатор учитывает многочисленные комбинации предыдущих то
FREE
Индикатор PipTick Pivot автоматически рассчитывает и отображает линии уровней разворота, а также уровни поддержки и сопротивления. Уровень разворота может рассчитываться по разным формулам: классическая, Floor, Fibonacci, Woodie, Camarilla или DeMark. Можно выбрать период для расчета индикатора. Период может быть дневным, недельным, месячным или пользовательским. Типы пивотов: Классический. Floor. Fibonacci. Woodie. Camarilla. DeMark. Основные характеристики Индикатор показывает текущие и исто
FREE
Fibonacci Retracements Pro
Savia Forex Software Solutions
Fibonacci Retracements Pro The Fibonacci Retracements Pro is a powerful yet easy to use indicator. It automatically plots all the important Fibonacci retracement and extension levels for you. FRP is dynamic powerful and seamlessly adjusts to whatever timeframe you are analyzing. Fibonacci Retracement Pro is optimized for ALL timeframes and ALL Currency pairs, Indices, Commodities, and Cryptocurrency pairs. Trade with improved confidence and maximize your success rate. Benefits Dynamic and Power
Smart Trendlines – No.1 Trendlines Indicator Smart Trendlines is a precision tool that automatically draws trendlines based on every valid pivot point, helping traders identify key support and resistance zones. It continuously adjusts as new market pivots form, providing a live and accurate reflection of price structure. Whether you’re tracking trends, preparing for reversals, or anticipating breakouts — this indicator keeps you one step ahead. It works seamlessly across all assets including For
Utility for show on charts the visual informations about: - a vertical line at start of each bar of selected timeframe - a vertical line at start of each day - a vertical line at start of each week - vertical lines at start / end of trading sessions selected - bid / ask prices, spread, money value for each point (of 1 standard lot) and last tick time recived" You can enable / disable each information and set the color for each line
FREE
YK-Fibo Pivot Indicator: Trade Smarter with Fibonacci Pivot Points The YK-Fibo Pivot Indicator is a powerful technical analysis tool that combines the precision of Fibonacci retracements with the insights of Pivot Points. Whether you're a novice or seasoned trader, this indicator empowers you to spot profitable opportunities in the market with ease. Why Choose YK-Fibo Pivot? Pinpoint Support & Resistance: By calculating Fibonacci levels based on the previous day's high, low, and close prices, y
Raymond Cloudy Day Indicator for MT4 – Pivot-Based Reversal and Trend Levels Raymond Cloudy Day Indicator is a pivot-based level indicator for MetaTrader 4 (MT4). It was developed by Ngo The Hung based on Raymond’s original idea and is designed to give a structured view of potential reversal zones, trend extensions and support/resistance levels directly on the chart. The default settings are optimised for XAUUSD on the H1 timeframe, but the indicator can be tested and adjusted for other symbols
Fibonacci Retracement EA is a fully automated MT4 Expert Advisor that trades Forex using the most reliable and time-tested tool in technical analysis – Fibonacci retracement and extension levels . This EA continuously scans the market for swing highs and swing lows , plots Fibonacci levels (38.2%, 50%, 61.8%, 76.4%), and enters trades when price retraces into key zones with candlestick confirmation. It then manages trades automatically with Stop Loss, Take Profit, breakeven, trailing stop, and m
BeST_ Classic Pivot Points is an MT4 Indicator that is based on the widely known and definitely classic Pivot Point of a market prices activity. A pivot point is calculated as an average of significant prices (high,low,close) from the performance of a market in the prior trading period. If the market in the following period trades above the pivot point it is usually evaluated as a bullish sentiment, whereas trading below the pivot point is seen as bearish. A pivot point and the associated suppo
FREE
Auto Fibonacci Retracement Indicator — Flexible and Reliable This is not just another Auto Fibonacci Retracement indicator — it’s one of the most flexible and dependable tools available . If you find it useful, please leave a review or comment to support the project. Check out my other helpful tools below: Timeframes Trend Scanner    - Scan the trend of assets in difference timeframes with multiple indicators Market Trend Scanner   - Scan the trend of multiple-assets in with multiple indicators
FREE
Simple supply and demand indicator which should help identify and visualize S&D zones. Settings: Color for supply zones, color for demand zones - default colors are set for dark (black) background. Number of how much zones should be created above and below current price - value "3" means there will be 3 zones above current price and 3 zones below current price. Principle: When price creates "V", reversal zone is registered. Rectangle filled based on zone type (supply / demand) is drawn if price
This indicator filters the Zigzag indicator to calculate the main support and resistance levels. Variables minimum gap between peaks : is the distance (GAP) between the peaks of the Zigzag peaks sensitivity : Minimum number of nearby peaks look back: it means that it has to test the last 50 peaks in the Zigzag object name perfix: a prefix for level’s line name on chart
FREE
Индикатор анализирует указанное количество свечей и строит уровни Фибоначчи на основе максимума-минимума. Поскольку уровни перестраиваются, то нас интересует правая часть диапазона. Цена магнитит к уровням и реагирует на касание. Используйте этот инструмент для поиска точки входа по тренду после коррекции. Если слева мы видим, что уровни идеально встали, то мы можем предположить, что нашли окончание движения в крайней точке. Все линии прорисовываются через буферы или объекты (на выбор). Входные
FREE
Classic Fractals indicator for MT4, with additional Trendlines connecting the latest couples of fractals ( fractals are showing highest high, and lowest low on each period) Rules for trendlines: -if new top fractal is below the last one = new resistance line -if new bot fractal is above the last one = new support line -Trendlines can be hidden -Fractals can be hidden Fractal Period = can be both even or uneven number, as it is setting for half (one side) of the bars sequence for findin
Andrews Pitchfork channels is a triple trend channel tool consisting of three lines. In the middle, there is a median trend line on both sides that has two parallel equidistant trend lines. These lines are usually drawn by selecting three points based on the heights moving from left to right on the response heights or graphs. As with the normal trend lines and channels, the outward trend lines mark potential support and resistance areas. Parameters Trend_period - the period setting to be calcu
FIBO Price Calculator  Brief Description 1. Automated Fibonacci Retracement Drawing This indicator automatically draws Fibonacci Retracement lines on the MT4 chart, assisting traders in quickly identifying potential support and resistance levels. 2. Customizable Fibonacci Sequence Users can customize the Fibonacci sequence values, and the indicator automatically converts them into corresponding price levels based on the current market price. 3. Adjustable Indicator Window Position The indicator
Smart Pivot Points для MetaTrader 4 — Четкие уровни для умной торговли Smart Pivot Points   — это профессиональный индикатор для MetaTrader 4, который автоматически вычисляет и отображает на графике полный набор ключевых торговых уровней. Он трансформирует хаос ценового движения в понятную структурную карту, выделяя зоны поддержки, сопротивления, ценового баланса и потенциальных целей. Инструмент создан для трейдеров, которые ценят ясность, и работает на любом рынке:   Форекс, криптовалюты (Bitc
This indicators automatically draws the   support and resistances   levels (key levels) for you once you've dropped it on a chart. It reduces the hustle of drawing and redrawing these levels every time you analyse prices on a chart. With it, all you have to do is drop it on a chart, adjust the settings to your liking and let the indicator do the rest. But wait, it gets better; the indicator is absolutely free! For more information:  https://youtu.be/rTxbPOBu3nY For more free stuff visit:  https:
FREE
Fibonacci Retracement object is an object that has been provided by metatrader 4 platform. But  Fibonacci Retracement  object doesn't automated adjust the chart. You have to put and manage it manually to the chart. Because of that, this indicator was created. If you like using filbonacci retracement indicator, highly recommended to use Automated Fibonacci Retracement Indicator if you want to get better result in here: https://www.mql5.com/en/market/product/95515 LT Automated Fibonacci Retraceme
FREE
Fibonacci calculator is used with Elliot Waves, it can generate remarkable results. A trader could use these levels or ratios to find high probability trades with very small stop loss. You may also use these ratios to find Elliott Waves extensions and to book profit near those levels. For Elliot Wave experts, Fibonacci calculator is a highly useful tool that can assist them in calculating Fibonacci extension and retracement levels for the market price. The indicator proves itself as a useful one
Цена движется между двумя кривыми при тренде. Эти линии образуют канал и представляют собой уровни поддержки и сопротивления. Например, при восходящем тренде сделку можно совершить на уровне поддержки (красная линия), а выйти из нее на уровне сопротивления (синяя линия). Канал показывает направление тренда для любого таймфрейма (если на графике достаточно баров для более крупных таймфреймов). Тренд, или ценовой канал, может быть восходящим, нисходящим или боковым. Если текущая цена ближе к красн
Индикатор отображает коэффициенты между экстремумами графика. Вы можете указать собственные коэффициенты (например, Фибоначчи). Параметры Наиболее важные Density - чувствительность поиска коэффициентов экстремумов. Чем выше значение, тем ниже чувствительность, и наоборот. Базовая единица - 1 бар графика. History - глубина истории для поиска. При -1 индикатор ищет на всех барах истории. Базовая единица - 1 бар графика. Range - глубина поиска коэффициентов от экстремума. Базовая единица - 1 бар г
FREE
Draws high of the day and low of the day anchored VWAPs for multiple days.                   DaysBack = Today only, today + 1 day back, today + 2 days back...               Today recalculates live                             Historical days are computed ONCE and frozen (static).                Colors tab shows exactly 2 entries:                                  High of the day VWAP color  (default: Green)                                   Low of the day VWAP color  (default: Red)               
VR Pivot
Vladimir Pastushak
VR Pivot - это индикатор ключевых разворотных точек пивотов (pivot). Точки Пивот – это специальный тип уровней поддержки (support) и сопротивления (resistance) , которые используются с целью определения наиболее сильных ценовых зон. Профессиональные трейдеры использую уровни пивотов для определения цен на которых существует большая вероятность разворота цены. Уровни рассчитываются по специальным математическим формулам, в расчет идут цены закрытия, открытия, максимума, минимума предыдущего време
С этим продуктом покупают
Genesis Matrix Pro is a professional multi-timeframe trend detection indicator designed to help traders identify high-quality market alignment with clarity and structure. It combines 12 different technical indicators into one visual alignment matrix, allowing traders to quickly see when market conditions are bullish, bearish, or neutral. A signal is generated only when the selected strategies are aligned, helping reduce noise and improve decision-making. PLEASE CONTACT ME AFTER PURCHASE TO GET
Gann Made Easy - это профессиональная, но при этом очень простая в применении Форекс система, основанная на лучших принципах торговли по методам господина У.Д. Ганна. Индикатор дает точные BUY/SELL сигналы, включающие в себя уровни Stop Loss и Take Profit. ПОЖАЛУЙСТА, СВЯЖИТЕСЬ СО МНОЙ ПОСЛЕ ПОКУПКИ, ЧТОБЫ ПОЛУЧИТЬ ТОРГОВЫЕ ИНСТРУКЦИИ И ОТЛИЧНЫЕ ДОПОЛНИТЕЛЬНЫЕ ИНДИКАТОРЫ БЕСПЛАТНО! Вероятно вы уже не раз слышали о торговли по методам Ганна. Как правило теория Ганна отпугивает от себя не только н
The Propfolio Master Suite is the ultimate all-in-one analytical workstation for professional traders. Combining the power of the Beat The Market Maker (BTMM) methodology, Smart Money Concepts (SND/Liquidity), and Advanced Volume Profile, this suite replaces multiple different indicators with one optimized engine. Monitor up to 14 pairs simultaneously from a single chart, instantly identify market cycles, and seamlessly map institutional footprints with the click of a button. The Command Center
Scalper Inside PRO Scalper Inside PRO — это индикатор внутридневного тренда и скальпинга для MetaTrader 4, который использует эксклюзивный алгоритм для быстрой оценки направления рынка и ключевых целевых уровней. Он автоматически рассчитывает точки входа, выхода и несколько уровней фиксации прибыли, а также показывает подробную статистику результативности, чтобы вы могли видеть, как разные инструменты и стратегии работали раньше. Это помогает выбирать наиболее подходящие торговые инструменты под
M1 SNIPER — это простая в использовании торговая система. Это стрелочный индикатор, разработанный для тайм фрейма M1. Индикатор можно использовать как отдельную систему для скальпинга на тайм фрейме M1, а также как часть вашей существующей торговой системы. Хотя эта торговая система была разработана специально для торговли на M1, ее можно использовать и с другими тайм фреймами. Первоначально я разработал этот метод для торговли XAUUSD и BTCUSD. Но я считаю этот метод полезным и для торговли на д
PRO Renko System - это высокоточная система торговли на графиках RENKO. Система универсальна. Данная торговая система может применяться к различным торговым инструментам. Система эффективно нейтрализует так называемый рыночный шум, открывая доступ к точным разворотным сигналам. Индикатор прост в использовании и имеет лишь один параметр, отвечающий за генерацию сигналов. Вы легко можете адаптировать алгоритм к интересующему вас торговому инструменту и размеру ренко бара. Всем покупателям с удовол
Auto Optimized Parabolic RSI: Передовой 3D-движок импульса Большинство розничных индикаторов терпят неудачу, потому что они полагаются на статические входные параметры, которые ломаются, как только меняется волатильность рынка. Auto Optimized Parabolic RSI решает проблему «устаревания индикатора» путем непрерывного пересчета собственного математического преимущества, привнося количественную адаптацию институционального уровня прямо в ваш терминал MT5. Главное преимущество: Пользовательская 3D-оп
NAM Order Blocks
NAM TECH GROUP, CORP.
3.67 (3)
Индикатор обнаружения блоков ордеров мультитаймфреймов MT4. Функции - Полностью настраиваемая панель управления графиком, обеспечивает полное взаимодействие. - Скрыть и показать панель управления где угодно. - Обнаружение OB на нескольких таймфреймах. - Выберите количество OB для отображения. - Различные пользовательские интерфейсы OB. - Различные фильтры по OB. - Оповещение о близости OB. - Линии ADR High и Low. - Служба уведомлений (Экранные оповещения | Push-уведомления). Резюме
Прежде всего стоит подчеркнуть, что этот Торговый Инструмент является Неперерисовывающимся Нерепейнтинговым Индикатором, что делает его идеальным для профессиональной торговли. Онлайн-курс, руководство пользователя и демонстрация. Индикатор Концепций Умного Действия Цены - очень мощный инструмент как для новичков, так и для опытных трейдеров. Он объединяет более 20 полезных индикаторов в одном, комбинируя передовые торговые идеи, такие как анализ Inner Circle Trader и стратегии торговли концеп
Расширенный расчет на основе чистого ценового действия для поиска прорывов LH и HL. Это даст вам отличные точки разворота на рынке. Сигналы LH и HL также могут использоваться для прорывов трейнгла. Когда происходит прорыв, это указывает на сильный разворот. Хороший фильтр для скользящих средних. Я настоятельно рекомендую использовать это с индикаторами тренда. Может использоваться как дополнительное подтверждение для индикаторов поддержки и сопротивления, спроса и предложения. Более подробную
Dynamic Forex28 Navigator — инструмент для торговли на рынке Форекс нового поколения. В НАСТОЯЩЕЕ ВРЕМЯ СКИДКА 49%. Dynamic Forex28 Navigator — это эволюция наших популярных индикаторов, объединяющая мощь трех в одном: Advanced Currency Strength28 Indicator (695 отзывов) + Advanced Currency IMPULSE with ALERT (520 отзывов) + CS28 Combo Signals (бонус). Подробности об индикаторе https://www.mql5.com/en/blogs/post/758844 Что предлагает индикатор Strength нового поколения?  Все, что вам нравило
Это, пожалуй, самый полный индикатор автоматического распознавания гармонического ценообразования, который вы можете найти для платформы MetaTrader. Он обнаруживает 19 различных паттернов, воспринимает проекции Фибоначчи так же серьезно, как и вы, отображает зону потенциального разворота (PRZ) и находит подходящие уровни стоп-лосс и тейк-профит. [ Руководство по установке | Руководство по обновлению | Устранение неполадок | FAQ | Все продукты ] Он обнаруживает 19 различных гармонических ценов
Индикатор точно показывает точки разворота и зоны возврата цены, где входят крупные игроки . Вы видите, где формируется новый тренд, и принимаете решения с максимальной точностью, держа контроль над каждой сделкой. VERSION MT5     -     Раскрывает свой максимальный потенциал в связке с индикатором  TREND LINES PRO Что показывает индикатор: Разворотные конструкции и разворотные уровни с активацией в начале нового тренда. Отображение уровней  TAKE PROFIT  и  STOP LOSS  с минимальным соотношением
Trend Catcher   анализирует движения рыночных цен, используя комбинацию собственных и индивидуально разработанных адаптивных индикаторов анализа тренда. Он определяет истинное направление рынка, отфильтровывая краткосрочные шумы и фокусируясь на силе импульса, расширении волатильности и поведении ценовой структуры. Он также использует комбинацию сглаживающих и фильтрующих тренд индикаторов, таких как скользящие средние, RSI и фильтры волатильности. Мониторинг реальных операций, а также другие
Apollo SR Master — это индикатор уровней поддержки/сопротивления со специальными функциями, которые упрощают и повышают надежность торговли с использованием зон поддержки/сопротивления. Индикатор рассчитывает зоны поддержки/сопротивления в режиме реального времени без задержек, выявляя локальные максимумы и минимумы цены. Затем, для подтверждения сформированной зоны поддержки/сопротивления, индикатор выдаёт специальный сигнал, который сигнализирует о том, что зону поддержки/сопротивления можно у
Представляю Вам отличный технический индикатор GRABBER, который работает, как готовая торговая стратегия "Все включено"! В одном программном коде интегрированы мощные инструменты для технического анализа рынка, торговые сигналы (стрелки), функции алертов и Push уведомлений.  Каждый покупатель этого индикатора получает дополнительно БЕСПЛАТНО:  Grabber Утилиту для автоматического управления открытыми ордерами, Пошаговый видео-мануал : как установить, настроить и торговать, Авторские сет-файлы для
Advanced Supply Demand
Bernhard Schweigert
4.91 (300)
Специальное предложение – скидка 40% Этот индикатор является уникальным, качественным и доступным инструментом для торговли, включающим в себя наши собственные разработки и новую формулу. В обновленной версии появилась возможность отображать зоны двух таймфреймов. Это означает, что вам будут доступны зоны не только на старшем ТФ, а сразу с двух таймфреймов - таймфрейма графика и старшего: отображение вложенных зон. Обновление обязательно понравится всем трейдерам, торгующим по зонам спроса и пре
Сигнал GoldRush Trend Arrow Индикатор GoldRush Trend Arrow Signal предоставляет точный анализ тренда в режиме реального времени, специально разработанный для высокоскоростных краткосрочных скальперов в XAU/USD. Этот инструмент, созданный специально для 1-минутного таймфрейма, отображает стрелки направления для четких точек входа, позволяя скальперам уверенно ориентироваться в волатильных рыночных условиях. Индикатор состоит из ПЕРВИЧНЫХ и ВТОРИЧНЫХ стрелок оповещения. ПЕРВИЧНЫЕ сигналы — это
Introduction to Fractal Pattern Scanner Fractal Indicator refers to the technical indicator that makes use of the fractal geometry found in the financial market. Fractal Pattern Scanner is the advanced Fractal Indicator that brings the latest trading technology after the extensive research and development work in the fractal geometry in the financial market. The most important feature in Fractal Pattern Scanner is the ability to measure the turning point probability as well as the trend probabi
В НАСТОЯЩЕЕ ВРЕМЯ СКИДКА 40% Лучшее решение для новичка или трейдера-эксперта! Этот индикатор является уникальным, высококачественным и доступным торговым инструментом, поскольку мы включили в него ряд собственных функций и новую формулу. С помощью всего лишь ОДНОГО графика вы можете определить силу валюты для 28 пар Форекс! Представьте, как улучшится ваша торговля, потому что вы сможете точно определить точку запуска нового тренда или возможность скальпирования? Руководство пользователя:  
Cycle Sniper
Elmira Memish
4.39 (36)
Please contact us after your purchase and we will send you the complimentary indicators to complete the system Cycle Sniper is not a holy grail but when you use it in a system which is explained in the videos, you will feel the difference. If you are not willing to focus on the charts designed with Cycle Sniper and other free tools we provide, we recommend not buying this indicator. We recommend watching the videos about the indiactor and system before purchasing. Videos, settings  and descri
Market Structure Patterns   is an indicator based on   smart money concepts   that displays   SMC/ICT   elements that can take your trading decisions to the next level. Take advantage of the   alerts ,   push notifications   and   email messages   to keep informed from when an element is formed on the chart, the price crosses a level and/or enters in a box/zone. Developers can access the values of the elements of the indicator using the   global variables  what allows the automation of trading d
Advanced UT BOT ALERTS for MT4 Профессиональная система обнаружения тренда с многоуровневыми фильтрами | Улучшенный движок UT BOT Мы предоставляем только индикаторы высокого качества. Advanced UT BOT создан для профессионального использования и имеет устойчивую логику сигналов и безопасные расчёты, исключающие задержки или ложные обновления. Он не перерисовывает, не удаляет и не изменяет прошлые сигналы. Все сигналы BUY и SELL генерируются только после закрытия свечи и остаются зафиксированными.
Свяжитесь со мной после покупки, чтобы получить бонусный EA на основе этого индикатора. Self Optimizing Double MA Strategy — это торговый инструмент профессионального уровня, созданный для того, чтобы исключить необходимость угадывать параметры. Оснащенный встроенным механизмом автооптимизации, он непрерывно адаптируется к меняющимся рыночным условиям, моделируя тысячи комбинаций параметров в фоновом режиме для сохранения статистического преимущества. Вместо того чтобы полагаться на статические
Day Trader Master - это полноценная торговая система для трейдеров, кто ведет внутридневную торговлю. Система состоит из двух индикаторов. Один индикатор представляет собой стрелки-сигналы на покупку и продажу. Именно стрелочный индикатор вы приобретаете. Второй индикатор я предоставлю вам совершенно бесплатно. Второй индикатор является индикатором тренда, специально разработанного для использования совместно с этими стрелками. ИНДИКАТОРЫ НЕ ПЕРЕРИСОВЫВАЮТСЯ И НЕ ЗАПАЗДЫВАЮТ! Использовать данную
Candle Power Pro
Thushara Dissanayake
4.5 (8)
The       Candle Power Pro       это сложный торговый инструмент, предназначенный для расшифровки       давление реального объема, дисбаланс тиковых данных и динамика потока институциональных заказов       путем измерения       битва между бычьими и медвежьими клещами       в режиме реального времени. Этот индикатор преобразует сырые       объемные данные в действенные идеи   , помогающие трейдерам идентифицировать       Движения «умных денег», охота за ликвидностью и скрытая психология рынка  
Если вы торгуете на Форекс, наличие подробной информации о силе валют и корреляции валютных пар может вывести вашу торговлю на новый уровень. Корреляция поможет сократить риск вдвое, а анализ силы валют поможет максимизировать прибыль. Этот индикатор предлагает гибридный подход к выбору наиболее подходящих валютных пар, используя анализ силы валют и корреляцию валютных пар. Как использовать анализ силы валют Предположим, ваша торговая стратегия показывает возможность покупки по AUD/JPY, но при
CRT Candle Range Theory HTF MT4.   Ultimate CRT Indicator: Advanced ICT Concepts and Malaysian SnR Trading System Discounted   Price   $50  !!     Secure your lifetime access   now   before it switches to   subscription-only ! Master the Market Maker's Footprints with the Most Advanced Candle Range Theory Indicator Unlock the true power of   Smart Money Concepts (SMC)   and trade precisely like the institutions with the   Ultimate CRT Indicator . Built exclusively for serious traders, this indic
Route Lines Prices - индикатор разработанный для поиска направлений цены. Простой интерфейс индикатора содержит в себе множество алгоритмов поведения цены и расчет будущих направлений. В алгоритмах содержатся расчеты волатильности и сглаживание цены в соответствии с используемыми тайм-фреймами. Индикатор имеет единственный параметр для изменения значений " Calculating price values ". Значение по умолчанию 1 имеет сбалансированную автоматическую форму расчетов, которой можно пользоваться без с
KURAMA GOLD SIGNAL PRO (MT4) — Полная Торговая Система XAUUSD с 7-Слойным Фильтром, Автоматическим TP/SL и Оценкой Качества БЕЗ ПЕРЕРИСОВКИ. БЕЗ ПЕРЕПРОРИСОВКИ. БЕЗ ЗАДЕРЖКИ. Каждый сигнал постоянен. То, что вы видите, то и получаете. БОНУС: Купите пожизненную лицензию и получите AI Zone Radar (стоимость $59) + полное руководство PDF БЕСПЛАТНО. Напишите мне после покупки. AI Zone Radar: https://www.mql5.com/en/market/product/175834 ДОВЕРИЕ ТРЕЙДЕРОВ: Уже используется активным сообществом тре
Другие продукты этого автора
Fibo Projection
Noor Ghani Rahman
5 (1)
This tools is design to easily forecast the projection of the current trend through the inputs of Zigzag and get out of the market when the trend do not the ability to maintain it's volatility to go further... the indicator gets the initial and final price from the value of zigzag automatically by adjusting the intdepth of zigzag. You can also switch from Projection to Extension from the inputs tab of indicator.
FREE
This Indicator is made on the behalf of traders to trade inside the Gann angles. The indicator has the inside function of auto adjusting the chart window zooming in/out when the terminal is connected to the internet and new Tick come to draw the angles on the proper way of price and time. The angle would be not drawn until the suitable zooming is not achieved upon tick by tick. The starting value of angle drawn is calculated the Zigzag indicator. The zigzag can be adjusted through the back-cand
In the financial world, risk management is the process of identification, analysis and acceptance of uncertainty in investment decisions. Essentially, risk management occurs when an investor or fund manager analyzes and attempts to quantify the potential for losses in an investment, such as a moral hazard, and then takes the appropriate action given his investment objectives and risk tolerance. This tool should be the success key before you lost your capitals due to the unawareness of market beh
Pivot Point is a technical tool widely used by traders to predict major support and resistance price levels by calculating previous history and to predict the current price reversal points. Traders want to determine about the swing point from which there should be much possibility that the market price will be getting back, in such analysis pivot point plays an important rule. Different site explaining the logic of pivot point as: A technical analysis indicator used to determine the overall tr
Hedging Martingale EA The EA open first 9 Trades of initial Lotsize and from 10 - 19 of Multiplier in the sequence of 10 - 19, 20 - 29, 30 - 39 etc,. which minimize the risk to your capital and calculate the Average TP for Buy and Sell side orders as two TPs, The EA can be test on Meta Terminal Tester, the EA is opening many trades so initial lotsize of 0.01 is best on history record, but you can test by yourself higher lot of 0.02 and 0.03 while the tested timeframe is 30 minutes and 1 hour is
Mechanism : The EA opening trade base on the standard " Japanese CandleSticks Technical Analysis " and confirming the signal by various reversal zone define by "Divergence, Support and Resistance, and some common Indicators like Sto, Bollinger Band, MACD etc" under the CONFIRMATION INPUTS SETTINGS (True/false option). Lot Method: The EA is Implemented with fixed lot size and Auto lot base on specified Risk Management System base on the available account balance by some percent risk of that's. Tr
Japanese candlesticks can be used for any time frame, whether it be one day, one hour, 30-minutes ….whatever you want! They are used to describe the price action during the given time frame. Japanese candlesticks are formed using the open, high, low, and close of the chosen time period. CandleStick Scanner X provides market analysis through the detection and analysis of Japanese candlestick patterns. Candlestick based market analysis is one of the most popular technical analysis methods. Combina
The Ikka Martingale Strategy The EA is design to trade on the basis of martingale with average TP, but here it start from two type of initial trades " Limit Orders and Stop Orders Pending"  for determination of trend direction so You should be want to run different different settings for every pair as you will Optimize the that pair and it will make Profit as It only closes the Open trades on specified Take Profit value in Points.
Beta Hedging EA The EA is trading in Martingale style whether you want to trade at a time sell side or buy side (Selectable) with Increasing Lot/Grid or you can keep these two Constant,... ======= >>>   The EA is design specitially for ECN account so always be test zero spread accounts   <<< ======= This is Martingale base EA so should be want to have at least 3000$ for Per Pair Trading. EURUSD <= 2 spread GBPUSD <= 4 spread NZDUSD <= 4 spread AUDUSD <= 4 spread Trade Closing System: There is Ta
Auto GMT Base Session Indicator "The Link to find your session time base on your GMT is given inside the indicator Description" You can find your GMT Zone and Session times from the following website to insert into this Indicator inputs, and keep the Keep GMT On as true for the first time, when you determine your Session Times according to your GMT base then you can keep this inputs as false and modify your session time according to your broker, GMT calculation is only need when you don't know t
Фильтр:
tito_xs
248
tito_xs 2023.08.05 22:18 
 

Doesn't worth a dime !

Ответ на отзыв