Ultra Confluence MT4

Ultra Confluence is a trend indicator for MetaTrader 4 built around a trailing stop that picks its own width. A normal SuperTrend uses one ATR multiplier forever. This one runs nine of them side by side (1.0 to 5.0 in steps of 0.5), keeps score of how each has been doing, sorts them into three groups with k-means clustering on every bar, and trails price with the average multiplier of the best group. Around it sit an ATR-based Ichimoku cloud, a liquidity and sentiment volume profile, volume-coloured candles and swing labels with the candle pattern at each pivot.

On 10,001 hourly gold bars (March 2025 to November 2026) the multiplier it chose went all the way from 1.0 to 5.0, with a median of 2.75. So it really does move, and it moves on its own.

What's different from a plain SuperTrend

What you want What a fixed SuperTrend does What Ultra Confluence does
A stop width that suits the current market One multiplier you guessed once Picks it every bar from the best-performing group of nine
Know how much to trust a flip Every arrow looks the same Prints a 0-10 score next to each flip
Room for a pullback Tightens every bar, so pullbacks stop you out Only tightens while the previous close is on the trend side of the Tenkan line
Context around the line Nothing Cloud, volume profile, liquidity zones, swing labels

The third row is the one nobody tells you about, so here's what it means in practice. In a downtrend the stop only steps down while the previous close sits below the Tenkan. Once price closes back above it, the stop is rebuilt from scratch and can jump up, away from price. On EURUSD H4 it did exactly that on 14-15 October 2026, going from 1.12223 to 1.13595 in a day, 137 pips looser. On gold H1 the stop backed away on 2,490 of the 9,892 bars that were inside a trend, about one bar in four.

That's good if you want to stay in a trend through a pullback. If you were planning to use the line as a hard stop loss, you need to know it can move against you.

What it draws

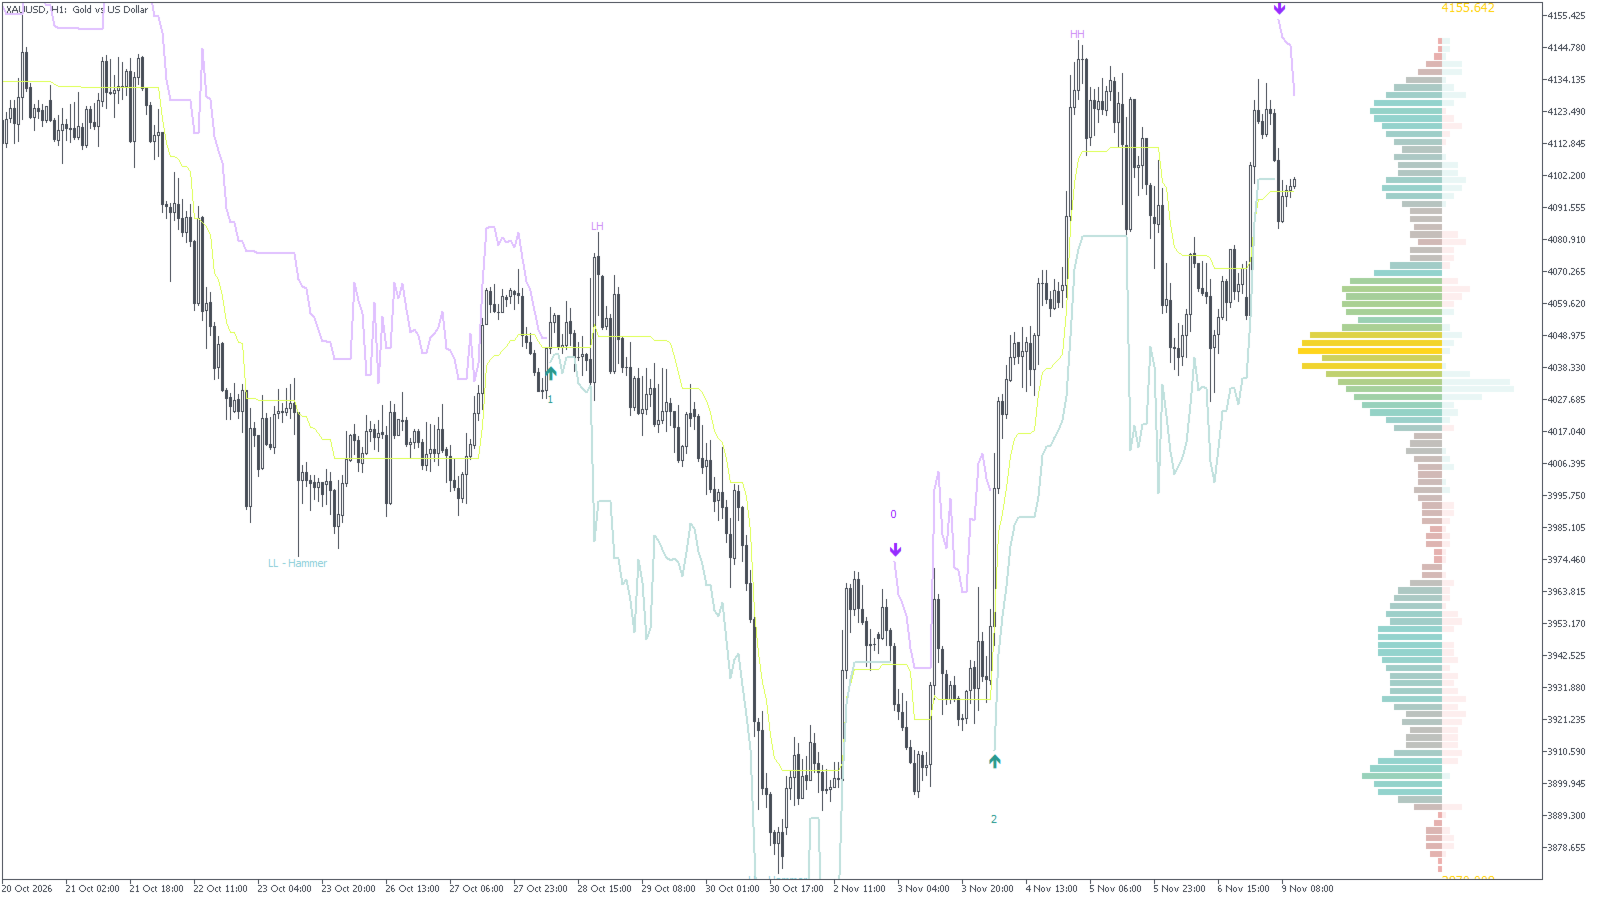
Adaptive trailing stop + signals (on). The line, an arrow when it flips, and a score next to it. Two extra lines are off by default: a smoothed copy of the stop coloured by whether the Tenkan is above or below it, and an adaptive moving average (TRAMA, 52) that speeds up when price makes new 52-bar highs or lows.

ATR Ichimoku (Tenkan on, the rest off). Tenkan, Kijun and Span B aren't midpoints of high/low here. Each is the middle of the range an ATR trailing stop has covered (9 x 3, 26 x 6, 52 x 9 ATR), so they step instead of wobbling. Only the Tenkan is shown by default, because it decides when the stop may tighten. Kijun with the cross dots, the cloud (2 bars forward) and the Chikou (2 bars back) each have their own switch.

Liquidity sentiment profile (on). On the last 333 bars by default: a volume profile and a buy-minus-sell profile next to it. Switch on the liquidity zones and the thin-volume rows get shaded across the range as buyside (above the busiest row) or sellside (below it) liquidity.

Volume candles (MT5, off). Candles are shaded by tick volume against its own 9-bar volume-weighted average, six shades per direction. The wicks turn teal or purple depending on whether today's running volume is rising or falling versus the last three days at the same hour.

Swing labels (on). HH, LH, HL, LL on 52/52 pivots, plus the candle pattern at that pivot when there is one (hammer, inverted hammer, engulfing, hanging man, shooting star). Hover a label for a one-line description.

Retracement fans (off). Highest and lowest close of the last 900 bars with levels at .163, .333, .432, .639 and .963. Those aren't Fibonacci ratios. I've kept them because they're part of the tool, but I've got no evidence they work better than the usual ones, so treat them as rough zones.

It doesn't draw order blocks or fair value gaps, it doesn't give TP levels, and it doesn't place trades.

Reading the score

The number next to each flip is the best group's recent performance divided by the average bar move, times ten. It isn't a probability. On gold H1 the 108 flips scored like this: 46 got a 0, 26 a 1, 12 a 2, 15 a 3, and only 9 scored 4 or more (the highest was 6). A 0 means even the best multipliers weren't making progress, which is pretty much what a range looks like. The EURUSD H4 sell on 16 September 2026 scored 5 and was followed by a 359-pip fall, but one example proves nothing, so I'd use the score to skip the 0s, not to size up on the 5s.

Settings

Out of the box you get the stop with its scores, the Tenkan, the volume profile and the swing labels. Everything else is one switch in the inputs: Kijun, cloud, Chikou, liquidity zones, volume candles, TRAMA, the smoothed stop, the retracement fans and the cluster table.

Setting Default What it does When to change it
Factor Range 1 to 5 Lowest and highest ATR multiplier tried Narrow it if the stop is too loose or too tight overall
Step 0.5 Gap between multipliers (9 lines at default) Smaller = more lines, slower
Performance Memory 33 How many bars each line's score remembers Lower reacts faster
From Cluster Best Which group drives the stop Average gives a calmer line
Historical Bars Calculation 10000 Bars the clustering runs on Lower if loading is slow
Anchor Period Fixed Range (333) Window of the volume profile Day / Week / Swing High for session profiles
Swing length 52 Pivot size for the HH/LL labels 10-20 for intraday swings

Alerts for flips and Tenkan/Kijun crosses go to popup, phone, email and on MT5 Telegram. They're off by default and wait for the bar to close.

What this version can't do

The profile and the fans are drawn to the right of the last bar, so switch on chart shift or you'll only see their edge (MT4 especially). Swing labels show up 52 bars after the pivot, because that's how long the pivot needs to be confirmed. There's no stop before the last 10,000 bars. MT4 can't colour candles, so the volume candles and wicks are MT5 only; the MT4 cloud is drawn with thin vertical lines.

You won't find a win rate table here, and I'd be careful with any indicator listing that has one.

Questions you'll have

Does Ultra Confluence repaint? Closed bars don't change. The stop and the arrow are calculated on the forming bar too, so a flip can appear and disappear before the close, like any trailing stop. Alerts wait for the close by default, and swing labels are only drawn from closed bars.

Why did the trailing stop move away from price? The previous close went to the wrong side of the Tenkan line, so the stop was rebuilt at today's distance instead of tightening. It happens on about a quarter of trend bars on gold H1.

What does the number next to the arrow mean? It's the best group's performance against the average bar move, times ten. 0 means nothing was trending. It's not a win probability.

What are the best settings for Ultra Confluence? I've only looked at the defaults on gold H1, gold H4, EURUSD H1 and EURUSD H4, so I'd start there and change Factor Range and From Cluster first.

Is there an MT5 version? Yes, listed separately as Ultra Confluence. It calculates the same values bar for bar and adds the volume candles, the coloured wicks, a filled cloud and Telegram alerts, which MT4 can't draw.

Can an EA read the signals? Yes. Buy and sell arrows, direction, the score and the chosen multiplier all have their own buffers: 28, 29, 30, 31 and 32 on MT5, 12, 13, 14, 15 and 16 on MT4.

Support

Send me a private message here on MQL5 with a screenshot, the symbol and the timeframe. Updates are free.

Analysis tool. It places no trades and makes no profitability claim. Past price behaviour is not a guide to future price behaviour.

Рекомендуем также
Alpha Trend sign - это мой давний и очень популярный торговый инструмент, который проверяет нашу торговую систему и четко сигнализирует о транзакциях, которые не дрейфуют.   Основные функции:   • В зависимости от того, показывает ли рынок активную область, показатели могут быть очень интуитивными, чтобы определить, является ли текущая конъюнктура трендовой или шоковой.   И в соответствии с индикатором стрелка врезается на рынок, зеленая стрела подсказывает купить, красная стрела подсказывает
The CCI Divergence is a reasonably useful indicator in itself, but it is even more effective when used with divergence pattern trading. The CCI Divergence indicator signal is one of the most potent signals among the indicators that exist in the market. Here is new version for Divergence Indicator using CCI method, with more improvements. Divergences indicate a potential investment point because the directional moment does not confirm the price. A bullish divergence occurs when the underlying va
反转边缘系统 — профессиональный индикатор разворота вершин и дна для MetaTrader 5. Он определяет потенциальные зоны разворота тренда, генерирует четкие торговые сигналы и фильтрует их с помощью анализа тренда на нескольких таймфреймах для уменьшения ложных сетапов. Индикатор отображает рыночный настрой в реальном времени: Сильный бычий настрой Сильный медвежий настрой Слабый бычий настрой Слабый медвежий настрой Конфликт быков 和 медведей Каждый сигнал поставляется с заранее заданными уровнями 止盈 (TP)
Rainbow Price Visualizer v1.21 See where the market really breathes. Turns your MT4 chart into an ultra-precise heatmap that highlights price zones favored by big players. Why it matters 300 price levels at 0.2‑pip resolution — microscopic detail. 8 visual themes (Rainbow, Fire, Ocean…) for instant readibility. Smart opacity: low noise fades, real zones pop. Lightweight rendering with automatic cleanup. Fully customizable: saturation, opacity, resolution, history depth. Bands project into the f
"Тренд - друг трейдера" . Это одна из самых известных пословиц в трейдинге, потому что правильное определение тренда может помочь заработать. Однако проще сказать о торговле по тренду, чем сделать, потому что многие индикаторы основаны на развороте цены, а не на анализе тренда. Они не очень эффективны при определении периодов тренда или в определении того, сохранится ли этот тренд. Мы разработали индикатор Trendiness Index , чтобы попытаться решить эту проблему. Индикатор определяет силу и напра
El indicador "MR BEAST ALERTAS DE LIQUIDEZ" es una herramienta avanzada diseñada para proporcionar señales y alertas sobre la liquidez del mercado basándose en una serie de indicadores técnicos y análisis de tendencias. Ideal para traders que buscan oportunidades de trading en función de la dinámica de precios y los niveles de volatilidad, este indicador ofrece una visualización clara y detallada en la ventana del gráfico de MetaTrader. Características Principales: Canal ATR Adaptativo: Calcula
CRT Candle Range Theory HTF MT4 - Ultimate CRT Indicator: Передовые концепции ICT и торговая система Malaysian SnR Освойте следы маркетмейкеров с помощью самого передового индикатора Candle Range Theory. Раскройте истинную силу Smart Money Concepts (SMC) и торгуйте точно так же, как институциональные участники, с помощью Ultimate CRT Indicator. Созданный исключительно для серьезных трейдеров, этот индикатор автоматизирует высокоэффективную теорию CRT (Candle Range Theory), являющуюся основой кон
Trade with Gann on your side!! MASTER CIRCLE 360 CIRCLE CHART, originally created by Gann admitted that this is “The Mother of all charts”. It is one of the last studies that this great trader left for us. The numeric tab le is apparently quite simple like all the tables and is based on square numbers, the SQUARE OF 12 and is by evolution, one of the most important square numbers. Here we can find CYCLE, PRICE AND TIME thanks to angles and grades, to show past and future support and resistance.
The   Fibonacci Confluence Toolkit   is a technical analysis tool designed to help traders identify potential price reversal zones by combining key market signals and patterns. It highlights areas of interest where significant price action or reactions are anticipated, automatically applies Fibonacci retracement levels to outline potential pullback zones, and detects engulfing candle patterns. Its unique strength lies in its reliance solely on price patterns, eliminating the need for user-define
Overview Harmonic Patterns MT4 is a technical analysis indicator designed for the MetaTrader 5 platform. It identifies and displays harmonic price patterns, such as Butterfly, Cypher, Crab, Bat, Shark, and Gartley, in both bullish and bearish directions. The indicator calculates key price levels, including entry, stop loss, and three take-profit levels, to assist traders in analyzing market movements. Visual elements and customizable alerts enhance usability on the chart. Features Detects six ha
"Impulses and Corrections 4" создан для того, чтобы помочь трейдерам ориентироваться в рыночной ситуации. Индикатор показывает мультитаймфреймовые восходящие и нисходящие импульсы ценовых движений. Эти импульсы служат основой для определения "Базы" , состоящей из зон "Коррекции" ценовых движений, а также имеет "Потенциальные" зоны для возможных сценариев движения цены. Восходящие и нисходящие импульсы определяются на основе модифицированной формулы индикатора "Фракталы" Билла Вильямса. Последни
Это, пожалуй, самый полный индикатор автоматического распознавания гармонического ценообразования, который вы можете найти для платформы MetaTrader. Он обнаруживает 19 различных паттернов, воспринимает проекции Фибоначчи так же серьезно, как и вы, отображает зону потенциального разворота (PRZ) и находит подходящие уровни стоп-лосс и тейк-профит. [ Руководство по установке | Руководство по обновлению | Устранение неполадок | FAQ | Все продукты ] Он обнаруживает 19 различных гармонических ценов
Суть данного индикатора - анализ и предсказание котировок с помощью преобразования Фурье. Индикатор раскладывает ряд цен на гармоники и вычисляет их продукт на следующих барах. Индикатор выводит на истории ценовые метки, обозначающие размах цен в прошлом, а также ценовые метки с предполагаемым движением в будущем. Также прогнозируемое решение о покупке или продаже и размер take profit указывается в текстовой метке в окне индикатора. Индикатор использует в качестве "движка" для расчетов другой ин
Индикатор Crypto_Forex "Auto FIBO Pro" - отличный вспомогательный инструмент в торговле! - Индикатор автоматически рассчитывает и размещает на графике уровни Фибоначчи и локальные линии тренда (красного цвета). - Уровни Фибоначчи указывают ключевые области, где цена может развернуться. - Наиболее важными уровнями являются 23,6%, 38,2%, 50% и 61,8%. - Вы можете использовать его для скальпинга на разворот или для торговли по зональной сетке. - Существует множество возможностей улучшить вашу текущ
Distinctive это трендовый стрелочный индикатор форекс для определения потенциальный точек входа. Нравится он, прежде всего, тем, что в нём заложен простой механизм работы, адаптация ко всем временным периодам и торговым тактикам. СОздан на основе канала регрессии с фильрами. Отображаем сигналы индикатора Lawrence на графике функции цены используя математический подход.  Принцип работы - при пробитии цены в зоне перекупленности/перепроданности (уровней канала) генерируется сигнал на покупку или
Color Stochastic Enhanced Stochastic Oscillator with Cross Detection and Visual Signal Support Overview Color Stochastic is a customized version of the classic Stochastic Oscillator designed for momentum analysis and crossover visualization. The indicator provides color-based signal marking and configurable crossover detection at user-defined overbought and oversold levels. It can be used as part of: Momentum analysis Mean reversion workflows DCA-based strategies Multi-indicator confirmation sys
UniversalIndicator - универсальный индикатор. Отличный помощник для начинающих и профессиональных трейдеров. В алгоритме индикатора используются вероятностные и статистические методы анализа цены торгового инструмента. Индикатор устанавливается обычным образом. Преимущества индикатора работает на любом временном периоде работает с любым торговым инструментом имеет высокую вероятность положительного прогноза не перерисовывается Параметры индикатора LengthForecast  =30 - количество прогнозируемых
Monster Harmonics - индикатор гармонических моделей (harmonic patterns). Он распознает следующие модели: Гартли (Gartley), Летучая мышь (Bat), Краб (Crab), Бабочка (Butterfly), Монограмма (Cypher), Черный лебедь (Black Swan), Белый лебедь (White Swan), Акула (Shark) и AB=CD. Незаконченные модели также распознаются. Monster даже показывает потенциальную зону разворота (Potential Reversal Zone, PRZ). Пользователи могут добавлять свои паттерны. Кроме текущей модели, Monster также показывает все мод
Day Pattern
Oleksandr Martsynyshen
Описание: - Day Patten – индикатор помогает выявить закономерности изменения цен для разработки торговых стратегий и алгоритмов Для кого предназначен ? - Для разработчиков торговых стратегий и алгоритмов. - Середньо строчных трейдеров торгующих на тайм фреймах Н1-W1. Особенности индикатора: - присутствует функция экспорта значений индикатора в файл формата csv. - С помощью информационной панели можно проводить экспресс анализ инструмента. - Индикатор подходит для исследования любых торговы
Этот индикатор был создан для агрессивного скальпинга и быстрых входов в бинарных опционах , генерируя сигналы на каждой свече , чтобы вы всегда точно знали, что происходит. Присоединяйтесь к каналу Happy Scalping: MQL5 Не перерисовывается : сигнал на текущей свече формируется в РЕАЛЬНОМ ВРЕМЕНИ , то есть он может изменяться, пока свеча ещё формируется, в зависимости от того, растет ли цена или падает по сравнению с закрытием предыдущей свечи. Но как только свеча закрывается , цвет сигнала фик
The   RSI Divergence + FVG Signal   indicator combines   Relative Strength Index (RSI) Divergence   with   Fair Value Gap (FVG)   detection to generate high-probability buy and sell signals based on both momentum shifts and institutional imbalance zones. Core Features: RSI Divergence Detection : Identifies both regular and hidden bullish/bearish divergences between price and RSI. Divergences indicate potential trend reversals or continuation. FVG Zone Recognition : Detects Fair Value Gaps (imbal
Chart Patterns Detect 15 patterns (Ascending Triangle, Descending Triangle, Rising Wedge, Falling Wedge, Bullish Flag, Bearish Flag, Bullish Rectangle, Bearish Rectangle Symmetrical triangle, Head and Shoulders, Inverted Head and Shoulders, Triple top, Triple Bottom, Double Top, Double Bottom) Use historical data to calculate the probability of each pattern to succeed (possibility to filter notification according to the chance of success) gives graphic indication about the invalidation level and
VR Cub
Vladimir Pastushak
VR Cub это индикатор что бы получать качественные точки входа. Индикатор разрабатывался с целью облегчить математические расчеты и упростить поиск точек входа в позицию. Торговая стратегия, для которой писался индикатор, уже много лет доказывает свою эффективность. Простота торговой стратегии является ее большим преимуществом, что позволяет успешно торговать по ней даже начинающим трейдерам. VR Cub рассчитывает точки открытия позиций и целевые уровни Take Profit и Stop Loss, что значительно повы
Индикатор определяет и отображает на графике гармоничный паттерн 3 Движения (3 Drives), согласно схеме, приведенной на скриншоте. Выделение паттерна производится по вершинам индикатора ZigZag (включен в ресурсы, не требует дополнительной установки). В момент распознавания паттерна выводится сообщение во всплывающем окне, отправляются оповещения на мобильное устройство и электронный почтовый ящик. Индикатор выделяет не только завершенную фигуру, но и момент ее формирования. На этапе формирования
SG ZigZag Trend PRO SG ZigZag Trend PRO is a professional market structure and trend visualization indicator for MetaTrader 4. The indicator is designed to make price swings, market structure and potential reversal areas easier to identify directly on the chart. It combines ZigZag-based swing analysis with additional trend information, moving averages and visual BUY/SELL indications in a clean trading interface. MAIN FEATURES • Automatic detection of significant market swing points • HH, HL
Reversal Pattern Pro
Boonyapagorn Rodvattanajinda
Reversal Patterns Pro Reversal Patterns Pro is a Price Action (PA) analytical tool that scans the reversal patterns.  - Finds and marks the most dependable Japanese candlestick patterns in real-time. - Supports all time frames (Best for Scalping) - Doesn't repaint making it an exceptional indicator for Expert Advisors. Input parameters : - Support & Resistance Mode ( true or false ) for enabling advanced filtering - Donchian Period - RSI Period - RSI Oversold Level - RSI Overbought Level - Al
Это трендовый индикатор без перерисовки Разработан вместо стратегии бля бинарках опционов (по цвету свечи мартингейл) Так же хорошо работает в торговле на рынке форекс Когда открывать сделки ( бинарные опционы ) Сигнал появится в месте с свечой сигналит на текущую свечу  Открывать сделку стоит на одну свечу текущего таймфрейма рекомендуется м1 и М5 При появлении синей точки открываем сделку вверх При появлении красной точки открываем сделку в низ. Как открывать сделки на Форекс. При получени
Master Dot for MetaTrader 4 Detect Volatility Exhaustion Before the Market Returns to Balance Master Dot is a professional non-repainting indicator designed to detect moments when price moves beyond its statistically expected volatility range. These situations often occur during sharp market impulses, liquidity grabs or temporary emotional moves, when price departs from its normal trading conditions. Instead of following trends, Master Dot highlights volatility exhaustion — moments where the mar
The trend is your friend! This is what this indicator is all about. Follow this famous saying and be safe. Characteristics: Buy/Sell signals fixed on the close of a bar. Works on all symbols and all timeframes. Clear visual market trend laser line, Buy/Sell signal arrows, market strength meter, TP1 & TP2 boxes. Visual signals when to enter, when to exit the market. No repainting. Compatible with Flexible EA for trading automation. (Ask for a free set file optimized to perform 2010-2018) Parame
Индикатор LineMagnit для MT4 - высокоточный индикатор, который строит уровни поддержки и сопротивления, притягивающие к себе цену по принципу магнита. Это позволяет трейдеру легко определить наиболее вероятные точки входа и выхода из рынка, а также определить направление сил в рынке так как уровни строятся на основе вливаний капитала в инструмент. Индикатор LineMagnit   оснащен интуитивно понятным графическим интерфейсом, который позволяет быстро находить и анализировать уровни поддержки и сопро
С этим продуктом покупают
Trend SniperX MT4
Sarvarbek Abduvoxobov
5 (5)
Trend Sniper X — это мультитаймфреймовый трендовый индикатор для MetaTrader 5, который помогает трейдерам точно и четко определять направление тренда и потенциальные точки разворота. Для MT5: https://www.mql5.com/en/market/product/181101 Информация о цене: Текущая цена является промо-ценой и может измениться по мере выхода новых обновлений и функций. Канал Code2Profit Освойте рынок с помощью мультитаймфреймового анализа! Как максимизировать процент побед с Trend Sniper X: ключевые правила и сове
Scalper Vault — это мощная, полноценная торговая система, созданная для трейдеров, которые стремятся к стабильным результатам в внутридневной торговле. Этот высокоточный индикатор представляет собой комплексное, самостоятельное торговое решение, обеспечивающее аналитику профессионального (институционального) уровня как для торговли на рынке Forex, так и для работы с бинарными опционами. Пожалуйста, свяжитесь со мной после покупки, чтобы получить мои торговые советы, а также отличный бонус! Исклю
Currency Strength Wizard — очень мощный индикатор, предоставляющий вам комплексное решение для успешной торговли. Индикатор рассчитывает силу той или иной форекс-пары, используя данные всех валют на нескольких тайм фреймах. Эти данные представлены в виде простых в использовании индексов валют и линий силы валют, которые вы можете использовать, чтобы увидеть силу той или иной валюты. Все, что вам нужно, это прикрепить индикатор к графику, на котором вы хотите торговать, и индикатор покажет вам ре
PRO Renko System - это высокоточная система торговли на графиках RENKO. Система универсальна. Данная торговая система может применяться к различным торговым инструментам. Система эффективно нейтрализует так называемый рыночный шум, открывая доступ к точным разворотным сигналам. Индикатор прост в использовании и имеет лишь один параметр, отвечающий за генерацию сигналов. Вы легко можете адаптировать алгоритм к интересующему вас торговому инструменту и размеру ренко бара. Всем покупателям с удовол
SR Liquidity — это торговый индикатор, предназначенный для выявления скрытых зон, где концентрируется рыночная ликвидность и наблюдается наиболее сильная реакция цены. Эти особые зоны ликвидности выступают в качестве мощных уровней поддержки и сопротивления, предоставляя вам четкую картину того, где с наибольшей вероятностью произойдет разворот рынка. Вместо построения стандартных линий поддержки и сопротивления, индикатор SR Liquidity анализирует реальное поведение цены, выявляя зоны концентрац
Atomic Analyst — MetaTrader 4 По вопросам продукта, настройки или технической поддержки напишите мне напрямую здесь, на MQL5. Индикатор превращает сложные рыночные расчеты в простые визуальные сигналы, цветные свечи, показания тренда, уровни стоп-лосса и несколько зон тейк-профита, которые трейдеры могут быстро понять и использовать в реальных рыночных условиях. Основные варианты использования: Скальпинг и внутридневная торговля: Создан для быстрого принятия решений, четких стрелок, алертов, цв
Smart Trend Trading System — индикатор для MetaTrader 4, который объединяет информацию о тренде, сигналы входа и выхода и ценовые уровни на одном графике. Система объединяет более 10 торговых инструментов в одном решении, включая определение тренда, зоны разворота, Smart Cloud, логику трейлинг-стопа, поддержку и сопротивление, окраску свечей, уведомления и мульти-таймфрейм анализ. Система создана, чтобы помочь вам торговать в разных рыночных условиях: Трендовые рынки: Определяйте главный тренд,
SIO Oscillator: самооптимизирующийся осциллятор дисбаланса семивариаций Купите индикатор и получите советник (EA) на его основе БЕСПЛАТНО. Большинство осцилляторов воспринимают любое движение цены одинаково. SIO разделяет давление покупателей и продавцов и измеряет дисбаланс между ними, показывая, какая сторона действительно контролирует рынок. Когда дисбаланс достигает экстремума, SIO выдаёт чёткий сигнал с уровнями входа, Stop Loss и Take Profit. Главное отличие SIO в том, что он не полагается
Quant Direction
Georgios Kalomoiropoulos
Quant Direction — это инструмент трехмерного анализа рынка. Он обеспечивает полностью объективный, основанный на алгоритмах анализ рынка, одновременно вычисляя точные процентные отклонения по нескольким параметрам. Разработанный с использованием передовых инструментов моделирования на основе искусственного интеллекта и тщательно протестированный, алгоритм предназначен для интерпретации рынка с уникальной точностью. Он может анализировать любую валютную пару или финансовый инструмент на вашей пла
TREND LINES PRO помогает понять, где рынок действительно меняет направление. Индикатор показывает реальные развороты тренда и места, где крупные участники входят повторно. Вы видите BOS-линии смены тренда и ключевые уровни старших таймфреймов — без сложных настроек и лишнего шума. Сигналы не перерисовываются и остаются на графике после закрытия бара. VERSION MT 5     -     Раскрывает свой максимальный потенциал в связке с индикатором  RFI LEVELS PRO Что показывает индикатор: Реальные смены   тр
AW Prime Oscillator
AW Trading Software Limited
5 (1)
Комбинация из двух осцилляторов. Первый отображает точки входа, второй - текущий тренд. Индикатор может отображать сигналы осцилляторов стрелками в двух режимах, все сигналы быстрого осциллятора или сигналы только по текущему тренду. Имеет мультитаймфреймовую панель и три типа уведомлений о появлении сигнала.   Преимущества: Подходит для дневной и скальпирующей торговли Трендовая фильтрация Простая и чувствительная настройка Мультитаймфреймовая панель Подходит для интеграции в советник.  Работае
M1 Sniper
Oleg Rodin
4.97 (30)
M1 SNIPER — это простая в использовании торговая система. Это стрелочный индикатор, разработанный для тайм фрейма M1. Индикатор можно использовать как отдельную систему для скальпинга на тайм фрейме M1, а также как часть вашей существующей торговой системы. Хотя эта торговая система была разработана специально для торговли на M1, ее можно использовать и с другими тайм фреймами. Первоначально я разработал этот метод для торговли XAUUSD и BTCUSD. Но я считаю этот метод полезным и для торговли на д
Hidden Cycles
Lev Vladimirovic Marushkin
5 (1)
The Only 100% Universal Tool! Stop trading against nature! This is your chance to secure the only indicator rooted in the absolute laws that govern the entire universe. Most tools guess—this one reveals the truth. Buy another toy or buy the truth. Your choice... Based on Universal Laws — NOT Some Guy’s Algorithm: Let the market adjust to the Hidden Cycles Geometry — not the other way around. Most indicators are based on a man-made formula. They often lag, fail over time, or need constant re-o
Price & Time Market Structure Indicator A professional market structure tool that analyzes waves through both price and time — not price alone. Main Description NeoWave PRO is a professional market structure indicator for MetaTrader 4 designed for traders who want to move beyond traditional one-dimensional wave tools such as ZigZag, swing indicators, and basic high/low systems. Most wave indicators analyze only one thing: Price. But a real market wave is not only a price movement. A true wave de
Этот индикатор исследует ценовую структуру фракталов разных периодов, чтобы определить возможные точки разворота на рынке, предоставляя время позиционным трейдерам, которые уже имеют фундаментальную или техническую модель оценки. В отличие от своего младшего брата, Reversal Fractals , этот индикатор не пропустит развороты из-за выбранного периода и будет находить разворотные фракталы зигзагообразно, игнорируя те развороты, которые не несут достаточного импульса для начала устойчивого движения ц
CRT Multi-Timeframe Market Structure & Liquidity Sweep Indicator Non-Repainting | Multi-Asset | MT5 Version Available MT5 Version:   https://www.mql5.com/en/market/product/162075 Full User Guide — explains what each feature does and why:   https://www.mql5.com/en/blogs/post/767525 Quick Start User Guide  — explains how to configure and in what order:  https://www.mql5.com/en/blogs/post/767540 Indicator Overview CRT Ghost Candle HTF Fractal is a complete institutional-grade market structure too
Индикатор Gann Time Clusters Индикатор основан на методе Ганна "Квадрат 9" (W. D. Gann's Square of 9) для временной оси. Он использует предыдущие точки разворота рынка, применяет формулу "Квадрата 9" Ганна, а затем делает прогноз (проекции) на будущее. Дата/время, к которому относятся прогнозы, называется 'временным кластером' ('time cluster'). Эти кластеры изображаются в виде вертикальных линий с правой стороны графика, куда рынок еще не продвинулся. Временной кластер обозначает точку разворота
Neuro Poseidon - новый индикатор от Дарьи Резуевой. Он сочетает точные торговые сигналы с адаптивными уровнями TP/SL , в результате создавая максимально выгодные сделки! TO SWITCH TO   ENG   PLEASE CHOOSE IT IN THE UPPER-RIGHT CORNER OF THE WEBSITE Напишите мне после покупки и получите Neuro Poseidon Assistant в подарок для автоматизации вашей торговли! Что отличает его от других индикаторов? 1. Доказанная прибыльность на всех активах и таймфреймах 2. На графике присутствуют только подтвержденн
This is a professional chart indicator designed for traders focused on stability and clear price action. It helps filter market noise and provides clear visual entry and exit zones for your trading decisions. Core Features: Strictly Non-Repainting: The system is built with strict non-repaint logic. What you see on the chart is the true historical performance. Confirmed Signals: Signals are triggered and confirmed only after the candle closes . Once a trading arrow appears on a closed candle, it
Forex Breath System — это торговая система, основанная на принципе торговли по тренду, которую можно использовать на любом рынке. Вы можете использовать эту систему с валютами, металлами, сырьевыми товарами, индексами, криптовалютой и даже акциями. Индикатор также можно использовать с любым тайм фреймом. Система универсальна. Он показывает тренд и подает сигналы по тренду. Индикатор может давать вам особый тип оповещений, когда сигналы появляются в направлении тренда, что упрощает торговлю. Инди
Advanced Supply Demand
Bernhard Schweigert
4.91 (302)
Специальное предложение – скидка 30% Этот индикатор является уникальным, качественным и доступным инструментом для торговли, включающим в себя наши собственные разработки и новую формулу. В обновленной версии появилась возможность отображать зоны двух таймфреймов. Это означает, что вам будут доступны зоны не только на старшем ТФ, а сразу с двух таймфреймов - таймфрейма графика и старшего: отображение вложенных зон. Обновление обязательно понравится всем трейдерам, торгующим по зонам спроса и пре
Super Signal – Skyblade Edition Профессиональная система трендовых сигналов без перерисовки и без задержек с исключительным процентом выигрышей | Для MT4 / MT5 Лучше всего работает на младших таймфреймах, таких как 1 минута, 5 минут и 15 минут. Основные характеристики: Super Signal – Skyblade Edition — это интеллектуальная система сигналов, специально разработанная для трендовой торговли. Она использует многоуровневую фильтрацию, чтобы выявлять только сильные направленные движения, подкреплённ
Liquidity Scalper System — торговая система на основе ликвидности в формате индикатора. Большинство индикаторов показывают только стрелку, а дальше трейдер сам решает, где поставить стоп, где цель и можно ли вообще доверять сигналу. Liquidity Scalper System закрывает весь цикл сделки: находит пулы ликвидности, даёт сигнал при их пробое, сразу рассчитывает Entry, Stop Loss и три цели, а на панели показывает статистику и результаты проверки на новых данных. Система сама подбирает настройки и обнов
Gann Made Easy - это профессиональная, но при этом очень простая в применении Форекс система, основанная на лучших принципах торговли по методам господина У.Д. Ганна. Индикатор дает точные BUY/SELL сигналы, включающие в себя уровни Stop Loss и Take Profit. ПОЖАЛУЙСТА, СВЯЖИТЕСЬ СО МНОЙ ПОСЛЕ ПОКУПКИ, ЧТОБЫ ПОЛУЧИТЬ ТОРГОВЫЕ ИНСТРУКЦИИ И ОТЛИЧНЫЕ ДОПОЛНИТЕЛЬНЫЕ ИНДИКАТОРЫ БЕСПЛАТНО! Вероятно вы уже не раз слышали о торговли по методам Ганна. Как правило теория Ганна отпугивает от себя не только н
В НАСТОЯЩЕЕ ВРЕМЯ СКИДКА 40% Лучшее решение для новичка или трейдера-эксперта! Этот индикатор является уникальным, высококачественным и доступным торговым инструментом, поскольку мы включили в него ряд собственных функций и новую формулу. С помощью всего лишь ОДНОГО графика вы можете определить силу валюты для 28 пар Форекс! Представьте, как улучшится ваша торговля, потому что вы сможете точно определить точку запуска нового тренда или возможность скальпирования? Руководство пользователя:  
Gold Channel is a volatility-based indicator, developed with a specific timing algorithm for the XAUUSD pair, which consists of finding possible corrections in the market. This indicator shows two outer lines, an inner line (retracement line) and an arrow sign, where the theory of the channel is to help identify overbought and oversold conditions in the market. The market price will generally fall between the boundaries of the channel. If prices touch or move outside the channel it is a tradi
В настоящее время скидка 30%! Лучшее решение для новичка или трейдера-эксперта! Эта приборная панель работает на 28 валютных парах. Он основан на 2 наших основных индикаторах (Advanced Currency Strength 28 и Advanced Currency Impulse). Он дает отличный обзор всего рынка Forex. Он показывает значения Advanced Currency Strength, скорость движения валюты и сигналы для 28 пар Forex на всех (9) таймфреймах. Представьте, как улучшится ваша торговля, когда вы сможете наблюдать за всем рынком с помощ
TDI Multi Timeframe Scanner: This Dashboard indicator uses the TDI (Trader's Dynamic Index) Indicator to find best trades. Read detailed How to Use Guide: https://www.mql5.com/en/blogs/post/758252 Extra indicators also available in above post. Checks for: - SharkFin Pattern Free indicator for SharkFin: https://www.mql5.com/en/market/product/42405/ - TDI Trend: Strong/Weak Trend Up/Down - TDI Signal: Strong/Medium/Weak Signal for Buy/Sell - Consolidation - Overbought/Oversold - Volatility Ban
Italo Trend Indicator
Italo Santana Gomes
4.74 (34)
BUY INDICATOR AND GET EA FOR FREE AS A BONUS + SOME OTHER GIFTS! ITALO TREND INDICATOR  is the best trend indicator on the market, the Indicator works on all time-frames and assets, indicator built after 7 years of experience on forex and many other markets. You know many trend indicators around the internet are not complete, does not help, and it's difficult to trade, but the Italo Trend Indicator is different , the Italo Trend Indicator shows the signal to buy or sell, to confirm the signal t
Top Bottom Tracker - это индикатор, основанный на сложных алгоритмах, которые анализируют рыночную тенденцию и могут определять максимумы и минимумы тренда / Версия для MT5 . Цена будет постепенно увеличиваться, пока не достигнет 500$. Следующая цена --> $99 Особенности Отсутствие перерисовки Индикатор не меняет свои значения при поступлении новых данных Торговые Все пары Форекс Таймфрейм   Все таймфреймы Параметры ==== Конфигурация индикатора ==== Параметр конфигурации // 40 (Чем выше
Другие продукты этого автора
This indicator presents an alternative approach to identify Market Structure. The logic used is derived from learning material created by   DaveTeaches (on X) Upgrade v1.10: add option to put protected high/low value to buffer (figure 11, 12) When quantifying Market Structure, it is common to use fractal highs and lows to identify "significant" swing pivots. When price closes through these pivots, we may identify a Market Structure Shift (MSS) for reversals or a Break of Structure (BOS) for co
This script automatically calculates and updates ICT's daily IPDA look back time intervals and their respective discount / equilibrium / premium, so you don't have to :) IPDA stands for Interbank Price Delivery Algorithm. Said algorithm appears to be referencing the past 20, 40, and 60 days intervals as points of reference to define ranges and related PD arrays. Intraday traders can find most value in the 20 Day Look Back box, by observing imbalances and points of interest. Longer term traders c
This is a Forex Scalping Trading Sytem based on the Bollinger Bands.  Pairs:Major Time frame: 1M or higher. Spread max:0,0001.  Indicators (just suggestion) Bollinger bands (20, 2); ADX (14 period); RSI   (7 period ). Y ou should only trade this system between 2am to 5am EST, 8am to 12am EST and 7.30pm to 10pm EST. Do not scalp 30 minutes before a orange or red news  report and not for a hour afterwards.   Setup: is for price to move above the lower or lower Bollinger Bands, RSI raise above the
FREE
This is addition of  Effective SV squeeze momentum  that add bolliger band and Keltner channel to chart window.  Squeeze momentum introduced by “John Carter”, the squeeze indicator for MT5 represents a volatility-based tool. Regardless, we can also consider the squeeze indicator as a momentum indicator, as many traders use it to identify the direction and strength of price moves. In fact, the Tradingview  squeeze indicator shows when a financial instrument is willing to change from a trending ma
FREE
All about Smart Money Concepts Strategy: Market struture: internal or swing BOS, CHoCH; Orderblock; Liquity equal; Fair Value Gap with Consequent encroachment, Balanced price range; Level with Previous month, week, day level or in day level (PMH, PWH, PDH, HOD); BuySell Stops Liquidity (BSL, SSL); Liquidity Void Long Wicks; Premium and Discount; Candle pattern ... "Smart Money Concepts" ( SMC ) is a fairly new yet widely used term amongst price action traders looking to more accurately navigate
The indicator   returning pivot point based trendlines with highlighted breakouts . Trendline caculated by pivot point and other clue are ATR, Stdev.   The indicator also includes integrated alerts for  trendlines  breakouts   and foward message to Telegram channel or group if you want. Settings ·            Lookback bar: Default 200 is number of bar caculate when init indicator. ·            Length:  Pivot points  period ·            Slope Calculation Method: Determines how this lope is calcula
This all-in-one indicator displays real-time market structure (internal & swing BOS / CHoCH), order blocks, premium & discount zones, equal highs & lows, and much more...allowing traders to automatically mark up their charts with widely used price action methodologies. Following the release of our Fair Value Gap script, we received numerous requests from our community to release more features in the same category. //------------------------------------// Version 1.x has missing functions + PDAr
The Breaker Blocks with Signals indicator aims to highlight a complete methodology based on breaker blocks. Breakout signals between the price and breaker blocks are highlighted and premium/discount swing levels are included to provide potential take profit/stop loss levels. This script also includes alerts for each signal highlighted.   SETTINGS   Breaker Blocks Length: Sensitivity of the detected swings used to construct breaker blocks. Higher values will return longer term break
The ICT Concepts indicator regroups core concepts highlighted by trader and educator "The Inner Circle Trader" (ICT) into an all-in-one toolkit. Features include Market Structure (MSS & BOS), Order Blocks, Imbalances, Buyside/Sellside Liquidity, Displacements, ICT Killzones, and New Week/Day Opening Gaps. It’s one kind of Smart money concepts.   USAGE:   Please read this   document  !      DETAILS Market Structure Market structure labels are constructed from price breaking a prior extreme
The FollowLine indicator is a trend following indicator. The blue/red lines are activated when the price closes above the upper Bollinger band or below the lower one. Once the trigger of the trend direction is made, the FollowLine will be placed at High or Low (depending of the trend). An ATR filter can be selected to place the line at a more distance level than the normal mode settled at candles Highs/Lows. Some features: + Trend detech + Reversal signal + Alert teminar / mobile app
The ICT Silver Bullet indicator is inspired from the lectures of "The Inner Circle Trader" (ICT) and highlights the Silver Bullet (SB) window which is a specific 1-hour interval where a Fair Value Gap (FVG) pattern can be formed. A detail document about ICT Silver Bullet here . There are 3 different Silver Bullet windows (New York local time): The London Open Silver Bullet (3 AM — 4 AM ~ 03:00 — 04:00) The AM Session Silver Bullet (10 AM — 11 AM ~ 10:00 — 11:00) The PM Session Silver Bullet (2
This indicator shows when user set sessions are active and returns various tools + metrics using the closing price within active sessions as an input. Users have the option to change up to 4 session times. The indicator will increasingly lack accuracy when the chart timeframe is higher than 1 hour. Settings Sessions Enable Session: Allows to enable or disable all associated elements with a specific user set session. Session Time: Opening and closing times of the user set session in the  
The liquidity swings indicator highlights swing areas with existent trading activity. The number of times price revisited a swing area is highlighted by a zone delimiting the swing areas. Additionally, the accumulated volume within swing areas is highlighted by labels on the chart. An option to filter out swing areas with volume/counts not reaching a user-set threshold is also included. This indicator by its very nature is not real-time and is meant for descriptive analysis alongside other com
The SuperTrend AI indicator is a novel take on bridging the gap between the K-means clustering machine learning method & technical indicators. In this case, we apply K-Means clustering to the famous SuperTrend indicator.   USAGE Users can interpret the SuperTrend AI trailing stop similarly to the regular SuperTrend indicator. Using higher minimum/maximum factors will return longer-term signals. (image 1) The displayed performance metrics displayed on each signal allow for a deeper interpretat
OVERVIEW A Lorentzian Distance Classifier (LDC) is a Machine Learning classification algorithm capable of categorizing historical data from a multi-dimensional feature space. This indicator demonstrates how Lorentzian Classification can also be used to predict the direction of future price movements when used as the distance metric for a novel implementation of an Approximate Nearest Neighbors (ANN) algorithm. This indicator provide signal as buffer, so very easy for create EA from this indi
An Implied Fair Value Gap (IFVG) is a three candles imbalance formation conceptualized by ICT that is based on detecting a larger candle body & then measuring the average between the two adjacent candle shadows. This indicator automatically detects this imbalance formation on your charts and can be extended by a user set number of bars. The IFVG average can also be extended until a new respective IFVG is detected, serving as a support/resistance line. Alerts for the detection of bullish/be
Consolidation is when price is moving inside a clear trading range. When prices are consolidated it shows the market maker placing orders on both sides of the market. This is mainly due to manipulate the un informed money. This indicator automatically identifies consolidation zones and plots them on the chart. The method of determining consolidation zones is based on pivot points and ATR, ensuring precise identification. The indicator also sends alert notifications to users when a new consolida
Wyckoff sweep and order block detector I got tired of marking the same structure by hand every morning, so I wrote this. It looks for one thing only: the Wyckoff sequence that ends with a liquidity sweep and a pullback into the order block that started the move. When all the pieces line up, it draws them and tells you. That's the whole job. It doesn't predict, it doesn't score setups out of ten, and it won't tell you how much to risk. It marks structure that's already there and saves you the ey
Created by imjesstwoone and mickey1984, this trade model attempts to capture the expansion from the 10:00-14:00 EST 4h candle using just 3 simple steps. All of the information presented in this description has been outlined by its creators, all I did was translate it to MQL4. All core settings of the trade model may be edited so that users can test several variations, however this description will cover its default, intended behavior using NQ 5m as an example. Step 1 is to identify our Price Ra
The Buyside & Sellside Liquidity indicator aims to detect & highlight the first and arguably most important concept within the ICT trading methodology,   Liquidity   levels. SETTINGS Liquidity Levels Detection Length: Lookback period Margin: Sets margin/sensitivity for a liquidity level detection Liquidity Zones Buyside Liquidity Zones: Enables display of the buyside liquidity zones. Margin: Sets margin/sensitivity for the liquidity zone boundaries. Color: Color option for buysid
The   Liquidation Estimates (Real-Time)   experimental indicator attempts to highlight real-time long and short liquidations on all timeframes. Here with liquidations, we refer to the process of forcibly closing a trader's position in the market. By analyzing liquidation data, traders can gauge market sentiment, identify potential support and resistance levels, identify potential trend reversals, and make informed decisions about entry and exit points. USAGE (Img 1)    Liquidation refers
The   ICT Unicorn Model   indicator highlights the presence of "unicorn" patterns on the user's chart which is derived from the lectures of   "The Inner Circle Trader" (ICT) . Detected patterns are followed by targets with a distance controlled by the user.   USAGE (image 2) At its core, the ICT Unicorn Model relies on two popular concepts, Fair Value Gaps and Breaker Blocks. This combination highlights a future area of support/resistance. A   Bullish Unicorn Pattern   consists out of:
The Inversion Fair Value Gaps (IFVG) indicator is based on the inversion FVG concept by ICT and provides support and resistance zones based on mitigated Fair Value Gaps (FVGs). Image 1   USAGE Once mitigation of an FVG occurs, we detect the zone as an "Inverted FVG". This would now be looked upon for potential support or resistance. Mitigation occurs when the price closes above or below the FVG area in the opposite direction of its bias. (Image 2) Inverted Bullish FVGs Turn into Potenti
Overview The   Volume SuperTrend AI   is an advanced technical indicator used to predict trends in price movements by utilizing a combination of traditional SuperTrend calculation and AI techniques, particularly the k-nearest neighbors (KNN) algorithm. The Volume SuperTrend AI is designed to provide traders with insights into potential market trends, using both volume-weighted moving averages (VWMA) and the k-nearest neighbors (KNN) algorithm. By combining these approaches, the indicator
OVERVIEW K-means is a clustering algorithm commonly used in machine learning to group data points into distinct clusters based on their similarities. While K-means is not typically used directly for identifying support and resistance levels in financial markets, it can serve as a tool in a broader analysis approach. Support and resistance levels are price levels in financial markets where the price tends to react or reverse. Support is a level where the price tends to stop falling and m
Introducing the Reversal and Breakout Signals   This innovative tool is crafted to enhance your chart analysis by identifying potential reversal and breakout opportunities directly on your charts. It's designed with both novice and experienced traders in mind, providing intuitive visual cues for better decision-making. Let's dive into the key features and how it operates: ###   Key Features:   Dynamic Period Settings:   Customize the sensitivity of the indicator with user-def
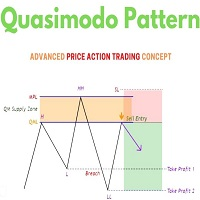
Introduction One of the patterns in "RTM" is the "QM" pattern, also known as "Quasimodo". Its name is derived from the appearance of "Hunchback of Notre-Dame" from Victor Hugo's novel. It is a type of "Head and Shoulders" pattern.   Formation Method   Upward Trend In an upward trend, the left shoulder is formed, and the price creates a new peak higher than the left shoulder peak . After a decline, it manages to break the previous low and move upward again. We expect the price to
MOST is applied on this RSI moving average with an extra default option added VAR/VIDYA (Variable Index Dynamic Moving Average) MOST added on RSI has a Moving Average of RSI and a trailing percent stop level of the Moving Average that can be adjusted by changing the length of the MA and %percent of the stop level. BUY SIGNAL when the Moving Average Line crosses above the MOST Line LONG CONDITION when the Moving Average is above the MOST SELL SIGNAL when Moving Average Line crosses below MOS
The indicator show Higher timeframe candles for ICT technical analisys Higher time frames reduce the 'noise' inherent in lower time frames, providing a clearer, more accurate picture of the market's movements. By examining higher time frames, you can better identify trends, reversals, and key areas of support and resistance. The Higher Time Frame Candles indicator overlays higher time frame data directly onto your current chart. You can easily specify the higher time frame candles you'd li
Introduction The Price Action, styled as the "Smart Money Concept" or "SMC," was introduced by Mr. David J. Crouch in 2000 and is one of the most modern technical styles in the financial world. In financial markets, Smart Money refers to capital controlled by major market players (central banks, funds, etc.), and these traders can accurately predict market trends and achieve the highest profits. In the "Smart Money" style, various types of "order blocks" can be traded. This indicator uses
Фильтр:
Нет отзывов
Ответ на отзыв