Candle Lengths Analyzer
- Утилиты
- Версия: 4.10
- Обновлено: 31 октября 2026
- Активации: 5

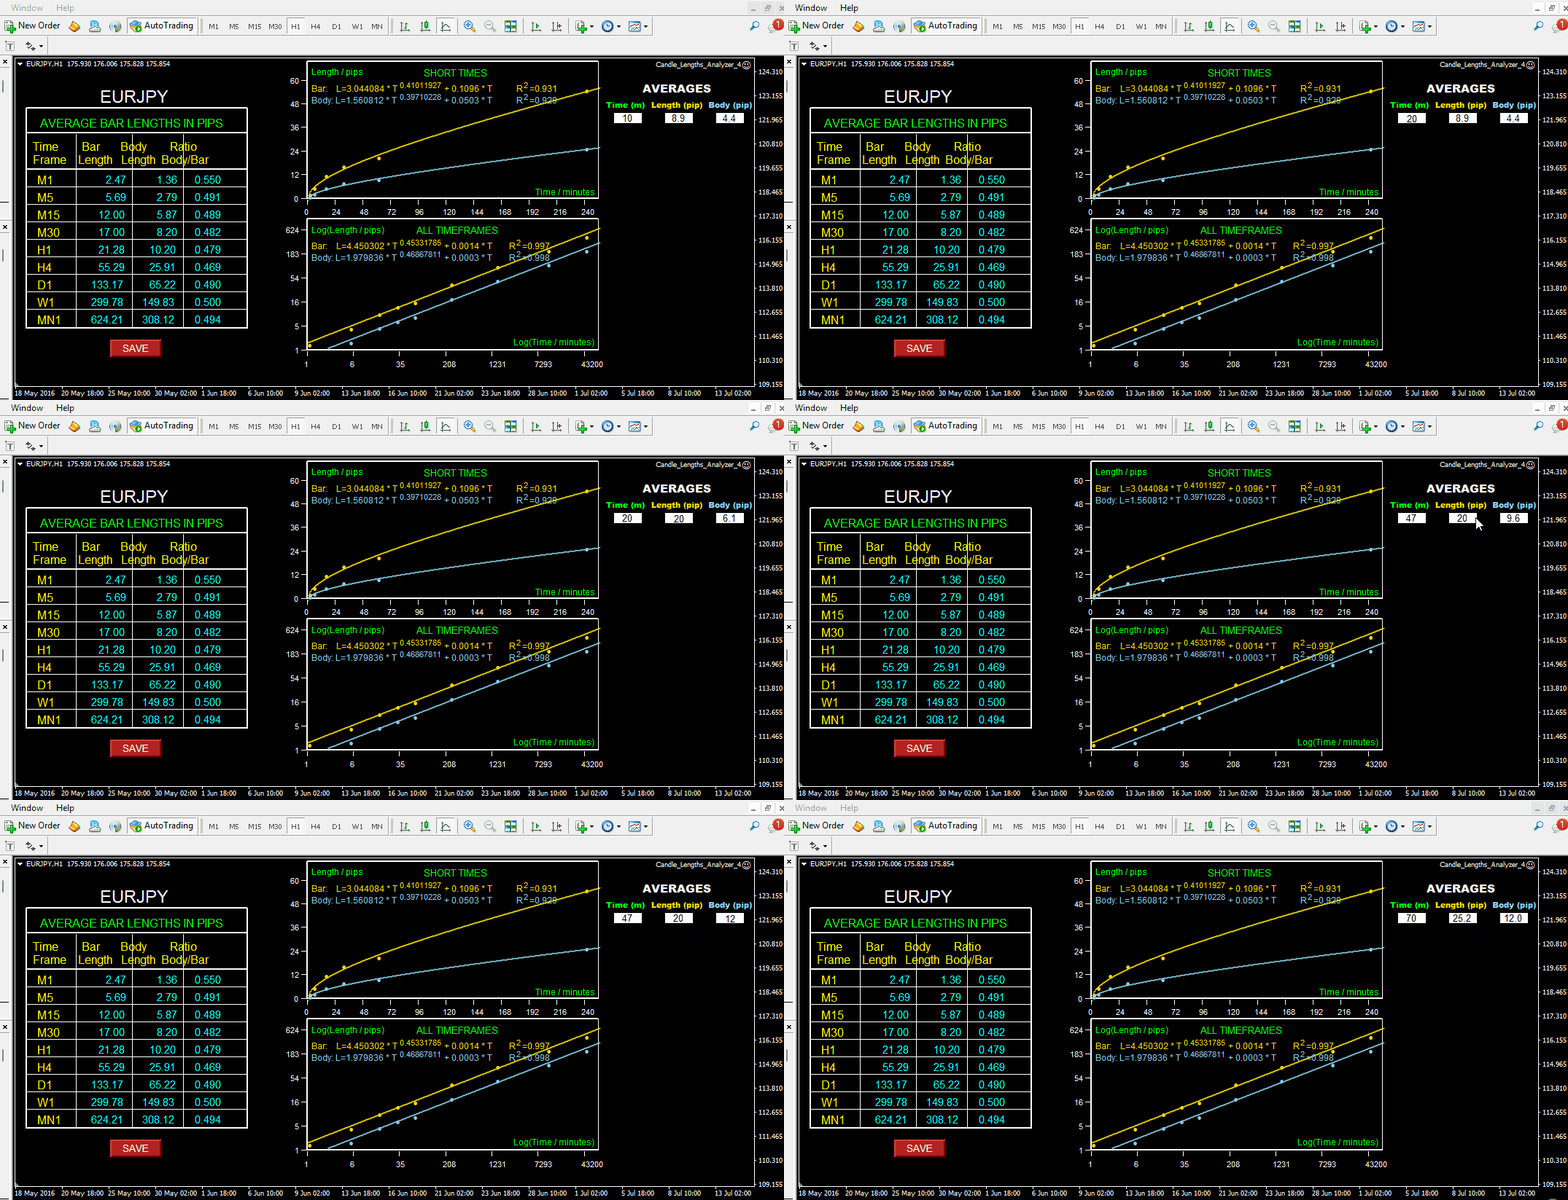
Candle Lengths Analyzer is an institutional-grade quantitative utility that models and measures how financial price volatility, candle range, and body displacement scale across all timeframes.
Financial markets do not expand linearly. By mathematically separating extreme high-to-low ranges (Bar Length) from net open-to-close directional progress (Body Length), this tool reveals the underlying diffusive power-law behavior of any financial asset, replacing subjective chart inspection with empirical equations.
### TWO COMPLEMENTARY MEASUREMENTS
1. Bar Length (High - Low): Quantifies total price excursion, wick rejections, and raw ambient market volatility.
2. Body Length (|Open - Close|): Isolates true directional progress and net trend displacement.
3. Body / Bar Ratio: Measures trend efficiency and conviction. High-liquidity instruments typically baseline near ~0.50; higher readings identify decisive directional legs, while lower values expose chop and wick absorption.
### KEY FEATURES & CAPABILITIES
* Non-Linear Simplex Curve Fitting: Avoids simplistic linear assumptions by solving continuous parameters through the Nelder-Mead Simplex optimization algorithm.
* Short Times Linear Plot: Evaluates intraday horizons up to 4 hours (240 minutes), plotting empirical data points alongside fitted curves.
* All Timeframes Log-Log Plot: Compresses time horizons from M1 up to Monthly (MN1) into a power-law linear representation, displaying correlation coefficients (R²).
* Interactive Three-Way Averages Engine: A built-in bidirectional solver on your chart. Modify any parameter (Time, Length, or Body) and press Enter to recalculate the remaining metrics instantly:
- Test Stop Loss Placement: Input your planned Stop Loss in pips to determine the average elapsed time required for market noise to cover that distance.
- Calibrate Take Profit Targets: Input your target in pips to evaluate the realistic statistical duration needed to achieve net directional displacement.
- Forecast Holding Windows: Input holding minutes (e.g., 240 for 4 hours) to project expected range excursions.
* 1-Click Export & Archival: Export full mathematical metrics to CSV and capture high-resolution chart screenshots with a single click.
* Non-Invasive Chart Engine: Native CCanvas rendering with isolated object management that preserves your personal indicators, chart templates, and active objects.
### INPUT PARAMETERS
* InpX1: Horizontal X-coordinate for the left plot boundary (Default: 400).
* InpX2: Horizontal X-coordinate for the right plot boundary (Default: 800).
### USAGE RECOMMENDATIONS
* Multi-Asset Scope: Operates across Forex majors, crosses, Spot Metals (Gold, Silver), Indices, and Commodities.
* History Requirements: Ensure historical bar data is downloaded across standard timeframes for precise simplex convergence.
* Pure Native MQL: High-performance mathematical execution with zero DLL imports or external software wrappers required.