Balance Graph Dashboard

Brief Description
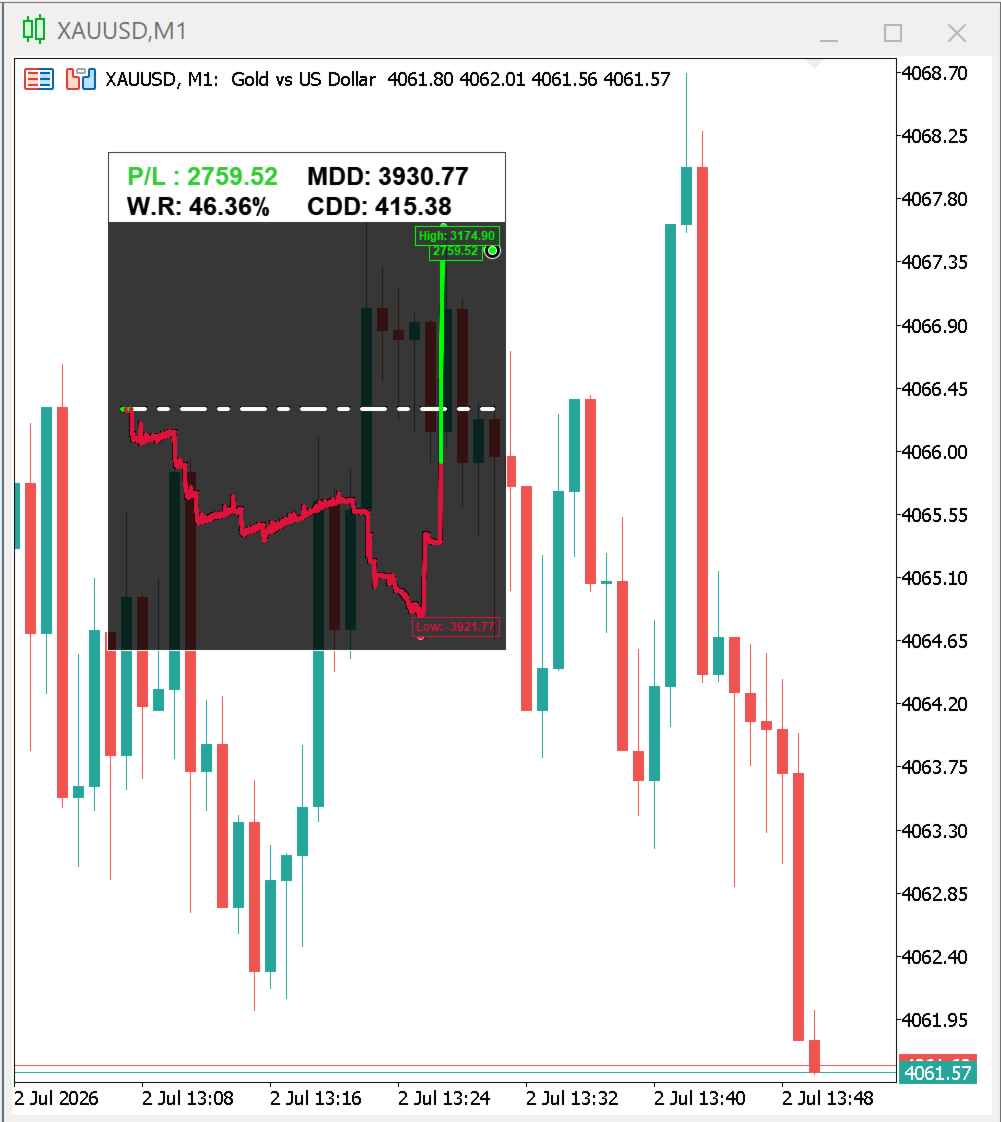
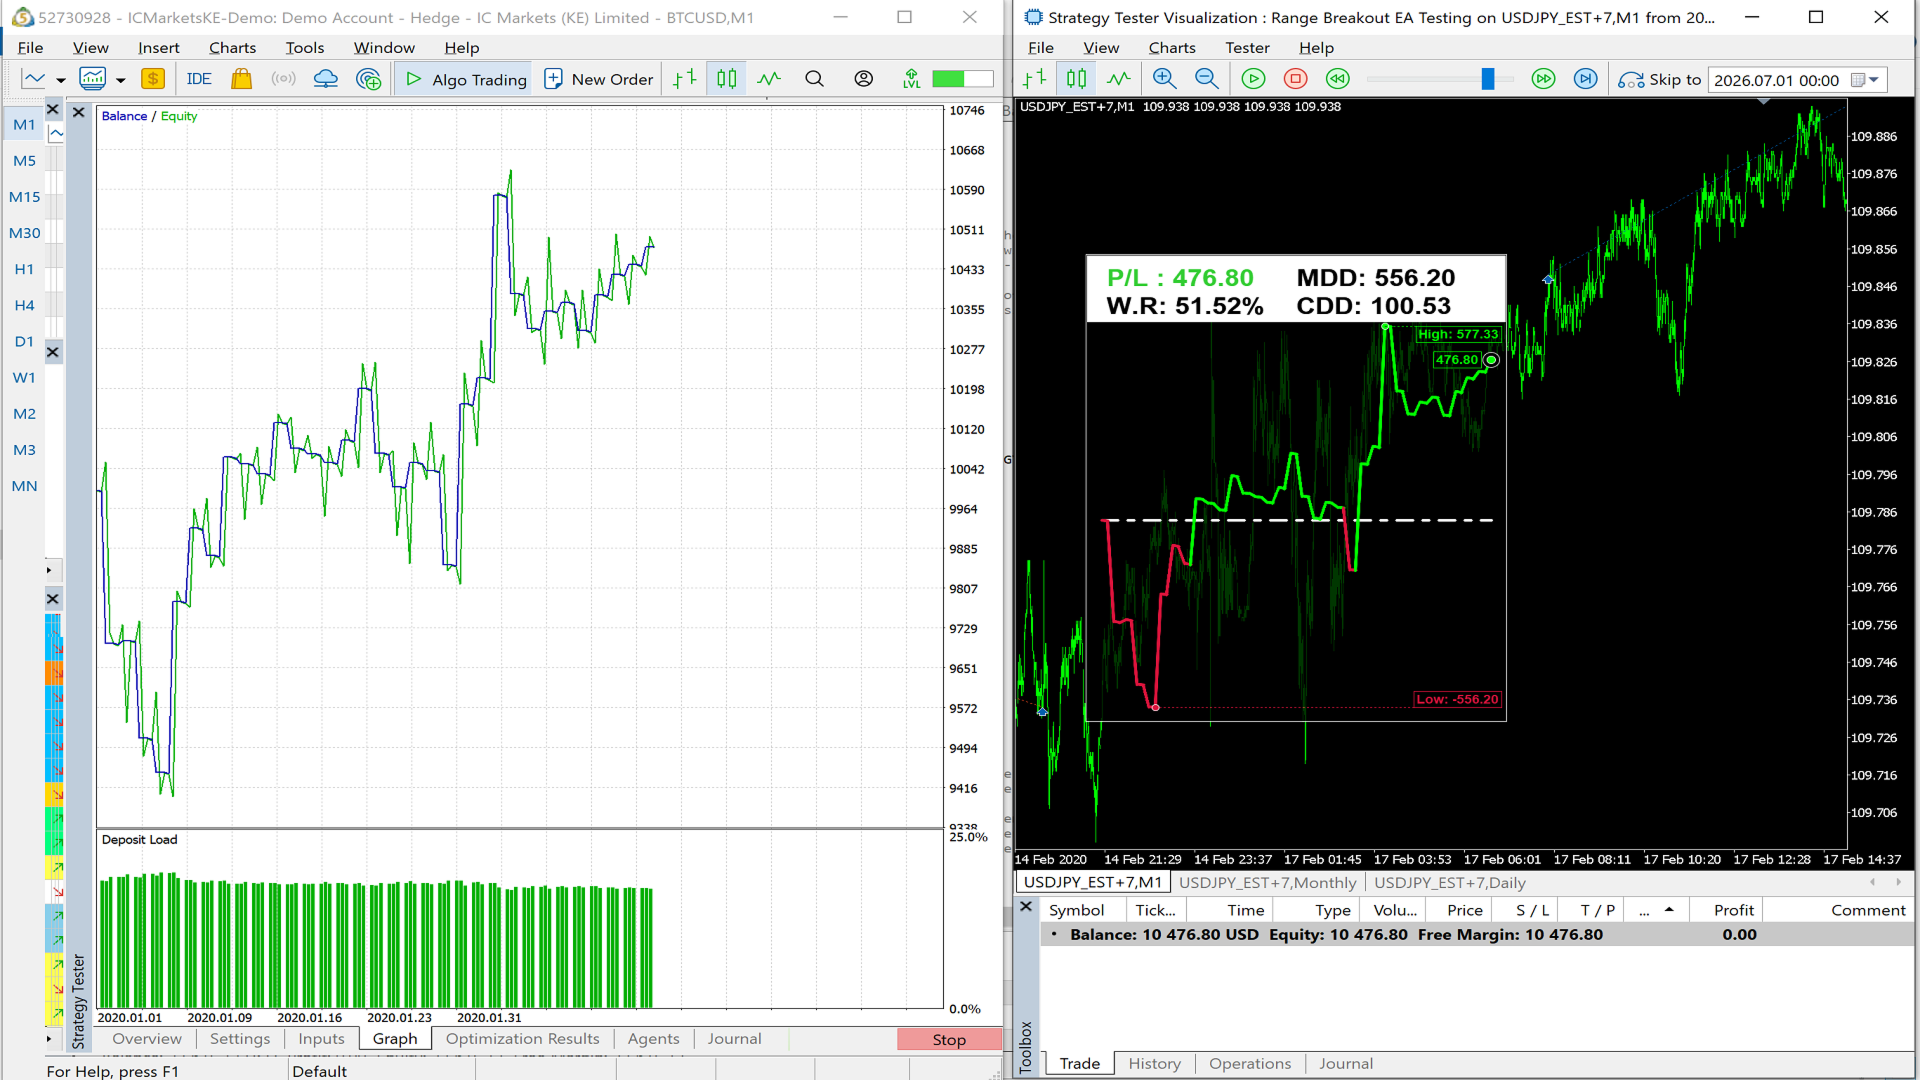
The Balance Curve Dashboard is a sophisticated visual tool that transforms your trading history into an interactive, high-performance equity curve display directly on your MT5 chart. Unlike traditional balance lines that draw on the chart as standard objects, this indicator uses a custom Canvas-based rendering engine to create a crisp, anti-aliased, and fully customizable visual representation of your portfolio's performance.

Key Features:📊 Interactive Visual Dashboard

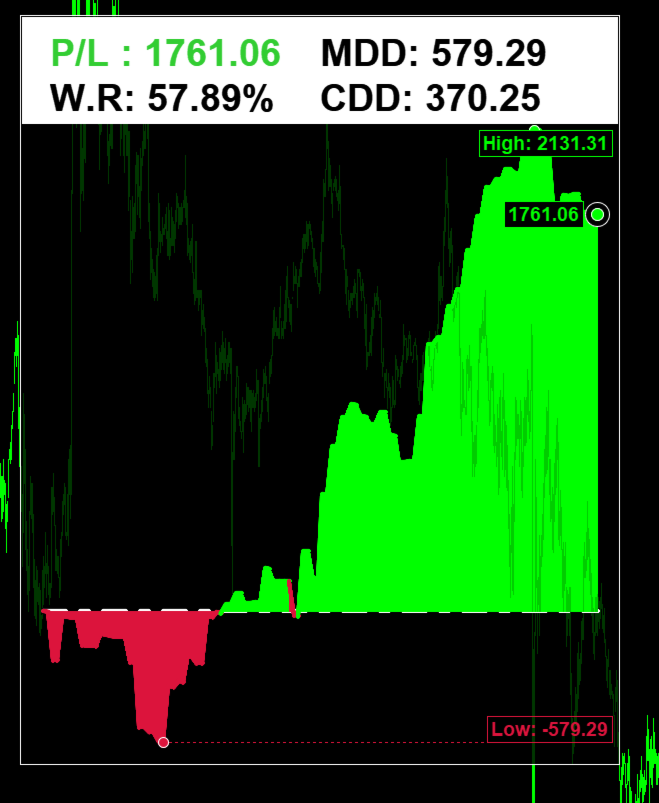
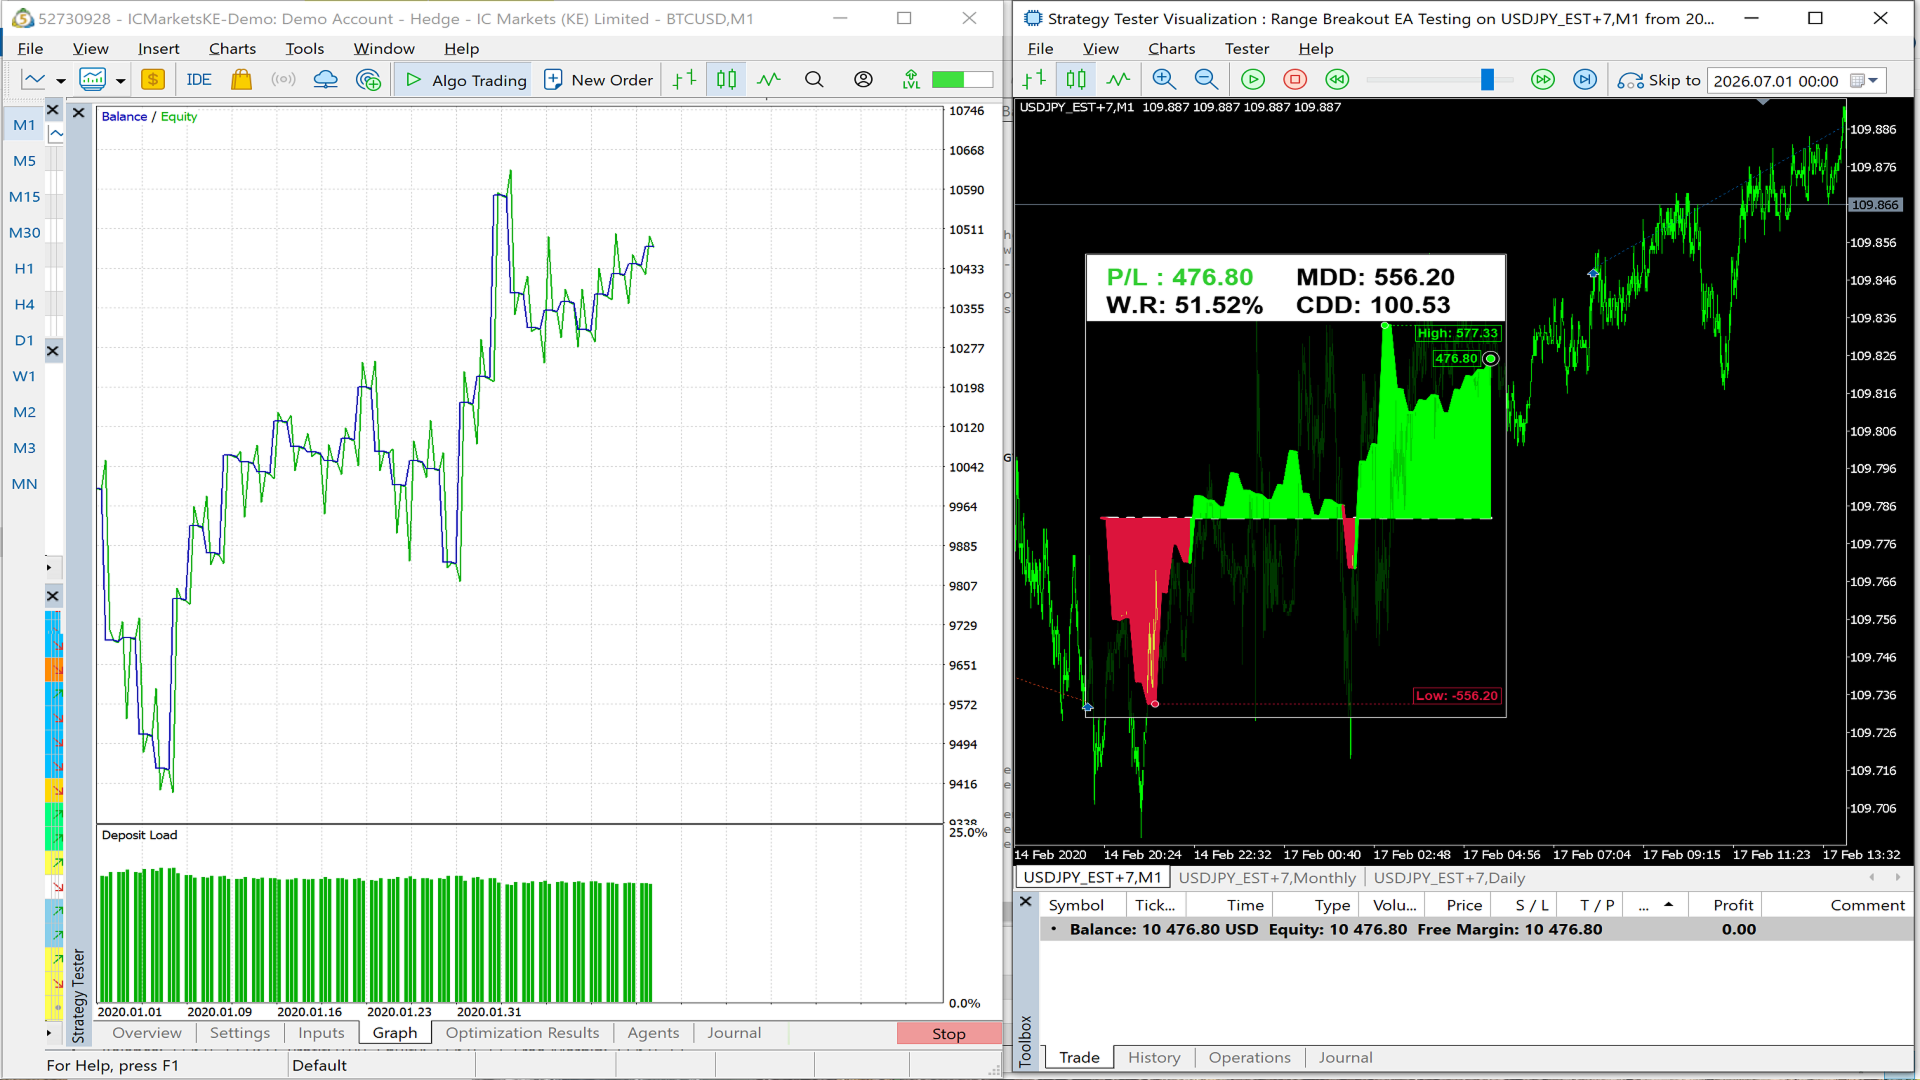
· Full-color equity curve with profit/loss· Real-time P/L, Win Rate, Max Drawdown, and Current Drawdown metrics· High/Low markers with labeled value boxes
· Current balance marker with floating value display· Gradient fill option for enhanced visual appeal


🎯 Flexible Filtering
· Portfolio View: Track all trades across all symbols
· Symbol Only: Focus on a specific trading symbol
· Strategy Only: Filter by Magic Number

· Symbol + Strategy: Combine both filters for granular analysis


🎨 Fully Customizable

· Adjustable canvas size via Canvas Factor (1x to 2x)
· Customizable colors for profit/loss lines, background, text, borders
· Opacity control for semi-transparent overlays

· Font size controls for labels and metrics


🖱️Interactive

· Drag-and-drop positioning anywhere on the chart

· Chart remains fully functional (mouse scroll enabled while not dragging)


Who Is This For?
· Manual Traders: Visualize your account performance evolution over any period (daily, weekly, monthly, or entire history)
· EA Developers: Use this as a visual front-end for strategy analysis and performance monitoring
· Quant Traders: Quickly assess strategy rates at a glance


INPUTS:

Here is every input explained in full detail:

CanvasFactor — controls the physical pixel size of the entire canvas window. It's a multiplier applied to the base dimensions of 400×500 pixels. At 1 (default) the canvas is exactly 400px wide by 500px tall. At 2 it doubles to 800×1000px — every element inside scales with it: padding, font sizes, marker radii, line

thickness. Values between 1 and 2 (like 1.5) produce intermediate sizes. Going below 1 makes the canvas smaller than the base size, and going above 2makes it very large. Everything throughout, so nothing gets cut off or misaligned when you change this — it all resizes proportionally.


CurveType — this is the most important input. It controls which deals from your account history are included in the balance curve, P/L, win rate, drawdown, and all other metrics. Four options:

PORTFOLIO — includes every single deal from every symbol and every EA/strategy in your account history, regardless of what symbol the chart is on or what magic number any EA used.

If you have trades on EURUSD, GBPUSD, gold, and indices all mixed together, they all count. This shows your overall account performance as a whole.

SYMBOL_ONLY — filters to only deals where DEAL_SYMBOL matches the symbol the indicator is currently attached to (_Symbol). So if you attach the indicator to a EURUSD chart, only everything else is ignored entirely. The magic number of the EA that placed the trade is irrelevant here; any EA's EURUSD trades count. Useful for evaluating how a particular instrument has performed across all strategies trading it.

STRATEGY_ONLY — filters to only deals where DEAL_MAGIC matches strtMagic_No, regardless

of which symbol those trades were on. So if your EA uses magic number 101 and trades both EURUSD and GBPUSD, both show up. Trades from other EAs with different magic numbers are excluded even if they're on the same symbol. Useful for seeing the isolated performance of one specific EA across all the pairs it trades.

SYMBOL_SPECIFIC_STRATEGY — the most restrictive filter: a deal only counts if BOTH DEAL_SYMBOL == _Symbol AND DEAL_MAGIC == strtMagic_No. So it shows only trades placed by a specific EA (identified by magic number) on Everything else — same EA on a different symbol, different EA on the same symbol — is

excluded. Useful when one EA trades multiple pairs and you want to isolate its performance on just one of them.


strtMagic_No — the magic number used as the filter value for STRATEGY_ONLY and SYMBOL_SPECIFIC_STRATEGY curve types. Has no effect at all when CurveType is PORTFOLIO or SYMBOL_ONLY. Set this to match the magic number your EA assigns to its orders via trade.SetExpertMagicNumber() or OrderSend(). Default is 101. If your EA uses a different magic number and you leave this at 101, those two filtered curve types will show an empty curve since no deals will match.


BalanceCurvePeriod — works together with BalanceCurveFactor to define the history window start time. It's a timeframe selector (M1,H1, D1, W1, MN1, etc.) that defines the "unit of for stepping backward through history. At the default PERIOD_MN1 (monthly), one unit of BalanceCurveFactor represents one calendar
month. Changing this to PERIOD_W1 makes one unit equal one week, PERIOD_D1 makes it one
day, and so on. Has no effect when BalanceCurveFactor is negative (entire history

mode).


BalanceCurveFactor — controls how far back in time the history window starts. The exact formula in the code is: start = iTime(_Symbol, BalanceCurvePeriod, 0) - PeriodSeconds(BalanceCurvePeriod) * BalanceCurveFactor. Breaking that down: iTime(_Symbol, BalanceCurvePeriod, 0) is the open time of the current period's bar (e.g. the start of this month if BalanceCurvePeriod = PERIOD_MN1). PeriodSeconds(BalanceCurvePeriod) * BalanceCurveFactor subtracts that many period- Any negative value (default -1) — bypasses this formula entirely and calls HistorySelect(0, TimeCurrent()) instead, which means the entire available account history from the very beginning. This is the "show everything" mode. 0 — start is the open of the current period with no subtraction, so only deals from the current period onward are shown (e.g. this month only if on MN1). 1 — goes back one period before the current one (e.g. last month + this month). 3 on PERIOD_MN1 — shows the last 3 months. On PERIOD_W1 — last 3 weeks. On PERIOD_D1 — last 3 days. So BalanceCurvePeriod is the unit and BalanceCurveFactor is how many of those units to go back.

CanvasOpacity — controls the transparency of the canvas background and certain overlay elements. It's the alpha value passed to label box backgrounds on the High/Low markers, and the current-balance label box. Range is 0 (fully transparent, canvas invisible) to 255 (fully opaque, solid). Default is 200, which is slightly transparent — at this level you can faintly see the chart price bars behind the canvas if they're close to the canvas edge. Going lower makes the background more see-through; going to 255 makes it a solid opaque block.


LineFontSize — despite the name, this is actually the line thickness in pixels for the balance curve

line itself, passed directly as the width parameter to ExtCanvas.LineThick(). Nothing to do with fonts. Default is 5px. Higher values make the curve line thicker and more prominent; lower values make it thinner. At 1 it's a single- pixel line. Also applies to the start-balance dashed horizontal line.


TextFontSize — controls the font size of the four metric labels in the header band (P/L, Win Rate, so it stays proportional when you resize the canvas. Default is 30, which at CanvasFactor=1 renders as 30pt. The marker labels (current balance tag, High/Low tags) use their own hardcoded sizes scaled independently and are not affected by this input.


InpEnableGradient — toggles the shaded area fill between the balance curve and the zero baseline on or off. When true (default), a semi- transparent colored fill is drawn beneath the curve above the baseline (green-tinted when profitable, red-tinted when in loss) by calling DrawVerticalGradientFill() column by column. When false, only the line itself is drawn with no fill underneath — cleaner look, and slightly faster

to render since the entire gradient fill loop is skipped entirely.


InpLineProfitColor — the color of the balance curve line and its gradient fill for any segment where the cumulative P/L is zero or above (i.e. dot, line, and label box border when the curve is in profit. Default is clrLime (bright green).


InpLineLossColor — the color of the balance curve line and gradient fill for any segment where the cumulative P/L is negative (below the zero start line). Also colors the current-balance marker, and the Low marker dot, line, and label box border when in drawdown. Default is clrCrimson (dark red). The curve can switch between these two colors mid-chart wherever the running P/L crosses zero in either direction.


InpBgColor — the fill color of the canvas background, applied via ExtCanvas.Erase() at the start of every redraw. Also used as the fill color inside the High/Low marker label boxes and the current-balance label box — this is what creates the "background behind the text" effect that makes the labels readable over the curve. Default is clrBlack.


InpTxtColor — the color used for the Win Rate drawdown (Max DD, Current DD) text labels in the header. The P/L text uses its own color logic (green or red based on whether P/L is positive or negative) so InpTxtColor doesn't apply to it.


InpBordLineColor — used in three places: the rectangular border drawn around the entire canvas perimeter, the filled header rectangle at the top of the canvas, and the anti-aliased outline rings on the current-balance marker circles (CircleAA() calls). Default is clrWhite. Changing this changes both the outer canvas frame and the marker ring outline simultaneously.
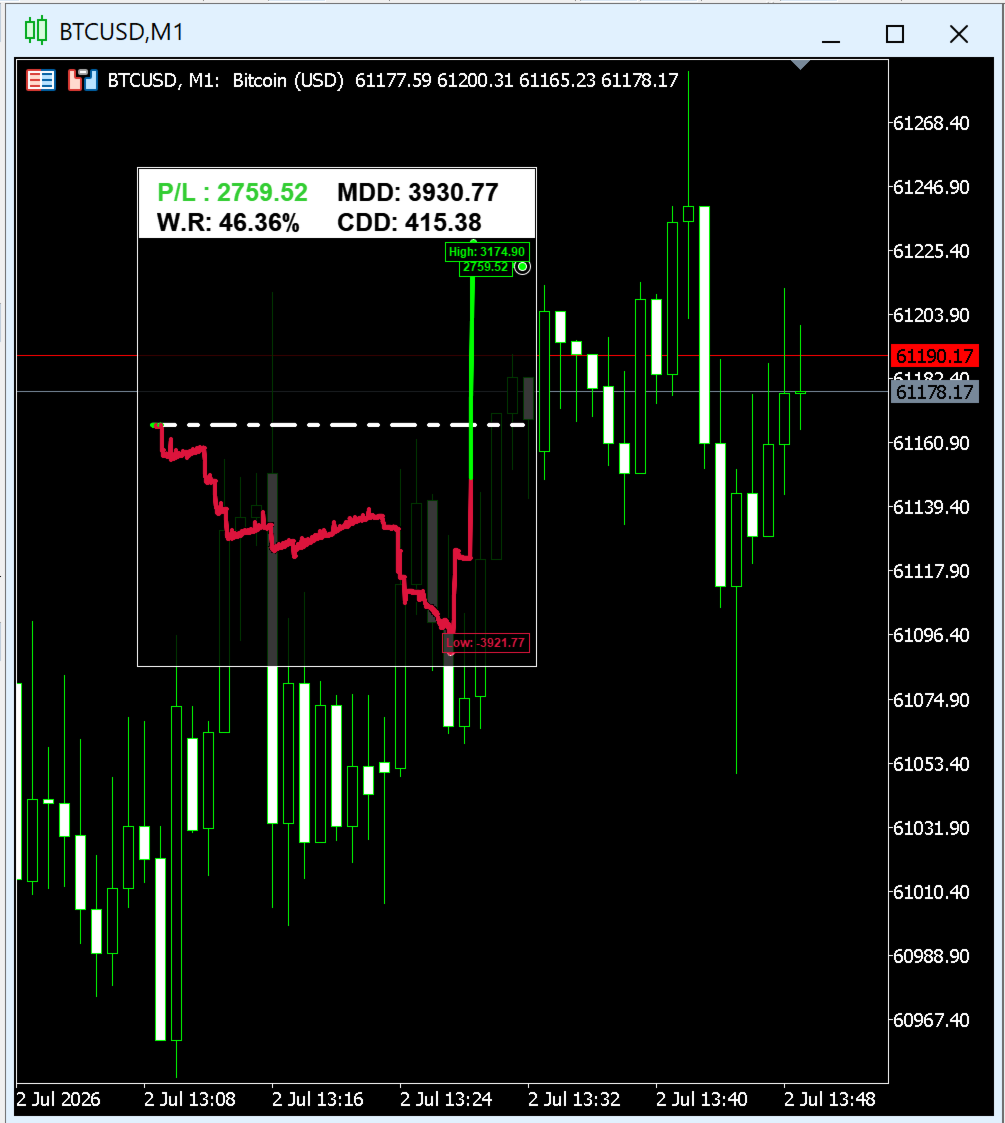
InpStrtLineColor — the color of the dashed horizontal line drawn across the canvas at the zero P/L level (the starting balance baseline). This line is what visually separates profit so it's a dash-dot pattern rather than solid. Default is clrWhite. This is completely independent of InpBordLineColor — you can make the border one color and the baseline another.
Рекомендуем также
Индикатор строит текущие котировки, которые можно сравнить с историческими и на этом основании сделать прогноз ценового движения. Индикатор имеет текстовое поле для быстрой навигации к нужной дате. Параметры : Symbol - выбор символа, который будет отображать индикатор; SymbolPeriod - выбор периода, с которого индикатор будет брать данные; IndicatorColor - цвет индикатора; Inverse - true переворачивает котировки, false - исходный вид; Далее идут настройки текстового поля, в которое можно ввес
Atlantis Pro Indicator — Точная тик-аналитика с портфельным подходом Atlantis Pro Indicator — это продвинутый многофункциональный инструмент, который использует реальные тиковые данные для выявления ключевых ценовых уровней и зон вероятных разворотов с высокой точностью. Постоянно анализируя каждый рыночный тик, Atlantis Pro фиксирует критические изменения покупательского и продавцового давления и моментально отображает чёткие стрелки Buy и Sell прямо на графике — видимые по умолчанию для быстр
BoxChart MT5
Evgeny Shevtsov
5 (7)
Рынок несправедлив, хотя бы потому, что всего лишь 10% игроков управляют 90% капитала. У рядового трейдера мало шансов, чтобы противостоять этим «хищникам». Но выход есть, необходимо всего лишь перейти на другую сторону, необходимо находиться в числе этих 10% «акул», научиться распознавать их намерения и двигаться вместе с ними. Объем - это единственный опережающий фактор, который безупречно работает на любом периоде и любом торговом инструменте. Сначала зарождается и накапливается объем, и толь
Индикатор Supply Demand использует предыдущее ценовое действие для выявления потенциального дисбаланса между покупателями и продавцами. Ключевым является определение зон с лучшими возможностями, а не просто вероятностей. Индикатор Blahtech Supply Demand обеспечивает функционал, не доступный ни в одной платформе. Этот индикатор 4 в 1 не только выделяет зоны с более высокой вероятностью на основе механизма оценки силы по множественным критериям, но также комбинирует его с мульти-таймфреймовым анал
Russian Этот индикатор служит передовым помощником по анализу графиков для трейдеров, предпочитающих торговлю по графическим паттернам. Он разработан для снижения нагрузки при визуальном анализе и повышения точности извлечения прибыли. Основные преимущества данного индикатора с практической точки зрения: 1. Автоматическое распознавание паттернов (Automated Pattern Detection) Экономия времени и снижение предвзятости: Вам больше не нужно вручную чертить трендовые линии. Индикатор находит ценовые р
VOLUME PROFILE SAF-XII Профессиональный анализ профиля рынка для MT5 (идеальный индикатор для сеточных трейдеров) ЧТО ТАКОЕ ПРОФИЛЬ ОБЪЕМА (VOLUME PROFILE)? Профиль объема — это профессиональный институциональный инструмент, который отображает торговую активность на определенных ценовых уровнях, в отличие от традиционных индикаторов объема, показывающих объем во времени. Он показывает, ГДЕ происходила торговля в выбранном вами окне, помогая определить: ЗОНЫ СПРАВЕДЛИВОЙ СТОИМОСТИ (VAH/VAL) — це
VibeFox Volume Profile — Volume Profile для MetaTrader 5 VibeFox Volume Profile — это полный набор инструментов Volume Profile для MetaTrader 5. Он строит горизонтальное распределение торгуемого объёма по цене, поэтому вы сразу видите, где рынок проявил наибольшую активность, где торговал слабо и какие ценовые уровни, вероятно, будут действовать как магниты или барьеры. Каждый профиль рисуется прямо на графике и управляется из современной панели с управлением мышью — никаких меню, в которых нужн
few free copies left VOLURIS — движок Volume Profile Вы уже знаете, как торговать. Вы просто не видите то, что должны видеть. У вас уже было это ощущение. Вы входите в сделку. Цена сразу идёт против вас. Вас выбивает по стопу. А потом — сразу после этого — цена разворачивается и идёт именно туда, куда вы ожидали. Вы были правы. Просто вошли слишком рано. Или слишком поздно. Или и то и другое. Вы смотрите на график после этого и теперь всё видите. Над вашей точкой входа находился Naked POC.
FREE
Here   our more valuable tools SMC Trend Trading   ,  Easy SMC Trading  ,  Institutional SMC Architect Volume Analysis Tools  ,  Volume flow Profile  ,  Market volume profile  , FVG with Volume  , Liquidity Heatmap Profile  ,  Volume Spread Analysis The    Liquidity Heatmap   is a sophisticated institutional trading tool designed to reveal where over-leveraged traders are trapped. By calculating estimated liquidation levels based on volume spikes and leverage, this indicator draws a dynamic "h
Gioteen Volatility Index (GVI) - your ultimate solution to overcoming market unpredictability and maximizing trading opportunities. This revolutionary indicator helps you in lowering your losing trades due to choppy market movements. The GVI is designed to measure market volatility, providing you with valuable insights to identify the most favorable trading prospects. Its intuitive interface consists of a dynamic red line representing the volatility index, accompanied by blue line that indicate
AW Candle Patterns
AW Trading Software Limited
Индикатор AW Candle Patterns является комбинацией из продвинутого трендового индикатора в сочетании с мощным сканером свечных паттернов. Это полезный инструмент для распознания и выделения тридцати наиболее надежных свечных паттернов. Помимо этого это анализатор текущего тренда по окрашенным барам с  подключаемой мультитаймфреймовой трендовой панелью, изменяемой по размеру и положению. Уникальная возможность регулировки отображения паттернов в зависимости от трендовой фильтрации.  Преимущества: 
An ICT fair value gap is a trading concept that identifies market imbalances based on a three-candle sequence. The middle candle has a large body while the adjacent candles have upper and lower wicks that do not overlap with the middle candle. This formation suggests that there is an imbalance where buying and selling powers are not equal. Settings Minimum size of FVG (pips) -> FVGs less than the indicated pips will be not be drawn Show touched FVGs Normal FVG color -> color of FVG that hasn't
FREE
Этот продукт позволит Вам выгодно приобреcти и использовать два самых популярных продукта для анализа объемов заявок и сделок на биржевых рынках: Actual Depth of Market Chart Actual Tick Footprint Volume Chart Данный продукт вобрал в себя всю мощь каждого отдельного индикатора и оформлен в виде одного файла. Функционал продукта Actual COMBO Depth of Market AND Tick Volume Chart полностью идентичен оригинальным индикаторам. Вы оцените удобство объединения этих двух продуктов в один супер-индикато
Профиль Рынка (Market Profile) определяет ряд типов дней, которые помогают трейдеру распознать поведение рынка. Ключевая особенность - это область значений (Value Area), представляющая диапазон ценового действия, в котором произошло 70% торговли. Понимание области значений может помочь трейдерам вникнуть в направление рынка и установить торговлю с более высокими шансами на успех. Это отличное дополнение к любой системе, которую вы возможно используете. Blahtech Limited представляет сообществу Me
Volume Profile Canvas - Professional Volume Profile Indicator for MetaTrader 5 DESCRIPTION Volume Profile Canvas is a professional volume profile indicator for MetaTrader 5 that renders directly on the chart using a high-performance Canvas engine. It calculates and displays the volume distribution across price levels, identifying the Point of Control (POC), Value Area High (VAH) and Value Area Low (VAL) in real time. This is a pure analysis tool. It does not trade. It gives you an instant vi
Introducing PivotWave – your ultimate trading companion that redefines precision and market analysis. Designed with traders in mind, PivotWave is more than just an indicator; it’s a powerful tool that captures the pulse of the market, identifying key turning points and trends with pinpoint accuracy. PivotWave leverages advanced algorithms to provide clear visual signals for optimal entry and exit points, making it easier for traders to navigate volatile market conditions. Whether you are a begin
Master Edition — это профессиональный аналитический инструмент, предназначенный для визуализации структуры рынка через призму объема и денежного потока. В отличие от стандартных индикаторов объема, этот инструмент отображает Daily Volume Profile (Дневной Профиль Объема) прямо на вашем графике, позволяя видеть, где именно происходило открытие цены и где позиционируются «умные деньги». Эта версия Master Edition разработана для ясности и скорости, оснащенная уникальной системой Auto-Theme Sync, кот
The Sessions and Bar Time indicator is a professional utility tool designed to enhance your trading awareness and timing precision on any chart. It combines two key features every trader needs — market session visualization and real-time bar countdown — in one clean, efficient display. Key Features: Candle Countdown Timer – Shows the remaining time before the current candle closes, helping you anticipate new bar formations. Market Session Display – Automatically highlights the four main trading
FREE
This Volume Delta Profile is an advanced MetaTrader 5 indicator that visualizes   volume delta (order flow imbalance)   using a volume profile-style histogram. It shows the difference between buying and selling pressure at specific price levels, helping traders identify supply and demand zones. This indicator provides a unique perspective on market dynamics by visualizing the imbalance between buying and selling pressure, offering insights beyond traditional volume analysis. Core Concept Positiv
LevelsHunter Pro – Профессиональный объёмный профиль с анализом истории Что это такое LevelsHunter Pro — это индикатор объёмного профиля, который показывает не только текущие уровни POC, VAH и VAL, но и позволяет   вернуться в прошлое   и увидеть, где находились эти уровни в момент любой прошлой сделки. Это инструмент не для гадания на графике, а для   холодного анализа   того, что уже произошло. Для чего это трейдеру Проблема:   Большинство индикаторов показывают только «здесь и сейчас». Вы зак
Here   our more valuable tools SMC Trend Trading   ,  Easy SMC Trading  ,  Institutional SMC Architect Volume Analysis Tools  ,  Volume flow Profile  ,  Market volume profile  , FVG with Volume  , Liquidity Heatmap Profile  ,  Volume Spread Analysis 2. Key Features Dynamic Filtering : The core feature. As soon as the current price crosses a historical liquidity level, that level disappears. This reduces chart clutter and prevents you from trading off "dead" support/resistance. Liquidity Heatma
THE PRICE WILL BE SUCH ONLY FOR THE FIRST 100 ORDERS, AFTER THAT, FOR EVERY 100 ORDERS, THE PRICE WILL INCREASE BY 20% COMPARED TO THE PREVIOUS ONE!!! What is NEXUS? NEXUS is a professional indicator for MetaTrader 5, designed to show the real volume flow and the balance between buyers and sellers in the market. The indicator analyzes price and volume movements to detect the moments when the market changes direction and large participants begin to accumulate or unload positions. Key Features
Дает честную картину изменения уровней безубытка по сделкам на всей истории счета, а не только по открытым позициям (скриншот 1). Точный расчет уровней с учетом начисленных комиссий, сборов и свопов позволяет оценить результаты торговли как визуально, так и в советниках (скриншот 2). Для советников индикатор в стандартном виде предоставляет не только уровень безубытка, но и количество позиций, объем и все дополнительные начисления (включая своп), влияющие на цену уровня безубытка. Тем самым разг
Premium level - это уникальный индикатор с точностью правильных прогнозов  более 80%!  Данный индикатор тестировался более двух месяцев лучшими Специалистами в области Трейдинга!  Индикатор авторский такого вы больше не где не найдете!  По скриншотах можете сами увидеть точностью данного инструмента!  1 отлично подходит для торговли бинарными опционами со временем экспирации на 1 свечу. 2 работает на всех валютных парах, акциях, сырье, криптовалютах Инструкция: Как только появляется красная стре
Here   our more valuable tools SMC Trend Trading   ,  Easy SMC Trading  ,  Institutional SMC Architect Volume Analysis Tools  ,  Volume flow Profile  ,  Market volume profile  , FVG with Volume  , Liquidity Heatmap Profile  ,  Volume Spread Analysis Spike Blaster Pro is a next-generation MT5 indicator designed specifically for synthetic markets. It works seamlessly on Boom Index and Weltrade Index , providing traders with sharp, reliable spike detection signals. What makes Spike Blaster Pro po
ALIEN DASHBOARD FULL EDITION – Professional ICT & Precision Trading Dashboard for MT5 ( HYBRID ENGINE ) Overview The   Alien Dashboard Full Edition   is a comprehensive, all‑in‑one technical indicator for MetaTrader 5 that merges the most powerful concepts from Inner Circle Trader (ICT) methodology with advanced precision‑entry logic, multi‑timeframe analysis, and an intuitive on‑chart dashboard. Designed for serious traders who want to visualise institutional order flow, identify high‑probabili
MarketProfileTPO: Анализ TPO в MetaTrader 5 Индикатор MarketProfileTPO для MetaTrader 5 — это мощный инструмент, предназначенный для отображения концепции Рыночного Профиля ( Market Profile ), основанной на анализе Временных Ценовых Возможностей (TPO) , прямо в главном окне вашего графика. Этот индикатор рассчитывает и отображает распределение цен за определенный период, выделяя ключевые области рыночной активности и концентрации. Он особенно оптимизирован для высоковолатильных инструментов ,
Introducing "X Marks the Spot" – Your Ultimate MetaTrader 5 Indicator for Perfect Trades! Are you tired of the guesswork in trading? Ready to take your MetaTrader 5 experience to a whole new level? Look no further – "X Marks the Spot" is here to revolutionize your trading strategy! What is "X Marks the Spot"? "X Marks the Spot" is not just another indicator – it's your personal trading compass that works seamlessly on all timeframes . Whether you're a beginner or an experienced trader,
Индикатор "MR Volume Profile 5" — это графический инструмент, отображающий объем торгов на разных ценовых уровнях, а не во временных интервалах. Ключевым понятием в профиле объема является контрольная точка (POC) — ценовой уровень с наибольшим объемом торгов за сессию или временной диапазон. В то время как такие инструменты, как VWAP или OBV , показывают тренды объема, индикатор "MR Volume Profile 5" предоставляет подробную информацию о том, где происходит наибольшая рыночная активность на конкр
С этим продуктом покупают
ARIPoint
Temirlan Kdyrkhan
1 (1)
ARIBot is a powerful trading companion designed to generate high-probability entry signals with dynamic TP/SL/DP levels based on volatility. Built-in performance tracking shows win/loss stats, PP1/PP2 hits, and success rates — all updated live. Key Features: Buy/Sell signals with adaptive volatility bands Real-time TP/SL/DP levels based on ATR Built-in MA Filter with optional ATR/StdDev volatility Performance stats panel (Success, Profit/Loss, PP1/PP2) Alerts via popup, sound, push, or email Cus
PrimeScalping is a powerful trading companion designed to generate high-probability entry signals with dynamic TP/SL/DP levels based on volatility. Built-in performance tracking shows win/loss stats, PP1/PP2 hits, and success rates — all updated live. Key Features: Buy/Sell signals with adaptive volatility bands Real-time TP/SL/DP levels based on ATR Built-in MA Filter with optional ATR/StdDev volatility Performance stats panel (Success, Profit/Loss, PP1/PP2) Alerts via popup, sound, push, or e
ScalpPoint is a powerful trading companion designed to generate high-probability entry signals with dynamic TP/SL/DP levels based on volatility. Built-in performance tracking shows win/loss stats, PP1/PP2 hits, and success rates — all updated live. Key Features: Buy/Sell signals with adaptive volatility bands Real-time TP/SL/DP levels based on ATR Built-in MA Filter with optional ATR/StdDev volatility Performance stats panel (Success, Profit/Loss, PP1/PP2) Alerts via popup, sound, push, or emai
SmartScalping is a powerful trading companion designed to generate high-probability entry signals with dynamic TP/SL/DP levels based on volatility. Built-in performance tracking shows win/loss stats, PP1/PP2 hits, and success rates — all updated live. Key Features: Buy/Sell signals with adaptive volatility bands Real-time TP/SL/DP levels based on ATR Built-in MA Filter with optional ATR/StdDev volatility Performance stats panel (Success, Profit/Loss, PP1/PP2) Alerts via popup, sound, push, or e
MasterTrend Indicator for MT5 A powerful trend-following and signal-evaluation tool MasterTrend   is a custom MT5 indicator that combines Moving Averages and ATR-based risk/reward logic to generate clear buy/sell signals. It visualizes dynamic SL/TP levels, evaluates past trade outcomes, and displays win/loss statistics in a clean on-chart panel. Key features include: Buy/Sell signals based on MA crossovers ATR-based SL/TP1/TP2/TP3 levels with visual lines and labels Signal outcome tracking wit
MERAVITH SCANNER — это профессиональный индикатор финансовых рынков для MetaTrader 5, который объединяет несколько аналитических инструментов в единую интегрированную систему. Он выполняет все расчёты автоматически, используя собственную методологию средневзвешенной цены по объёму (VWAP), полностью исключая субъективную интерпретацию. Индикатор работает на всех классах активов (Forex, акции, индексы, товары, криптовалюты) и на всех таймфреймах от M1 до Monthly. Базовый принцип заключается в том,

MasterTrend Indicator for MT5 A powerful trend-following and signal-evaluation tool MasterTrend   is a custom MT5 indicator that combines Moving Averages and ATR-based risk/reward logic to generate clear buy/sell signals. It visualizes dynamic SL/TP levels, evaluates past trade outcomes, and displays win/loss statistics in a clean on-chart panel. Key features include: Buy/Sell signals based on MA crossovers ATR-based SL/TP1/TP2/TP3 levels with visual lines and labels Signal outcome tracking wit
ARICoin is a powerful trading companion designed to generate high-probability entry signals with dynamic TP/SL/DP levels based on volatility. Built-in performance tracking shows win/loss stats, PP1/PP2 hits, and success rates all updated live. Key Features: Buy/Sell signals with adaptive volatility bands Real-time TP/SL/DP levels based on ATR Built-in MA Filter with optional ATR/StdDev volatility Performance stats panel (Success, Profit/Loss, PP1/PP2) Alerts via popup, sound, push, or email Cust
IVISTscalp5
Vadym Zhukovskyi
5 (6)
[iVISTscalp5]:  Лаборатория исследования поведения рынка через время TLV Framework | Liquidity Activation Points Общее описание iVISTscalp5 — это мультиуровневый индикатор таймингов и ценовой структуры, разработанный в рамках проекта VISTmany. Система прогнозирует время, направление и диапазон движения через Liquidity Activation Points (тайминги). Индикатор iVISTscalp5 можно использовать с параметрами по умолчанию для любого финансового инструмента. -----------------------------------------
Индикатор интеллектуальных торговых сигналов «Red and Green Light» Описание продукта Red and Green Light — это профессиональный индикатор торговых сигналов, основанный на многоступенчатом сглаживающем алгоритме T3. Он объединяет визуальную систему «светофора», интеллектуальное распознавание сигналов, оповещения о рисках и многоуровневую систему уведомлений. Независимо от того, являетесь ли вы ручным трейдером или разработчиком советников (EA), этот индикатор поможет вам точнее улавливать р
Робот с видео приложен во вкладке "Обсуждение" , он работает одним ордером и только по сигналам для оценки эффективности индикатора. Pan PrizMA CD Phase является опцией, построенной на базе индикатора Pan PrizMA . Подробнее . Усреднение полиномом второй-четвертой степени повышает гладкость линий, добавляет инерцию и соответственно ритмичность. Экстраполяция функцией синусоиды около константы позволяет регулировать запаздывание или опережение. Значение фазы - параметра состояния волны (близко по
Классификатор силы тренда. Показания на истории не меняет. Изменяется классификация только незакрытого бара. По идее подобен полной системе ASCTrend, сигнальный модуль которой, точнее его аппроксимация в несколько "урезанном" виде, есть в свободном доступе, а также в терминале как сигнальный индикатор SilverTrend . Точной копией системы ASCTrend не является. Работает на всех инструментах и всех временных диапазонах. Индикатор использует несколько некоррелируемых между собой алгоритмов для класси
FFx Universal Strength Meter PRO - это больше, чем простой измеритель силы. Вместо того, чтобы ограничивать расчет ценой, его значения могут быть основаны на любом из 19 встроенных режимов измерения силы + 9 таймфреймов. С FFx USM вы сможете задавать любой период для любой комбинации таймфреймов. Например, вы можете установить панель на последние 10 свечей на M15-H1-H4… Полная гибкость! Простая интерпретация... Это дает отличное представление о том, какие валюты слабые и сильные, поэтому вы смож
Индикатор FFx Universal MTF Alerter показывает все тайфреймы (от M1 до месячного) на одном графике, отображая статус выбранного индикатора на каждом из них. 9 индикаторов (MACD-RSI-Stochastic-MA-ADX-Ichimoku-Candles-CCI-PSAR). Каждый из них можно несколько раз применять на одном графике с различными настройками. Простая интерпретация. Сделки на покупку подтверждаются, когда большинство таймфреймов показывается зеленым цветом. А сделки на продажу подтверждаются, когда большинство таймфреймов пока
FFx Watcher PRO - панель для отображения на одном графике текущего направления стандартных индикаторов (до 15 одновременно) на нескольких таймфреймах (до 21). Панель работает в двух режимах: Режим Watcher: Мульти-индикаторный Пользователь может выбрать до 15 индикаторов для отображения Пользователь может выбрать до 21 таймфрейма для отображения Режим Watcher: Мультивалютный Пользователь может выбрать любое количество символов Пользователь может выбрать до 21 таймфрейма для отображения В этом реж
Индикатор FFx Patterns Alerter дает торговые рекомендации по входу в рынок, по уровням TP 1, TP 2 и SL на основе любого из выбранных паттернов (PinBar, Engulfing, InsideBar, OutsideBar) Предлагаются следующие варианты: Для работы с несколькими парами можно запускать несколько экземпляров индикатора на одном графике. Рекомендации по входу - количество пипсов, которые будут добавлены после пробоя для входа в рынок 3 различных варианта расчета SL - по пипсам, с использованием множителя ATR или по м
Версия для MetaTrader 4 доступна здесь : https://www.mql5.com/ru/market/product/24881 FFx Basket Scanner ищет до пяти индикаторов среди 16 доступных на всех парах и таймфреймах. Таким образом вы можете ясно увидеть торговли по каким валютам следует избегать, а на каких сосредоточить внимание. Когда валюта переходит в экстремальную зону (например, 20/80%), вы можете торговать всей корзиной с большей уверенностью. Другая область применения индикатора – определение сильных и слабых валют для поиск
Версия для MetaTrader 4 доступна здесь: https://www.mql5.com/ru/market/product/25793 FFx Pivot SR Suite PRO - это полный набор инструментов для построения уровней поддержки и сопротивления. Поддержка и сопротивление - самые используемые уровни во всех видах торговли. Их можно использовать для поиска разворотов тренда, установки уровней тейк-профита и стоп-лосса и т.д. Индикатор можно полностью настроить непосредственно с графика Выбор из 4 периодов для расчетов: 4-часовой, дневной, недельный и
ClassicSBA
Umri Azkia Zulkarnaen
this indicator very simple and easy if you understand and agree with setup and rule basic teknical sba you can cek in link : please cek my youtube channel for detail chanel : an for detail info  contact me  basicly setup buy (long) for this indicator is Magenta- blue and green candle or magenta - green  and green candlestik and for setup sell (short) is Black - yellow - and red candle or black - red  and red candlestik
Indicador en base a la pendiente de la linea de precio, dibuja una línea de color cuando sube a base de los precios que previamente has sido procesados o linealizados, y cuando baja la pendiente la linea linealizada toma otro color. En este caso se a considerado 6 lineas de diferentes procesos desde pendientes largas hacia las cortas, observándose que cuando coincidan las pendientes se produce un máximo o mínimo, lo que a simple vista nos permitirá hacer una COMPRA O VENTA.
WanaScalper
Isaac Wanasolo
1 (1)
A scalping indicator based on mathematical patterns, which on average gives signals with relatively small SL, and also occasionally helps to catch big moves in the markets (more information in the video) This indicator has three main types of notifications: The first type warns of a possible/upcoming signal on the next bar The second type indicates the presence of a ready signal to enter the market/open a position The third type is for SL and TP levels - you will be notified every time price re
Fibonacci Múltiple 12, utiliza la serie fibonacci plasmado en el indicador fibonacci, aumentadolo 12 veces según su secuencia. El indicador fibonacci normalmente muestra una vez, el presente indicador se mostrara 12 veces empezando el numero que le indique siguiendo la secuencia. Se puede utilizar para ver la tendencia en periodos cortos y largos, de minutos a meses, solo aumentado el numero MULTIPLICA.
Recommended TimeFrame >= H1. 100% Non Repainted at any moment.  Use it carefully, only with Trend Direction. Trading Usage: 2 Variants: as Range System or as BreakOut System (Both Only With Trend Direction)::: (Always use StopLoss for minimise Risk); [1] as Range System: (Recommended) in UP TREND:  - BUY in Blue Line , then if price goes down by 50 points (on H1) open Second BUY.   Close in any Profit you wish: TrailingStop(45 points) or Close when Price touches upper Gold Line. in DOWN TREND
En base a cálculos matemáticos de determino una linea Horizontal que cruza a todas las señales de trading, mostrando los máximos y mínimos. La linea horizontal parte en dos las subidas y bajadas de las señales de trading, de tan manera que es fácil identificar los máximos y mínimos, y es inteligente por que es sensible a las subidas y bajadas, afín de no quedarse en un solo lado por siempre, trabaja excelentemente con otros indicadores suavizadores ya que les garantiza que en un intervalo de tie
этот индикатор является индикатором детектора спайков, он специально разработан для обмена на Boom 1000, Boom 500, Crash 1000 и Crash 500 Мы рекомендуем использовать его только для индексов Deriv Boom и Crash. Его настройки интуитивно понятны, знакомы, просты в использовании имеет функции уведомления; звуковые уведомления и push-уведомления. этот инструмент прост в использовании, прост в обращении Это обновление основано на разных стратегиях для шипов.
Limitless MT5  - это универсальный индикатор который подойдет каждому как начинающему так и опытному трейдеру работает на всех валютных парах криптовалютах сыре акциях Limitless MT5 - уже настроен и не требует дополнительной настройки   А теперь главное Почему  Limitless MT5 ? 1 полное отсутствие перерисовки  2 два года тестирования лучшими специалистами в трейдинге 3 точность правильных сигналов превышает 80% 4 хорошо показал себя в торговле во время выхода новостей Правила торговли  1 сигнал н
Indicador en MQL5, recibe la información del precio SUAVIZADO, lo procesa anulando los picos inteligentemente, y el resultado lo envía al desarrollo de la escalera que iniciara y subirá o bajara según el peldaño o INTERVALO ingresado Ingreso PERIODO = 50 (variar segun uso) Ingreso MULTIPLICA AL PERIODO = 1 (variar segun uso) Segun la configuración la escalera puede pegarse o separarse de los precios,, Se aplica toda la linea de tiempo, y a todas las divisas, etc.  
Indicador en MQL5, que obtiene el promedio de 10 EMAS, que son alineadas según Fibonacci, obteniendo un promedio, que sera suavizado.  Se puede ingresar un numero desde 2 a N, que multiplica a los EMA-Fibonacci. Funciona en cualquier criptomoneda, etc. etc... pudiendo calcular el futuro segun la tendencia de las EMAS. Funciona excelentemente en tramos largos, determinando exactamente el mejor inicio/salida. El precio inicial por apertura sera por un periodo de tiempo, luego aumentará.
QuantXSTocks Trading Range Indicator for MT5: INSTRUCTIONS TO USE OUR INDICATOR:- User needs to take trade on Arrow or after an Arrow CandleStick, You can achieve up-to 35-125 pips target by this Indicator. Best Timeframes for Stocks and Indices are M30 and H1: AMAZON M30 (50 pips) TESLA M30 (50 pips) APPLE M30 (50 pips) ADOBE M30 (50 pips) NASDAQ100 H1 (125 pips) The above are the approximate amount of pips you can achieve by this Indicator, Green arrow appears to be buy arrow while the Red ar
Super Suavizador
Cesar Juan Flores Navarro
Indicador en MQL5 que obtiene el promedio de 10 EMAS que son alineadas y procesadas según Fibonacci luego el promedio es suavizado"  Se ingresa un número de 2 a N que multiplica los EMA-Fibonacci y por consiguiente aumenta los fibonacci, resultando un promedio.   Se ingresa un número que suaviza los EMA-Fibonacci. Considerando los números 1/1 seria la suavización minima. Considerando los números 3/5 seria la suavización media. Considerando los números 10/30 seria la suavización alta.....etc
Фильтр:
Нет отзывов
Ответ на отзыв