SMC Inducement MT4

SMC Inducement — The Trap Before the Entry, Marked While It Still Matters

An inducement scanner that shows you the liquidity price has to take before the zone is worth trading — and keeps score of every setup it ever found on your chart.

The pullback you are looking at is usually the bait

Structure breaks. A clean order block is left behind. You mark it, price comes back, you enter at the top of the zone — and price runs twenty pips past your stop before turning around and going exactly where you thought it would.

Nothing was wrong with your zone. What was wrong was the timing. Between the pullback low and the break of structure there is almost always a small, obvious low sitting in plain sight, and every trader watching that chart has an order under it. That low is not support. It is fuel. Price is going to take it, and only then is the zone behind it worth anything.

Most structure indicators never draw that low. They mark the order block, extend it forward, and leave you to guess whether the tap you are watching is the real one or the one that exists purely to collect your stop.

SMC Inducement draws it. The structure, the break, the inducement, the zone and the levels are all marked as one object, the entry is only recognised after the inducement has actually been taken, and a panel in the corner tallies every setup on the chart in front of you — your symbol, your broker's history, your settings.

What it draws, and how to read it

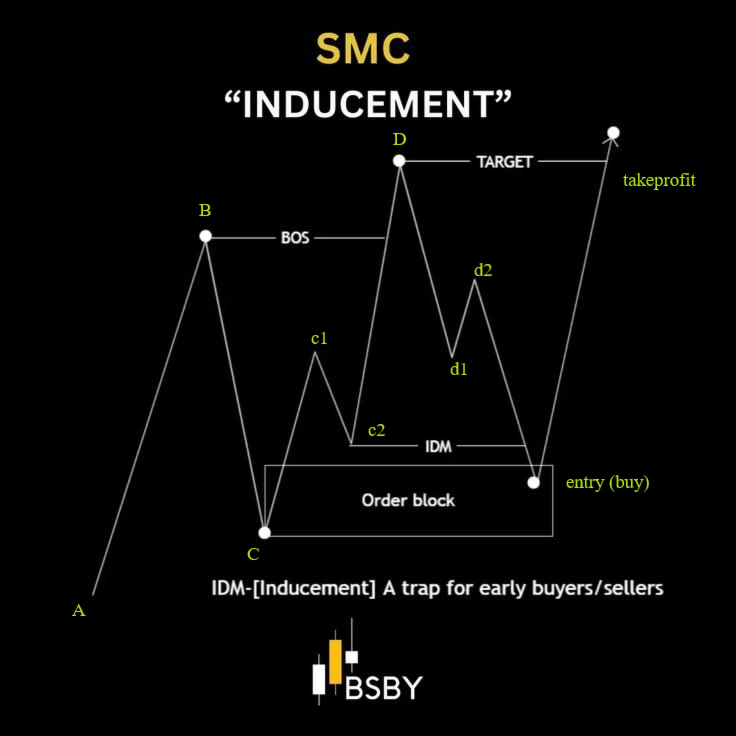
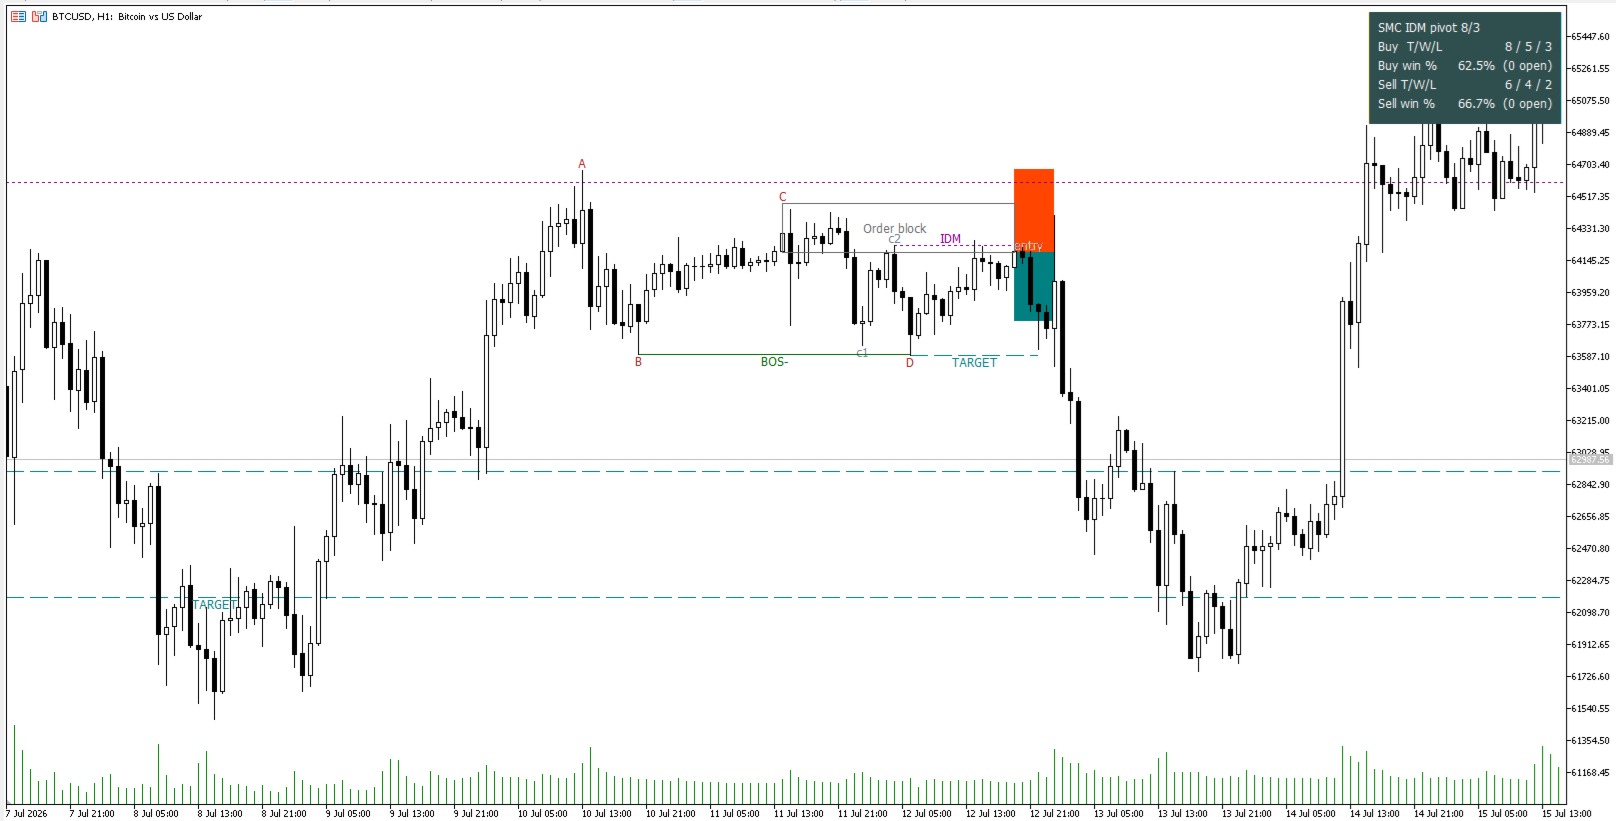
The indicator marks the pattern in both directions. Uppercase labels come from the main structure; lowercase labels come from a second, finer swing scale that exists purely to expose the small moves inside it.

Reading a bullish setup left to right:

Label What it is
A the low the leg starts from
B the structure high that is going to be broken
C the pullback low that holds the order block
c1 the minor high inside the leg away from C
c2 the minor low after it — this is the inducement
BOS the horizontal line from B to the bar that broke it
D the new high after the break — the TARGET line
d1 / d2 the minor low and high that shape the retracement from D
entry price sweeps c2, taps the order block at C, and the levels appear

A bearish setup is the exact mirror, top to bottom.

The chart tells this story in three stages.

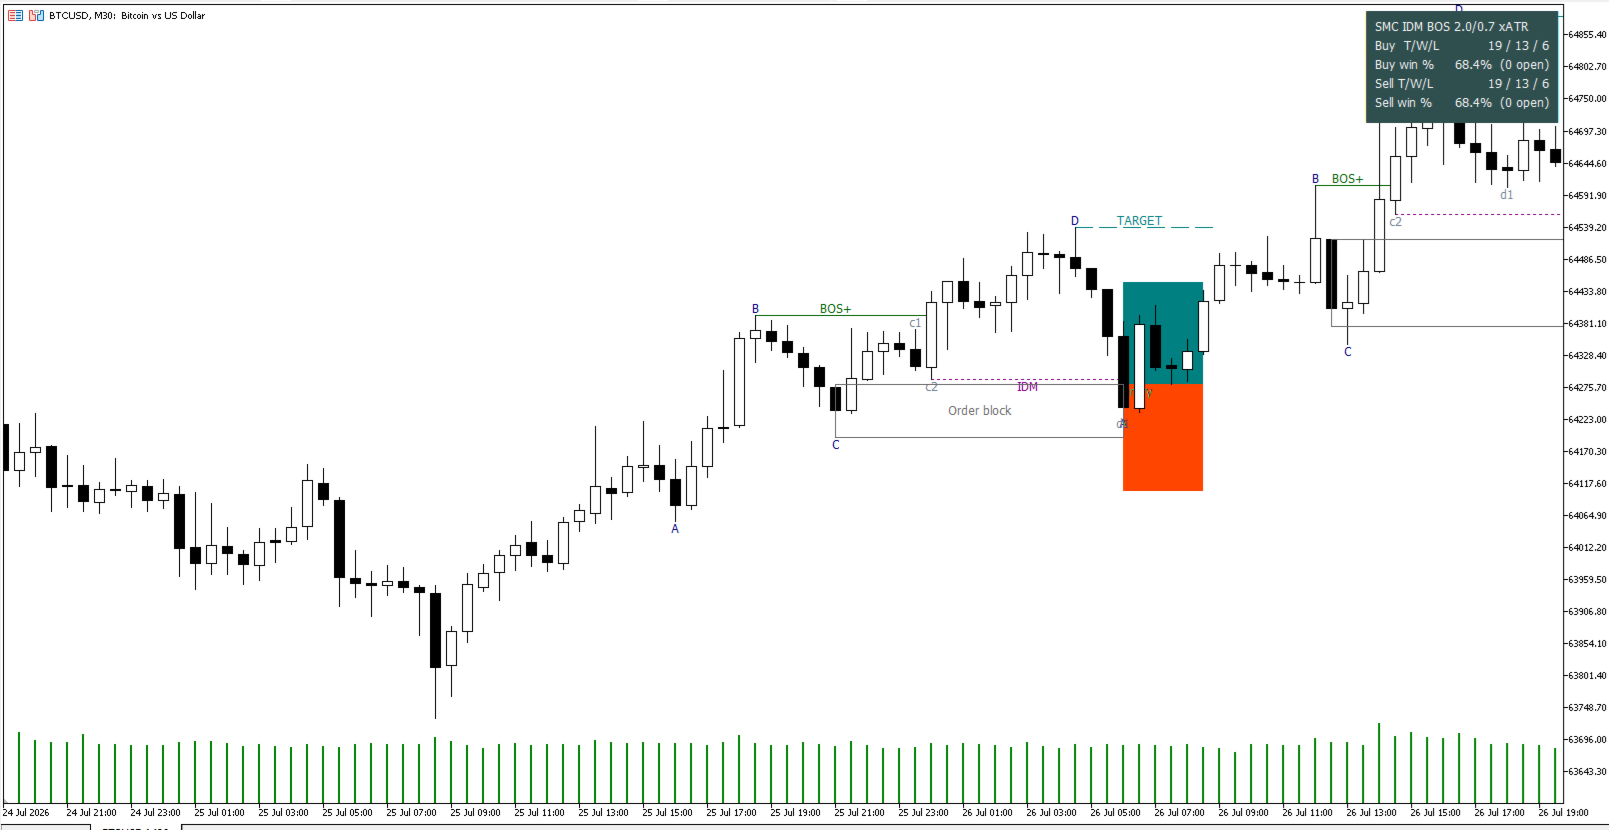
Stage one — the structure appears. As soon as the swing at D is confirmed, the whole picture is drawn at once: the labels, the BOS line marking where structure actually broke, the dotted IDM line running forward from the inducement, the dashed TARGET line at D, and the order block at C boxed and extended to the right in the "waiting" colour. Nothing has happened yet, and the chart says so.

Stage two — price comes back. When price returns, takes the inducement, and trades into the block while the block is still alive, the entry label is placed at the near edge of the zone and two boxes are drawn from it — one to the stop loss, one to the take profit. The zone box stops at the entry bar and changes colour. If price never comes back, the pattern stays at stage one forever; no entry is invented to make the picture look complete.

Stage three — the retracement fills in. The minor points d1 and d2 are added once the pullback has shaped them, and d2 is only labelled while it stays inside D. If the retracement does not have that shape, the labels are simply left off rather than forced on.

The visual language stays small on purpose: labels for structure, three horizontal levels, one box for the zone, two boxes for risk and reward. No arrows, no clouds, no repainted candles.

The inducement is the entry condition, not a decoration

Drawing the trap is the easy half. The half that changes results is refusing to call anything an entry until the trap has been sprung.

By default the indicator requires the inducement to be taken first. Price reaching the zone without having swept c2 is not an entry — it is price arriving early, which is exactly the sequence that produces the stop-hunt you have been eating. Both halves of the rule are switchable: you can require an inducement to exist at all before a pattern is accepted, and you can require it to be swept before an entry is recognised. Turn both off and you get the plain order-block behaviour, which makes the difference easy to measure on the statistics panel.

The inducement also has to be a genuine one. A minor low that sits below C is not a pullback inside the leg — it is a break of it, and the pattern is rejected rather than stretched to fit.

Two detection engines. Switch between them with one dropdown.

There is no universally correct way to decide what counts as a swing, and that choice changes everything downstream. So the indicator ships with two independent structure engines and one parameter to select between them.

Engine 1 — bar-based. A swing must stand clear of a fixed number of bars on each side. Familiar, predictable, easy to reason about. Its weakness is that it measures structure in bars: the same market move is recognised when it develops slowly and missed when it develops quickly. In this engine the break of B is judged by price alone.

Engine 2 — volatility-based (default). A swing is confirmed when price retraces against it by a configurable multiple of current market volatility. Nothing is measured in bars, so one setting travels between a fast metal and a slow currency pair without re-tuning. This engine also validates the structure differently and more strictly:

  • The break of B must be a genuine close beyond it, recorded before D forms. A long wick through the high that closes back underneath is not a break — and a large class of false structures disappears with it.
  • The chain is explicitly invalidated: if price closes beyond A before D is reached, the whole setup is discarded instead of being counted.

Both engines feed the identical downstream logic — same inducement rule, same order block, same entry, same levels, same statistics. That is the entire point. Flipping the dropdown changes only how structure is read, so the panel gives you a like-for-like comparison of the two engines on your own instrument. Most users find one clearly suits their market better than the other, and now they can prove which.

Each engine carries its own sensitivity for the major structure and for the minor swings that expose the inducement, so you can read big structure while still seeing the small low inside it.

Zones that know when they are dead

An order block is liquidity, and liquidity only matters while price has not traded through it.

Every zone here is an object with a lifetime. It stays valid until a candle closes beyond it — never merely wicks beyond it. A wick that pierces the zone and closes back inside leaves the block alive, which is exactly right: reaching for liquidity and failing to hold there is a signal, not an invalidation.

When a zone dies it is not faded or left as decoration. If the block was invalidated before it ever produced an entry, the whole pattern is discarded — off the chart and out of the statistics. Setups that never became tradeable do not get to flatter the numbers.

The same discipline applies to the levels. The stop is pushed outside the zone, away from the entry, so the position has room to breathe. The target is pulled inside D, towards the entry, so profit is taken before price is required to break the prior extreme. Both offsets are calibrated to market volatility at the entry bar, and both are configurable. If the geometry leaves no room between entry and target, the setup is dropped rather than reported as a trade that won at the moment it opened.

The statistics panel — verify the idea on your own chart

A compact panel sits in the corner and shows, separately for buys and sells:

  • Total / Won / Lost — every pattern that actually produced an entry
  • Win rate

Two things matter more than the numbers themselves.

They are computed on your chart. Your symbol, your broker's history, your timeframe, your settings. Change the engine, change the swing sensitivity, switch the inducement requirement off and on, move the stop and target multiples — the panel recalculates. You are not being asked to believe someone else's screenshot.

They are deliberately conservative. A pattern only counts once price returned and an entry existed. A bar that touches both the stop and the target is recorded as a loss, because the indicator cannot know which came first and the pessimistic reading is the honest one. Patterns whose zone died before an entry are removed from the sample entirely rather than counted as losses avoided.

Read the panel for what it is: a fast, close-only historical tally that ignores spread, commission, slippage and execution quality. It is a research tool for comparing settings against each other — not a broker statement.

Keep the chart to what is still tradeable

History is useful for judging the concept and terrible for trading in front of. One switch — Draw only the newest pattern plus every waiting one — reduces the chart to the setups you can still act on: the most recent structure in each direction, plus every pattern whose zone is alive and still waiting for price.

The statistics do not change. The filter affects drawing only; the panel keeps scoring the full history behind it. You get a clean chart and an honest sample at the same time, which is normally a trade-off you are forced to make.

Alerts that respect your attention

Two alert modes, selectable:

Touch — fires the moment price trades into the zone, evaluated on every tick. Use this when you want to be at the chart while the zone is being tested.

Bar close — fires only when a bar closes, and only if that bar reached into the zone without closing beyond it. A wick through the block that closes back inside still qualifies. This is the filtered mode: it stays quiet when price is slicing straight through and speaks when the zone actually produced a reaction.

In both modes the alert follows the setup that is still waiting, not one that has already played out, and where the inducement rule is active the alert waits for the sweep as well. At most one alert per bar per direction. Loading the indicator, switching timeframes or restarting the terminal never replays historical signals — the first calculation pass runs silently by design. Delivery can be a terminal pop-up, a mobile push notification, e-mail, or Telegram.

Symbols, timeframes and presentation

Any symbol, any timeframe. No hard-coded instrument, no hard-coded session. With the volatility-based engine there is no bar-count parameter to re-tune when you change market.

Attach it to the chart you want to read. The indicator does not quietly pull other timeframes behind your back; everything you see is computed from the chart it is on. Want higher-timeframe context? Attach a second copy to a higher-timeframe chart — object names are made unique automatically, so instances never collide.

Light and Dark themes built in. Pick the preset that matches your chart and every colour is set for you, including a statistics panel deliberately styled to contrast with your background so it stays readable, and sized from the text it holds so nothing is ever clipped. Prefer your own palette? Switch the theme to Custom and every colour becomes editable.

What to expect — honest talk

This is an analysis tool, not a trading system. It marks structure, the inducement, the zone and the levels. It does not open, modify or close orders, and it makes no claim about what you should do with the information.

Not every pattern produces a trade. Price frequently never comes back, or comes back without ever taking the inducement. That is normal, and it is visible: those patterns stay at stage one instead of being quietly converted into signals.

The structure appears after its final swing is confirmed, not at the exact high or low. Every honest structure reading has this delay — a swing is not a swing until price has moved away from it. What the indicator guarantees is that it never looks into the future: the entry is only ever searched for on bars after the pattern became visible, so what you see on history is what you would have seen live.

Settings matter, and the right ones depend on your market. Swing sensitivity is the parameter that moves results the most, and the minor sensitivity decides whether the inducement you see is the one you meant. Loosen them and you catch only large structures; tighten them and you catch many more, with more noise. Use the panel to find the balance on your instrument instead of assuming the defaults are optimal for you.

Past performance does not guarantee future results. The panel describes what happened on historical data under simplified assumptions. It is not a forecast and it is not investment advice.

Run it on a demo chart for a couple of weeks before you rely on it. Watch how the zones and the sweeps behave on your symbol. That is the only test that counts.

Quick setup

  1. Attach SMC Inducement to the chart you want to read — any symbol, any timeframe.
  2. Pick your Colour theme: Light for a white background, Dark for a dark one.
  3. Leave Detection method on the default volatility-based engine to start.
  4. Watch the panel and adjust the major swing threshold until the number of patterns on your chart looks reasonable, then the minor threshold until the inducement lands where your eye says it should.
  5. Turn on Draw only the newest pattern plus every waiting one once you are done exploring history.
  6. Set Alert mode and Alert channel if you want to be told when price reaches a zone.

Main parameters

Parameter Default Description
Detection method Volatility-based Which structure engine is active. Switch to compare the two.
Major swing threshold 2.0 Volatility multiple a retracement must reach to confirm a main swing. The primary sensitivity control.
Minor swing threshold 0.7 Same idea for the finer scale that exposes the inducement.
Major / minor pivot length 8 / 3 Bars required each side of a swing — used only by the bar-based engine.
An inducement is required On Reject structures that never left a trap behind.
Entry only after the sweep On The inducement must be taken before a tap into the zone counts.
Detect BUY / SELL patterns On / On Enable each direction independently.
Patterns drawn per direction 3 How many recent patterns stay on the chart.
Draw only newest + waiting Off Chart shows only what is still actionable. Statistics still cover the full history.
Bars to calculate 3000 History depth. Raise it for a larger statistical sample.
Stop loss offset 1.0 How far outside the zone the stop sits, in volatility multiples.
Take profit offset 1.0 How far inside the target extreme the take profit sits, in volatility multiples.
Points may be non-adjacent Off Allows minor swings to sit inside the structure. Turn on to detect more patterns.
Colour theme Light Light, Dark, or Custom.
Alert mode On bar close Off, on touch, or on bar close.
Alert channel Terminal alert Terminal, mobile push, e-mail, or Telegram.
Object name tag (auto) Leave empty for automatic uniqueness across multiple instances.

Everything else is presentation: fonts, individual colours, panel position and offsets.

Рекомендуем также
Индикатор для бинарных опцыонов стрелочный прост в использовании и не требует настройки работает на всех валютных парах акцыях крипто валюте сигнал на покупку синяя стрелка вверх  сигнал на продажу красная стрелка в низ  советы не стоит торговать во время новостей и за 15-30 минут перед их выходом так как рынок слишком волотилен и очень много шума  входить в сделки стоит на одну или две свечи от текущего периода ( рекомендуется на 1 свечу ) таймфрейм до м 15 рекомендуемый мани менеджмент фиксир
The  Market Sessions Indicator for MT5 helps you  predict market turnarounds  by detecting major supply and demand areas. These pivot points tend to occur after a new session has started and the previous one is still open. It is also used to gauge how many points or pips the market moves on average during a session. This helps us to place better our take profits and stop losses. The indicator works on all forex pairs, gold, silver, commodities, stocks, indices and any other instrument that your
Advanced Stochastic Scalper - это профессиональный индикатор на базе известного индикатора Stochastic Oscillator. Advanced Stochastic Scalper представляет из себя осциллятор с динамическими уровнями перекупленности и перепроданности, у стандартного Stochastic Oscillator эти уровни статические и никогда не изменяются. Это позволяет Advanced Stochastic Scalper адаптироваться под постоянно меняющийся рынок. При появлении сигнала на покупку или продажу на графике рисуется стрелка и появляется алерт,
Exclusive Bollinger - это профессиональный индикатор на базе известного индикатора Bollinger Bands , но с более продвинутым алгоритмом. В отличие от стандартного Bollinger , мой Exclusive Bollinger дает более качественные сигналы и оснащен гибкими настройками, что позволяет трейдерам подстроить этот индикатор под свой стиль торговли. В индикаторе есть возможность настроить уведомления (алерт, почта, телефон), что поможет вам не пропустить торговый сигнал. Преимущества индикатора Индикатор прекр
VR Cub
Vladimir Pastushak
VR Cub это индикатор что бы получать качественные точки входа. Индикатор разрабатывался с целью облегчить математические расчеты и упростить поиск точек входа в позицию. Торговая стратегия, для которой писался индикатор, уже много лет доказывает свою эффективность. Простота торговой стратегии является ее большим преимуществом, что позволяет успешно торговать по ней даже начинающим трейдерам. VR Cub рассчитывает точки открытия позиций и целевые уровни Take Profit и Stop Loss, что значительно повы
«Dynamic Scalping Oscillator» — это продвинутый пользовательский индикатор Crypto_Forex, эффективный инструмент для торговли на MT4! — Новое поколение осцилляторов — смотрите изображения, чтобы узнать, как им пользоваться. — Dynamic Scalping Oscillator имеет адаптивные зоны перепроданности/перекупленности. — Осциллятор — вспомогательный инструмент для поиска точных точек входа в динамических зонах перепроданности/перекупленности. — Значения перепроданности: ниже зелёной линии, значения перекупл
Индикатор определения флета и тренда. Если цена ниже любой из двух гистограмм и двух линий (красной и синей), это зона продаж. При покупке этой версии индикатора, версия  МТ5  для одного реального и одного демо-счета - в подарок (для получения, напишите мне личное сообщение)! Если цена выше любой из двух гистограмм и двух линий (красной и синей), это зона покупок. MT5 version:  https://www.mql5.com/ru/market/product/70409 Если цена находится между двух линий или в зоне любой из гистограмм, знач
TPA True Price Action indicator reveals the true price action of the market makers through 100% non-repainting signals (except early signals mode) strictly at the close of a candle! TPA shows entries and re-entries, every time the bulls are definitely stronger than the bears and vice versa. Not to confuse with red/green candles. The shift of power gets confirmed at the earliest stage and is ONE exit strategy of several. There are available now two free parts of the TPA User Guide for our custom
WPR по Профилю, или WPR для Профессионалов Индикатор Geo_WprPro - один из серии знаменитых индикаторов по профилю валюты - осуществляет одновременное отображение в матричном виде состояния двух индикаторов WPR с разными параметрами на всех таймфреймах на нескольких валютных парах, образующих профиль валюты. Как следует из описания, " Индикатор WPR является опережающим индикатором, чаще всего, он опережает график цены. Замечено, что осциллятор очень часто образует экстремумы перед разворотом цены
EZZ Elite Zig Zag is an indicator for the MetaTrader 4 terminal. This indicator traces the peak of the trend based on the market reversal, thus showing various opportunities in the financial market. EZZ Elite Zig Zag is a visual tool, intuitive, and easy to understand and use.  Test it Yourself by Downloading it for Free. Author Paulo Rocha all rights reserved
Уникальный индикатор, реализующий профессиональный и количественный подход к торговле на возврате к среднему. Он использует тот факт, что цена отклоняется и возвращается к среднему предсказуемым и измеримым образом, что позволяет использовать четкие правила входа и выхода, которые значительно превосходят неколичественные торговые стратегии. [ Installation Guide | Update Guide | Troubleshooting | FAQ | All Products ] Четкие торговые сигналы Удивительно легко торговать Настраиваемые цвета и разме
Quantum Falcon Signal Free is a smart visual trading indicator for MetaTrader 4 designed for Forex and Gold traders. The indicator combines: • Trend analysis • RSI momentum confirmation • MACD momentum filtering • ATR volatility filtering • Higher timeframe confirmation • Smart exit signal detection Main Features: • Smart Buy and Sell signals • Exit Buy / Exit Sell alerts • Real-time dashboard on chart • Professional candle arrows • Multi-timeframe trend confirmation • ATR market volatility filt
FREE
Индикатор поддержки и сопротивления для бинарных опционов Этот индикатор разработан специально для торговли бинарными опционами и отлично показывает откаты от уровней поддержки и сопротивления. Сигналы появляются на текущей свече. Красная стрелка, направленная вниз, указывает на потенциальную возможность продажи, а синяя стрелка, направленная вверх, предлагает возможности для покупки. Все, что вам нужно настроить, это цвет сигнальных стрелок. Рекомендуется использовать его на таймфреймах M1-M5,
Scalping dynamic system - динамическая система определения разворотов цены. Индикатор ищет на графике, точки разворота цены и ставит в этих местах стрелки. Когда индикатор рисует синюю стрелку, есть большая вероятность, что цена развернется вверх. Когда индикатор рисует красную стрелку, есть большая вероятность, что цена развернется вниз. Применение этого индикатора в торговом процессе очень простое. На видео под описанием мы покажем подробно как торговать применяя данный индикатор. Так же на гр
EARLY REMINDER: The Starting price is 65 price will rise soon up to 365$ and then 750$ after first 10 copies of sales. Grab this offer now! Introduction Hello, traders! Welcome to the demonstration of the Forex Beast Indicator , a comprehensive tool designed to assist aspiring traders in navigating the complexities of the forex market. This indicator incorporates seven essential components to provide a well-rounded trading experience: Moving Averages Colored Zones Support and Resistance Levels
The  Market Sessions Indicator for MT5 helps you  predict market turnarounds  by detecting major supply and demand areas. These pivot points tend to occur after a new session has started and the previous one is still open. It is also used to gauge how many points or pips the market moves on average during a session. This helps us to place better our take profits and stop losses. The indicator works on all forex pairs, gold, silver, commodities, stocks, indices and any other instrument that you
SuperTrend Alerts добавляет алерты к популярному индикатору SuperTrend, который следует за трендом и потому хорошо работает только при выраженном тренде. SuperTrend широко используется во внутридневной и дневной торговле, работает на любом таймфрейме. Устанавливайте call, когда цена свеча закрывается выше линии SuperTrend, и put, когда цена закрывается ниже. Эти условия обозначаются неперерисовывающимися стрелками вверх/вниз. Алерты Предусмотрены звуковые алерты, алерты в виде всплывающих сообщ
TrendWavePattern  an another way to trade with a harmonic pattern, a maestro classic pattern . I made some improvements and combinations with my own strategy. Trend direction, buy-sell signal ,hi-low area and pivot line. These will be helpful for trader to read the current market condition. So it is not blindly following the pattern itself but also following other informations from the market. Readable chart appearance . Designed to be user friendly even you are a new trader. BUY-SELL zone, Tak
Ugenesys AI MT4
Odaine Ramon Mcmillan
5 (1)
uGenesys AI - 90% Accurate Daytrading Indicator Introducing the ultimate forex trading indicator system, uGenesys AI, powered by cutting-edge AI technology and advanced analytical techniques, including Time-Series Analysis and Genetic Algorithms. Our AI-powered trading system leverages the power of time-series analysis to identify trends and patterns in historical price data, allowing traders to make informed predictions about future market movements. By analyzing vast amounts of data, our syst
Your good friends — это не просто индикатор, а ваш надёжный торговый помощник, созданный для трейдеров, которые ценят простоту, ясность и стабильность. Он объединяет лучшие классические методы технического анализа: уровни поддержки и сопротивления, разворотные сигналы, визуальные подсказки — и подаёт их в максимально понятном и удобном виде. Подходит как новичкам, так и опытным трейдерам — особенно тем, кто хочет убрать хаос, снизить стресс и торговать по чётким сигналам . Особенности индикато
Индикатор Crypto_Forex "Стохастик с динамическими зонами перепроданности/перекупленности" для MT4, без перерисовки. - Стохастик — один из самых известных индикаторов на рынке и идеальный торговый инструмент для многих трейдеров. - Он отлично подходит для открытия позиций на продажу из динамической зоны перекупленности и покупки из динамической зоны перепроданности. - Этот индикатор также отлично сочетается с входами Price Action. - Динамическая зона перекупленности — выше желтой линии. - Динами
Great Strong System   indicator is designed for signal trading. This indicator generates trend signals. It uses many algorithms and indicators to generate this signal. It tries to generate a signal from the points with the highest trend potential. This indicator is a complete trading product. This indicator does not need any additional indicators. The indicator certainly does not repaint. The point at which the signal is given does not change.     Features and Suggestions Time Frame: H1 Wo
Gioteen Volatility Index (GVI)   - your ultimate solution to overcoming market unpredictability and maximizing trading opportunities. This revolutionary indicator helps you in lowering your losing trades due to choppy market movements. The GVI is designed to measure market volatility, providing you with valuable insights to identify the most favorable trading prospects. Its intuitive interface consists of a dynamic red line representing the volatility index, accompanied by blue line that indicat
SystemBinaryM1 - профессиональный индикатор для торговли краткосрочными бинарными опционами, представляет собой полноценную, самодостаточную авторскую стратегию работы на рынке бинарный опционов. Уникальный алгоритм работы анализа валютного рынка основан на расчете опорных точек на трех разных временных периодах M15, M5. M1. Таким образом, индикатор одновременно анализирует долгосрочное, среднесрочное и краткосрочное поведение цены перед тем как выдать сигнал. Индикатор устанавливается обычным
Over Arrow  - уникальный авторский индикатор, имеющий возможность отображения сигналов в направлении основной тенденции, или против нее. Over Arrow  подходит для любого таймфрейма, валютной пары, но лучше всего использовать его на средних временных периодах, таких как М30, Н1, Н4. Сигналы индикатора не пропадают ни при каких условиях. Отличительной особенностью является наличие фильтра тенденции, при активации которого, сигналы будут появляться только в направлении основного движения. Параметры
True Super Arrows is a powerful and versatile indicator that can help you identify and trade profitable trends. The indicator uses a combination of technical indicators to generate arrows that point to the direction of the trend. Features: Multiple trend identification methods:   The indicator uses a combination of moving averages, trend lines, and other indicators to identify trends. Accurate trend direction:   The indicator uses a variety of techniques to ensure that the arrows are pointing in
MajorAlert   – это профессиональный индикатор для MetaTrader 4, объединяющий два различных подхода к анализу рынка в одном инструменте. Благодаря интеграции   контр‑трендовой   логики (верхний блок) и   трендового   фильтра (нижний блок) индикатор выводит на график высокоточные сигналы, выделенные разными цветами стрелок. Ключевые особенности Полная автономность   – не требует внешних индикаторов, все расчёты встроены. Гибкие настройки   – параметры можно адаптировать под любой инструмент и тай
Ночной Призрак - Стрелочный индикатор для Бинарных опционов. Это надежный помощник вам в будущем! -Отсутствует перерисовка на графике -Работает отлично на валютных парах EUR/USD! -Точность индикатора до 90% (Особенно ночью) -Не нужно долго настраивать (Настроено идеально для Бинарных Опционов) -Не опаздывающие сигналы -Появление сигнала на текущей свече -Идеально подходит для периода М1 (Не Больше!) -Удобный для глаз цвет свечей (Красный и Синий) -Установлен Алерт  Работа с ним: -Синяя стрелка
Уникальная мультивалютная авторская стратегия, одновременно определяющая силу трендов и точки входа в рынок, визуализируя это с помощью гистограмм на графике. Индикатор оптимально адаптирован для торговли на временных периодах М5, М15, М30, Н1. При этом для удобства пользователя по определенной точке всегда появляется точка входа (в виде стрелки), рекомендуемые уровни получения прибыли (TP1, TP2 с текстовыми метками) и рекомендация по установке Стоп Лосс. Уровни получения прибыли (TP1, TP2) авто
Индикатор Crypto_Forex "MFI FLAT Detector" — эффективный вспомогательный инструмент в торговле! Без перерисовки. Предлагаю вам улучшить ваши торговые методы с помощью этого замечательного индикатора для MT4. - Индикатор показывает зоны плоского рынка на графике. Он имеет параметр "Чувствительность к плоскому рынку", который отвечает за обнаружение плоских зон. - "MFI FLAT Detector" очень полезен для обнаружения дивергенций и отлично сочетается с Price Action. - Вы можете использовать его в сист
С этим продуктом покупают
Gann Made Easy - это профессиональная, но при этом очень простая в применении Форекс система, основанная на лучших принципах торговли по методам господина У.Д. Ганна. Индикатор дает точные BUY/SELL сигналы, включающие в себя уровни Stop Loss и Take Profit. ПОЖАЛУЙСТА, СВЯЖИТЕСЬ СО МНОЙ ПОСЛЕ ПОКУПКИ, ЧТОБЫ ПОЛУЧИТЬ ТОРГОВЫЕ ИНСТРУКЦИИ И ОТЛИЧНЫЕ ДОПОЛНИТЕЛЬНЫЕ ИНДИКАТОРЫ БЕСПЛАТНО! Вероятно вы уже не раз слышали о торговли по методам Ганна. Как правило теория Ганна отпугивает от себя не только н
Neuro Poseidon - новый индикатор от Дарьи Резуевой. Он сочетает точные торговые сигналы с адаптивными уровнями TP/SL , в результате создавая максимально выгодные сделки! TO SWITCH TO   ENG   PLEASE CHOOSE IT IN THE UPPER-RIGHT CORNER OF THE WEBSITE Напишите мне после покупки и получите Neuro Poseidon Assistant в подарок для автоматизации вашей торговли! Что отличает его от других индикаторов? 1. Доказанная прибыльность на всех активах и таймфреймах 2. На графике присутствуют только подтвержденн
BTMM State Engine Pro by G-Labs — Beat The Market Maker indicator for MetaTrader 4. Asian session range, London and New York kill zones, level progression (L1/L2/L3), peak formation detection (PFH/PFL), entry signals, and a multi-pair scanner from one chart. Stop scanning charts one pair at a time. The State Engine tracks the BTMM daily cycle automatically — Asian box, room boundaries, level blocks, peak formations, and filtered entries — while the scanner dashboard shows level, peak status,
M1 SNIPER — это простая в использовании торговая система. Это стрелочный индикатор, разработанный для тайм фрейма M1. Индикатор можно использовать как отдельную систему для скальпинга на тайм фрейме M1, а также как часть вашей существующей торговой системы. Хотя эта торговая система была разработана специально для торговли на M1, ее можно использовать и с другими тайм фреймами. Первоначально я разработал этот метод для торговли XAUUSD и BTCUSD. Но я считаю этот метод полезным и для торговли на д
Prop Firm Sniper MT4  is a professional market structure indicator that automatically identifies high-probability BUY and SELL opportunities using BOS and CHoCH analysis. Recommended Timeframes: For backtesting, use the indicator on   M5 or M15   for Gold (XAUUSD), and   M15 or H1   for more volatile Forex pairs such as   GBPUSD, USDJPY, EURGBP , and similar markets. CONTACT ME AFTER PURCHASE TO CLAIM YOUR FREE BONUSES! Prop Firm Sniper  is a professional market structure indicator designed t
DayTrader PRO DayTrader PRO — это передовой торговый индикатор, сочетающий фильтр Лагерра (Laguerre Filter) Джона Элерса с мощным движком автоматической оптимизации. Вместо использования фиксированных параметров индикатор автоматически подбирает оптимальные настройки на основе недавних рыночных условий, что позволяет адаптироваться к изменяющейся волатильности без необходимости ручной корректировки. Индикатор генерирует четкие сигналы на ПОКУПКУ и ПРОДАЖУ, а также адаптивные уровни Stop Loss и T
KURAMA GOLD SIGNAL PRO (MT4) — 7-уровневый фильтр · Автоматический TP/SL · Оценка качества · Сохранение истории сигналов | Полная торговая система для XAUUSD Без перерисовки в реальном времени. В момент появления сигнала стрелка, вход, TP и SL фиксируются на месте и больше никогда не смещаются. Вы торгуете именно этот сигнал в реальном времени. А в версии 7.20 каждый фактически отправленный сигнал автоматически сохраняется и точно восстанавливается после перезапуска. БОНУС ДЛ
Scalper Inside PRO помогает читать внутридневной тренд и планировать сделку до входа в рынок. Индикатор использует эксклюзивные встроенные алгоритмы для оценки направления рынка и расчёта ключевых целевых уровней в момент появления сигнала, поэтому вы всегда заранее видите потенциальный вход, стоп-лосс и цели по прибыли. Индикатор также показывает подробную статистику эффективности на исторических данных, чтобы вы могли увидеть, как вели себя разные инструменты и стратегии, и выбрать то, что под
Currency Strength Wizard — очень мощный индикатор, предоставляющий вам комплексное решение для успешной торговли. Индикатор рассчитывает силу той или иной форекс-пары, используя данные всех валют на нескольких тайм фреймах. Эти данные представлены в виде простых в использовании индексов валют и линий силы валют, которые вы можете использовать, чтобы увидеть силу той или иной валюты. Все, что вам нужно, это прикрепить индикатор к графику, на котором вы хотите торговать, и индикатор покажет вам ре
SR Liquidity — это торговый индикатор, предназначенный для выявления скрытых зон, где концентрируется рыночная ликвидность и наблюдается наиболее сильная реакция цены. Эти особые зоны ликвидности выступают в качестве мощных уровней поддержки и сопротивления, предоставляя вам четкую картину того, где с наибольшей вероятностью произойдет разворот рынка. Вместо построения стандартных линий поддержки и сопротивления, индикатор SR Liquidity анализирует реальное поведение цены, выявляя зоны концентрац
Представляем       Quantum Breakout PRO   , новаторский индикатор MQL5, который меняет ваш способ торговли в зонах прорыва! Разработанная командой опытных трейдеров с опытом торговли более 13 лет,   Quantum Breakout PRO   предназначена для того, чтобы вывести ваше торговое путешествие на новые высоты благодаря своей инновационной и динамичной стратегии зон прорыва. Quantum Breakout Indicator покажет вам сигнальные стрелки на зонах прорыва с 5 целевыми зонами прибыли и предложением стоп-лосса
Trend Catcher ind
Ramil Minniakhmetov
5 (11)
Trend Catcher   анализирует движения рыночных цен, используя комбинацию собственных и индивидуально разработанных адаптивных индикаторов анализа тренда. Он определяет истинное направление рынка, отфильтровывая краткосрочные шумы и фокусируясь на силе импульса, расширении волатильности и поведении ценовой структуры. Он также использует комбинацию сглаживающих и фильтрующих тренд индикаторов, таких как скользящие средние, RSI и фильтры волатильности. Мониторинг реальных операций, а также другие
Super Signal – Skyblade Edition Профессиональная система трендовых сигналов без перерисовки и без задержек с исключительным процентом выигрышей | Для MT4 / MT5 Лучше всего работает на младших таймфреймах, таких как 1 минута, 5 минут и 15 минут. Основные характеристики: Super Signal – Skyblade Edition — это интеллектуальная система сигналов, специально разработанная для трендовой торговли. Она использует многоуровневую фильтрацию, чтобы выявлять только сильные направленные движения, подкреплённ
Price & Time Market Structure Indicator A professional market structure tool that analyzes waves through both price and time — not price alone. Main Description NeoWave PRO is a professional market structure indicator for MetaTrader 4 designed for traders who want to move beyond traditional one-dimensional wave tools such as ZigZag, swing indicators, and basic high/low systems. Most wave indicators analyze only one thing: Price. But a real market wave is not only a price movement. A true wave de
Индикатор AW Candle Patterns является комбинацией из продвинутого трендового индикатора в сочетании с мощным сканером свечных паттернов. Это полезный инструмент для распознания и выделения тридцати наиболее надежных свечных паттернов. Помимо этого это анализатор текущего тренда по окрашенным барам с  подключаемой мультитаймфреймовой трендовой панелью, изменяемой по размеру и положению. Уникальная возможность регулировки отображения паттернов в зависимости от трендовой фильтрации.  Преимущества: 
Индикатор All-in-One Trade (AOTI) определяет дневные цели для пар EURUSD, EURJPY, GBPUSD, USDCHF, EURGBP, EURCAD, EURAUD, AUDJPY, GBPAUD, GBPCAD, GBPCHF, GBPJPY, AUDUSD и USDJPY. Все остальные модули работают на любых финансовых инструментах. Индикатор включает в себя множество функций: двойной канал для определения тренда, ценовой канал, полосы МА, построение уровней Фибо, определение точки кульминации и др. Индикатор создан для упрощения анализа рынка и основан на нескольких торговых стратегия
ECM Elite Channel is a volatility-based indicator, developed with a specific time algorithm, which consists of finding possible corrections in the market. This indicator shows two outer lines, an inner line (retracement line) and an arrow sign, where the channel theory is to help identify overbought and oversold conditions in the market. The market price will generally fall between the boundaries of the channel. If prices touch or move outside the channel, it's a trading opportunity. The ind
Этот продукт был обновлен для рынка 2026 года и оптимизирован для последних сборок MT5. УВЕДОМЛЕНИЕ ОБ ИЗМЕНЕНИИ ЦЕНЫ: Smart Trend Trading System сейчас доступен за $99 . Цена увеличится до $199 после следующих 30 покупок . СПЕЦИАЛЬНОЕ ПРЕДЛОЖЕНИЕ: После покупки Smart Trend Trading System отправьте мне личное сообщение, чтобы получить Smart Universal EA БЕСПЛАТНО и превратить сигналы Smart Trend в автоматические сделки. Smart Trend Trading System — это полноценная торговая система без перерисов
FX Power: Анализируйте силу валют для более эффективной торговли Обзор FX Power — это ваш незаменимый инструмент для понимания реальной силы валют и золота в любых рыночных условиях. Определяя сильные валюты для покупки и слабые для продажи, FX Power упрощает принятие торговых решений и выявляет высоковероятные возможности. Независимо от того, хотите ли вы следовать за трендами или предсказывать развороты с использованием экстремальных значений дельты, этот инструмент идеально адаптируется под
Scalper Vault — это профессиональная торговая система, которая дает вам все необходимое для успешного скальпинга. Этот индикатор представляет собой полную торговую систему, которую могут использовать трейдеры форекс и бинарных опционов. Рекомендуемый тайм фрейм М5. Система дает точные стрелочные сигналы в направлении тренда. Она также предоставляет вам сигналы выхода и рассчитывает рыночные уровни Ганна. Индикатор дает все типы оповещений, включая PUSH-уведомления. Пожалуйста, напишите мне после
BUY 1 and GET 1 FREE - Promotion! Buy Trend Reader Indicator with a huge –60% discount and GET 1 FREE EA by your choice! Promo Price: $117 (Regular Price: $297 — You Save $180! Don't Miss!) After purchase contact me to get your GIFT EA! You can also contact me to get the list of available GIFT EAs! Trend Reader Indicator is a revolutionary trading indicator designed to empower forex traders with the tools they need to make informed trading decisions. This cutting-edge indicator utilizes compl
Volatility Trend System - торговая система дающая сигналы для входов.  Система волатильности дает линейные и точечные сигналы в направлении тренда, а также сигналы выхода из него, без перерисовки и запаздываний. Трендовый индикатор следит за направлением среднесрочной тенденции, показывает направление и ее изменение. Сигнальный индикатор основан на изменении волатильности, показывает входы в рынок. Индикатор снабжен несколькими типами оповещений. Может применяться к различным торговым инструмен
Этот продукт был обновлен для рынка 2026 года и оптимизирован для последних сборок MT5. УВЕДОМЛЕНИЕ ОБ ИЗМЕНЕНИИ ЦЕНЫ: Atomic Analyst сейчас доступен за $99 . Цена увеличится до $199 после следующих 30 покупок . СПЕЦИАЛЬНОЕ ПРЕДЛОЖЕНИЕ: После покупки Atomic Analyst отправьте мне личное сообщение, чтобы получить Smart Universal EA БЕСПЛАТНО и превратить сигналы Atomic Analyst в автоматические сделки. Atomic Analyst — это индикатор Price Action без перерисовки, без перерисовывания истории и без
Color Trend FX – индикатор, отображающий на графике точные точки входа в сделку, точные точки выхода, максимально возможную прибыль в сделке (для тех, кто фиксирует прибыль по своей системе выхода из сделки), точки трейлинга открытых позиции, а также подробную статистику. Статистика сделок позволяет помочь с выбором наиболее прибыльных торговых инструментов, а также определить потенциальную прибыль. Индикатор не перерисовывает свои сигналы! Индикатор прост в настройке и управлении и подойдет для
Этот индикатор обеспечивает эффективный способ одновременно контролировать несколько валютных пар и таймфреймов. Отображая расхождения между ценой и MACD в наглядной и удобочитаемой таблице, он позволяет трейдерам определять потенциальные разворотные точки на рынке без постоянного переключения между графиками. Дивергенции могут указывать на изменение бычьего или медвежьего импульса. Например, медвежья дивергенция возникает, когда цена достигает нового максимума, но MACD не подтверждает его соотв
«„Naturu“ — это ручной индикатор, который использует симметрию природы в качестве алгоритма. Овладейте рынком с помощью простой стратегии и скрытой мудрости! При загрузке индикатора вы увидите две линии — Верхнюю (Top) и Нижнюю (Bottom). Нажмите на линию один раз, чтобы активировать её. Чтобы переместить её, просто кликните на ту свечу, куда хотите её поставить. Вы задаёте точку максимума и точку минимума, а индикатор автоматически рассчитывает: магентовую зону, показывающую, где интересы быков
Cycle Sniper
Elmira Memish
4.39 (36)
Please contact us after your purchase and we will send you the complimentary indicators to complete the system Cycle Sniper is not a holy grail but when you use it in a system which is explained in the videos, you will feel the difference. If you are not willing to focus on the charts designed with Cycle Sniper and other free tools we provide, we recommend not buying this indicator. We recommend watching the videos about the indiactor and system before purchasing. Videos, settings  and descri
Официальный доступ к экосистеме BlueDigitsFx Получайте обновления инфраструктуры, рабочие материалы, новые продукты и доступ к официальной экосистеме BlueDigitsFx. Экосистема Telegram Веб-сайт Версия MT5 BlueDigitsFx Easy 123 System — Мощная система определения разворотов и пробоев для MT4 Универсальная не перерисовывающаяся система для поиска разворотов и пробоев рынка — создана для трейдеров, которые ценят структуру, ясность и торговлю на основе подтверждений. BlueDigitsFx Easy 123 System —
M1 Arrow
Oleg Rodin
4.81 (21)
Индикатор M1 Arrow основан на естественных принципах торговли на рынке, включая анализ волатильности и объема. Индикатор можно использовать с любым таймфреймом и валютной парой. Один простой в использовании параметр индикатора позволит вам адаптировать сигналы к любой валютной паре и таймфрейму, на котором вы хотите торговать. Помимо основного алгоритма, основанного на сигналах на покупку и продажу, индикатор также имеет множество встроенных дополнительных стратегий, которые вы можете выбрать в
This Indicator only places quality trades when the market is really in your favor with a clear break and retest. Patience is key with this price action strategy! If you want more alert signals per day, you increase the number next to the parameter called: Support & Resistance Sensitivity.  After many months of hard work and dedication, we are extremely proud to present you our  Break and Retest price action indicator created from scratch. One of the most complex indicators that we made with over
Другие продукты этого автора
This script automatically calculates and updates ICT's daily IPDA look back time intervals and their respective discount / equilibrium / premium, so you don't have to :) IPDA stands for Interbank Price Delivery Algorithm. Said algorithm appears to be referencing the past 20, 40, and 60 days intervals as points of reference to define ranges and related PD arrays. Intraday traders can find most value in the 20 Day Look Back box, by observing imbalances and points of interest. Longer term traders c
This is addition of  Effective SV squeeze momentum  that add bolliger band and Keltner channel to chart window.  Squeeze momentum introduced by “John Carter”, the squeeze indicator for MT5 represents a volatility-based tool. Regardless, we can also consider the squeeze indicator as a momentum indicator, as many traders use it to identify the direction and strength of price moves. In fact, the Tradingview  squeeze indicator shows when a financial instrument is willing to change from a trending ma
FREE
This is a Forex Scalping Trading Sytem based on the Bollinger Bands.  Pairs:Major Time frame: 1M or higher. Spread max:0,0001.  Indicators (just suggestion) Bollinger bands (20, 2); ADX (14 period); RSI   (7 period ). Y ou should only trade this system between 2am to 5am EST, 8am to 12am EST and 7.30pm to 10pm EST. Do not scalp 30 minutes before a orange or red news  report and not for a hour afterwards.   Setup: is for price to move above the lower or lower Bollinger Bands, RSI raise above the
FREE
This indicator presents an alternative approach to identify Market Structure. The logic used is derived from learning material created by   DaveTeaches (on X) Upgrade v1.10: add option to put protected high/low value to buffer (figure 11, 12) When quantifying Market Structure, it is common to use fractal highs and lows to identify "significant" swing pivots. When price closes through these pivots, we may identify a Market Structure Shift (MSS) for reversals or a Break of Structure (BOS) for co
The Bheurekso Pattern Indicator for MT5 helps traders automatically identify candlestick pattern that formed on the chart base on some japanese candle pattern and other indicator to improve accurate. This indicator scans all candles, recognizes and then displays any candle patterns formed on the chart. The candle displayed can be Bullish or Bearish Engulfing, Bullish or Bearish Harami, and so on. There are some free version now but almost that is repaint and lack off alert function. With this ve
The Breaker Blocks with Signals indicator aims to highlight a complete methodology based on breaker blocks. Breakout signals between the price and breaker blocks are highlighted and premium/discount swing levels are included to provide potential take profit/stop loss levels. This script also includes alerts for each signal highlighted.   SETTINGS   Breaker Blocks Length: Sensitivity of the detected swings used to construct breaker blocks. Higher values will return longer term break
The liquidity swings indicator highlights swing areas with existent trading activity. The number of times price revisited a swing area is highlighted by a zone delimiting the swing areas. Additionally, the accumulated volume within swing areas is highlighted by labels on the chart. An option to filter out swing areas with volume/counts not reaching a user-set threshold is also included. This indicator by its very nature is not real-time and is meant for descriptive analysis alongside other com
Multiple Wicks forming at OverSold & OverBought levels create Buying and Selling Pressure. This indicator tries to capture the essence of the buy and sell pressure created by those wicks. Wick pressure shows that the trend is Exhausted. Order block should display when buying or selling pressure wick. When price go inside buy order block and up to outside order block, trader should consider a buy order. If price go inside buy order block and down to outside order block, trader should consider a s
OVERVIEW K-means is a clustering algorithm commonly used in machine learning to group data points into distinct clusters based on their similarities. While K-means is not typically used directly for identifying support and resistance levels in financial markets, it can serve as a tool in a broader analysis approach. Support and resistance levels are price levels in financial markets where the price tends to react or reverse. Support is a level where the price tends to stop falling and m
All about Smart Money Concepts Strategy: Market struture: internal or swing BOS, CHoCH; Orderblock; Liquity equal; Fair Value Gap with Consequent encroachment, Balanced price range; Level with Previous month, week, day level or in day level (PMH, PWH, PDH, HOD); BuySell Stops Liquidity (BSL, SSL); Liquidity Void Long Wicks; Premium and Discount; Candle pattern ... "Smart Money Concepts" ( SMC ) is a fairly new yet widely used term amongst price action traders looking to more accurately navigate
The indicator   returning pivot point based trendlines with highlighted breakouts . Trendline caculated by pivot point and other clue are ATR, Stdev.   The indicator also includes integrated alerts for  trendlines  breakouts   and foward message to Telegram channel or group if you want. Settings ·            Lookback bar: Default 200 is number of bar caculate when init indicator. ·            Length:  Pivot points  period ·            Slope Calculation Method: Determines how this lope is calcula
This all-in-one indicator displays real-time market structure (internal & swing BOS / CHoCH), order blocks, premium & discount zones, equal highs & lows, and much more...allowing traders to automatically mark up their charts with widely used price action methodologies. Following the release of our Fair Value Gap script, we received numerous requests from our community to release more features in the same category. //------------------------------------// Version 1.x has missing functions + PDAr
The Breaker Blocks with Signals indicator aims to highlight a complete methodology based on breaker blocks. Breakout signals between the price and breaker blocks are highlighted and premium/discount swing levels are included to provide potential take profit/stop loss levels. This script also includes alerts for each signal highlighted.   SETTINGS   Breaker Blocks Length: Sensitivity of the detected swings used to construct breaker blocks. Higher values will return longer term break
The ICT Concepts indicator regroups core concepts highlighted by trader and educator "The Inner Circle Trader" (ICT) into an all-in-one toolkit. Features include Market Structure (MSS & BOS), Order Blocks, Imbalances, Buyside/Sellside Liquidity, Displacements, ICT Killzones, and New Week/Day Opening Gaps. It’s one kind of Smart money concepts.   USAGE:   Please read this   document  !      DETAILS Market Structure Market structure labels are constructed from price breaking a prior extreme
The FollowLine indicator is a trend following indicator. The blue/red lines are activated when the price closes above the upper Bollinger band or below the lower one. Once the trigger of the trend direction is made, the FollowLine will be placed at High or Low (depending of the trend). An ATR filter can be selected to place the line at a more distance level than the normal mode settled at candles Highs/Lows. Some features: + Trend detech + Reversal signal + Alert teminar / mobile app
The ICT Silver Bullet indicator is inspired from the lectures of "The Inner Circle Trader" (ICT) and highlights the Silver Bullet (SB) window which is a specific 1-hour interval where a Fair Value Gap (FVG) pattern can be formed. A detail document about ICT Silver Bullet here . There are 3 different Silver Bullet windows (New York local time): The London Open Silver Bullet (3 AM — 4 AM ~ 03:00 — 04:00) The AM Session Silver Bullet (10 AM — 11 AM ~ 10:00 — 11:00) The PM Session Silver Bullet (2
This indicator shows when user set sessions are active and returns various tools + metrics using the closing price within active sessions as an input. Users have the option to change up to 4 session times. The indicator will increasingly lack accuracy when the chart timeframe is higher than 1 hour. Settings Sessions Enable Session: Allows to enable or disable all associated elements with a specific user set session. Session Time: Opening and closing times of the user set session in the  
The liquidity swings indicator highlights swing areas with existent trading activity. The number of times price revisited a swing area is highlighted by a zone delimiting the swing areas. Additionally, the accumulated volume within swing areas is highlighted by labels on the chart. An option to filter out swing areas with volume/counts not reaching a user-set threshold is also included. This indicator by its very nature is not real-time and is meant for descriptive analysis alongside other com
The SuperTrend AI indicator is a novel take on bridging the gap between the K-means clustering machine learning method & technical indicators. In this case, we apply K-Means clustering to the famous SuperTrend indicator.   USAGE Users can interpret the SuperTrend AI trailing stop similarly to the regular SuperTrend indicator. Using higher minimum/maximum factors will return longer-term signals. (image 1) The displayed performance metrics displayed on each signal allow for a deeper interpretat
OVERVIEW A Lorentzian Distance Classifier (LDC) is a Machine Learning classification algorithm capable of categorizing historical data from a multi-dimensional feature space. This indicator demonstrates how Lorentzian Classification can also be used to predict the direction of future price movements when used as the distance metric for a novel implementation of an Approximate Nearest Neighbors (ANN) algorithm. This indicator provide signal as buffer, so very easy for create EA from this indi
An Implied Fair Value Gap (IFVG) is a three candles imbalance formation conceptualized by ICT that is based on detecting a larger candle body & then measuring the average between the two adjacent candle shadows. This indicator automatically detects this imbalance formation on your charts and can be extended by a user set number of bars. The IFVG average can also be extended until a new respective IFVG is detected, serving as a support/resistance line. Alerts for the detection of bullish/be
Consolidation is when price is moving inside a clear trading range. When prices are consolidated it shows the market maker placing orders on both sides of the market. This is mainly due to manipulate the un informed money. This indicator automatically identifies consolidation zones and plots them on the chart. The method of determining consolidation zones is based on pivot points and ATR, ensuring precise identification. The indicator also sends alert notifications to users when a new consolida
This indicator provides the ability to recognize the SMC pattern, essentially a condensed version of the Wyckoff model. Once the pattern is confirmed by RTO, it represents a significant investment opportunity.    There are numerous indicators related to SMC beyond the market, but this is the first indicator to leverage patterns to identify specific actions of BigBoy to  navigate the market. Upgrade 2024-03-08: Add TP by RR feature. The SMC (Smart Money Concept)   pattern   is a market analysis m
Created by imjesstwoone and mickey1984, this trade model attempts to capture the expansion from the 10:00-14:00 EST 4h candle using just 3 simple steps. All of the information presented in this description has been outlined by its creators, all I did was translate it to MQL4. All core settings of the trade model may be edited so that users can test several variations, however this description will cover its default, intended behavior using NQ 5m as an example. Step 1 is to identify our Price Ra
The Buyside & Sellside Liquidity indicator aims to detect & highlight the first and arguably most important concept within the ICT trading methodology,   Liquidity   levels. SETTINGS Liquidity Levels Detection Length: Lookback period Margin: Sets margin/sensitivity for a liquidity level detection Liquidity Zones Buyside Liquidity Zones: Enables display of the buyside liquidity zones. Margin: Sets margin/sensitivity for the liquidity zone boundaries. Color: Color option for buysid
The   Liquidation Estimates (Real-Time)   experimental indicator attempts to highlight real-time long and short liquidations on all timeframes. Here with liquidations, we refer to the process of forcibly closing a trader's position in the market. By analyzing liquidation data, traders can gauge market sentiment, identify potential support and resistance levels, identify potential trend reversals, and make informed decisions about entry and exit points. USAGE (Img 1)    Liquidation refers
The   ICT Unicorn Model   indicator highlights the presence of "unicorn" patterns on the user's chart which is derived from the lectures of   "The Inner Circle Trader" (ICT) . Detected patterns are followed by targets with a distance controlled by the user.   USAGE (image 2) At its core, the ICT Unicorn Model relies on two popular concepts, Fair Value Gaps and Breaker Blocks. This combination highlights a future area of support/resistance. A   Bullish Unicorn Pattern   consists out of:
The Inversion Fair Value Gaps (IFVG) indicator is based on the inversion FVG concept by ICT and provides support and resistance zones based on mitigated Fair Value Gaps (FVGs). Image 1   USAGE Once mitigation of an FVG occurs, we detect the zone as an "Inverted FVG". This would now be looked upon for potential support or resistance. Mitigation occurs when the price closes above or below the FVG area in the opposite direction of its bias. (Image 2) Inverted Bullish FVGs Turn into Potenti
Overview The   Volume SuperTrend AI   is an advanced technical indicator used to predict trends in price movements by utilizing a combination of traditional SuperTrend calculation and AI techniques, particularly the k-nearest neighbors (KNN) algorithm. The Volume SuperTrend AI is designed to provide traders with insights into potential market trends, using both volume-weighted moving averages (VWMA) and the k-nearest neighbors (KNN) algorithm. By combining these approaches, the indicator
Introducing the Reversal and Breakout Signals   This innovative tool is crafted to enhance your chart analysis by identifying potential reversal and breakout opportunities directly on your charts. It's designed with both novice and experienced traders in mind, providing intuitive visual cues for better decision-making. Let's dive into the key features and how it operates: ###   Key Features:   Dynamic Period Settings:   Customize the sensitivity of the indicator with user-def
Фильтр:
Нет отзывов
Ответ на отзыв