SMC Inducement MT4

SMC Inducement — The Trap Before the Entry, Marked While It Still Matters

An inducement scanner that shows you the liquidity price has to take before the zone is worth trading — and keeps score of every setup it ever found on your chart.

The pullback you are looking at is usually the bait

Structure breaks. A clean order block is left behind. You mark it, price comes back, you enter at the top of the zone — and price runs twenty pips past your stop before turning around and going exactly where you thought it would.

Nothing was wrong with your zone. What was wrong was the timing. Between the pullback low and the break of structure there is almost always a small, obvious low sitting in plain sight, and every trader watching that chart has an order under it. That low is not support. It is fuel. Price is going to take it, and only then is the zone behind it worth anything.

Most structure indicators never draw that low. They mark the order block, extend it forward, and leave you to guess whether the tap you are watching is the real one or the one that exists purely to collect your stop.

SMC Inducement draws it. The structure, the break, the inducement, the zone and the levels are all marked as one object, the entry is only recognised after the inducement has actually been taken, and a panel in the corner tallies every setup on the chart in front of you — your symbol, your broker's history, your settings.

What it draws, and how to read it

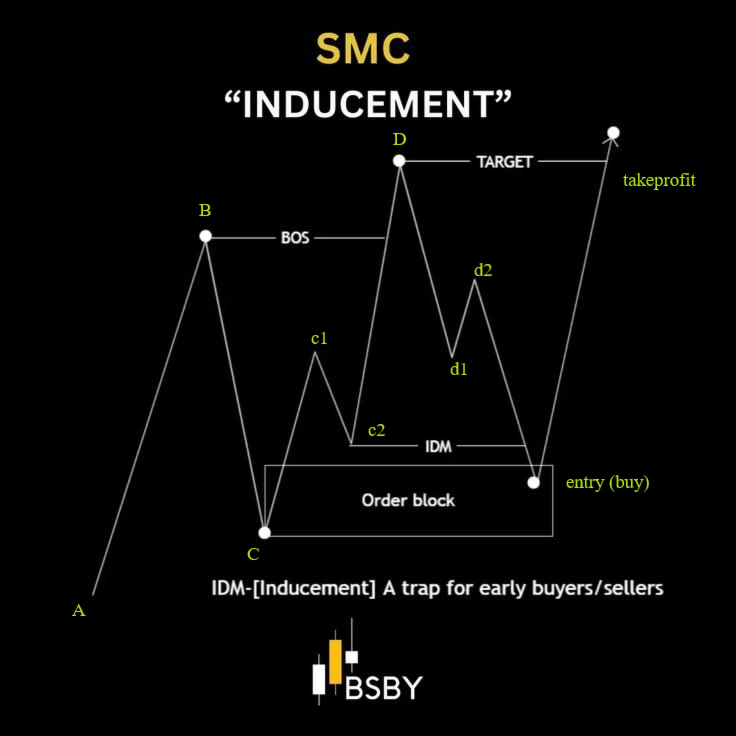
The indicator marks the pattern in both directions. Uppercase labels come from the main structure; lowercase labels come from a second, finer swing scale that exists purely to expose the small moves inside it.

Reading a bullish setup left to right:

Label What it is
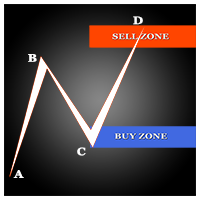
A the low the leg starts from
B the structure high that is going to be broken
C the pullback low that holds the order block
c1 the minor high inside the leg away from C
c2 the minor low after it — this is the inducement
BOS the horizontal line from B to the bar that broke it
D the new high after the break — the TARGET line
d1 / d2 the minor low and high that shape the retracement from D
entry price sweeps c2, taps the order block at C, and the levels appear

A bearish setup is the exact mirror, top to bottom.

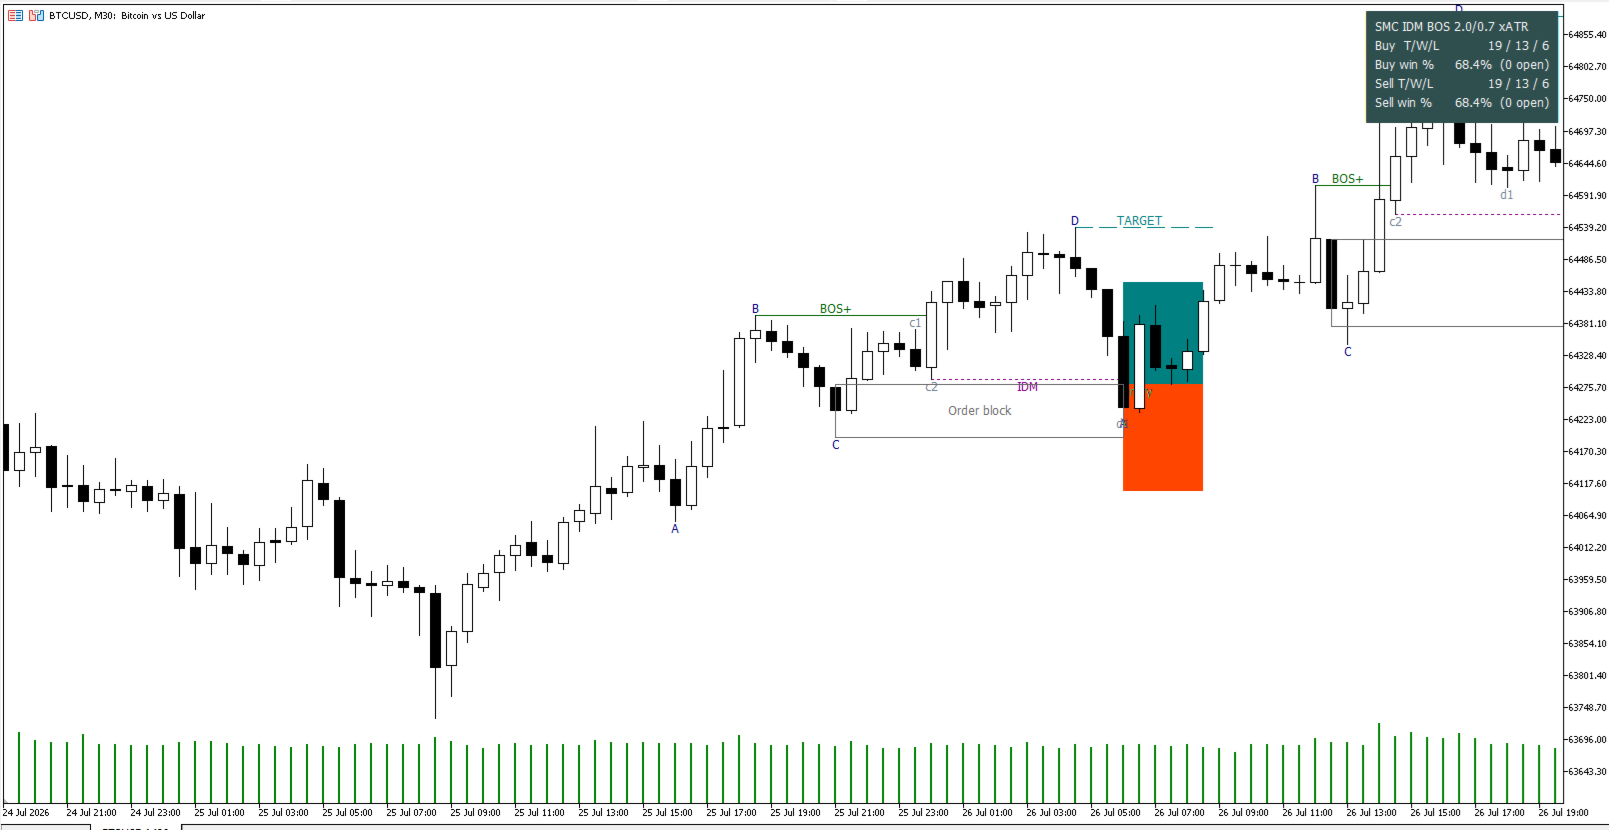
The chart tells this story in three stages.

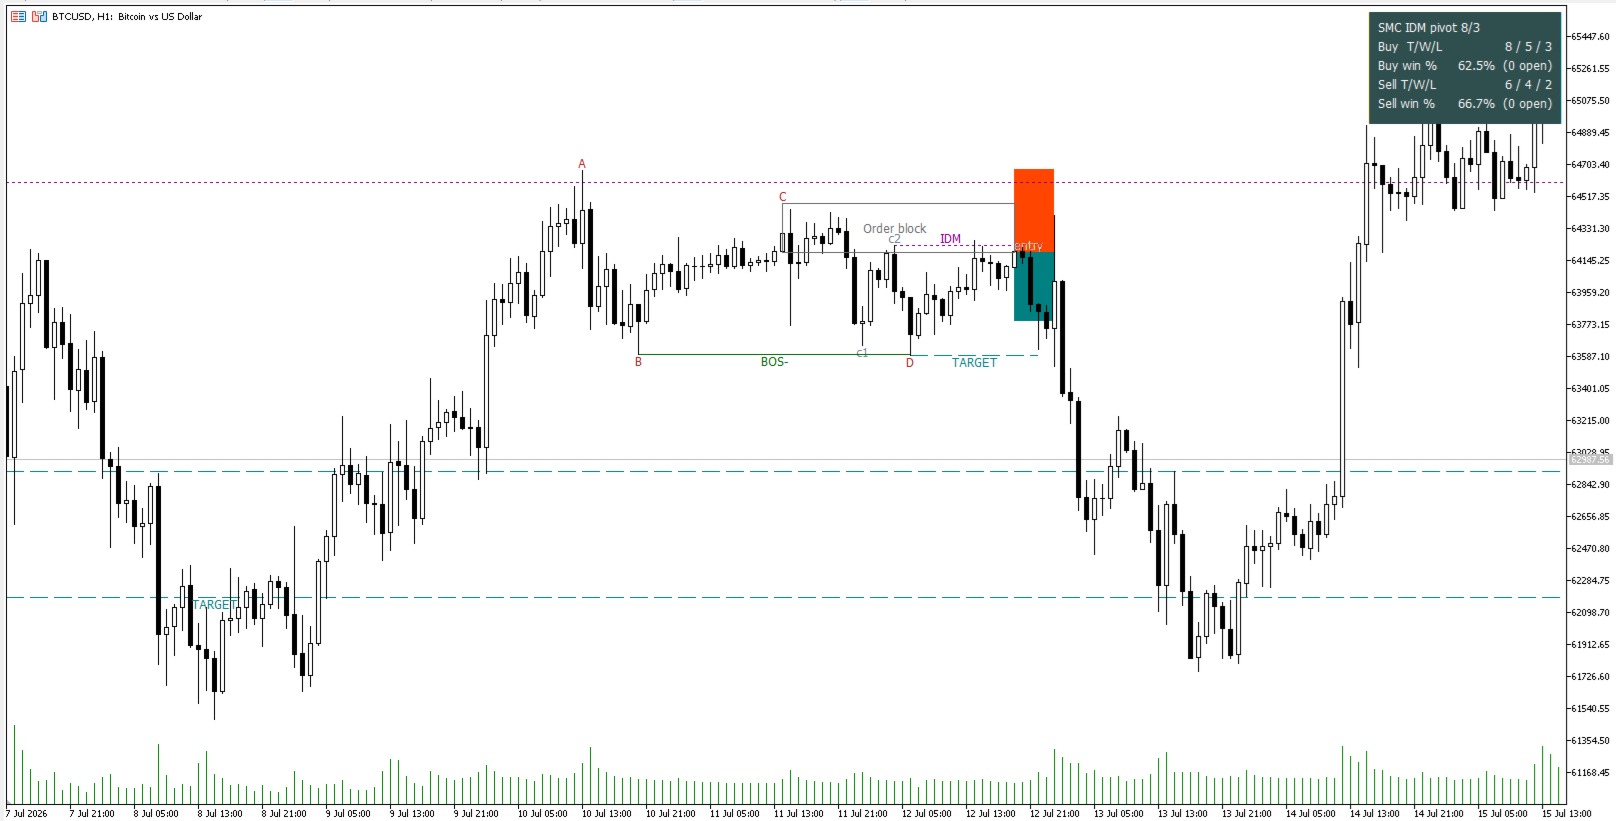
Stage one — the structure appears. As soon as the swing at D is confirmed, the whole picture is drawn at once: the labels, the BOS line marking where structure actually broke, the dotted IDM line running forward from the inducement, the dashed TARGET line at D, and the order block at C boxed and extended to the right in the "waiting" colour. Nothing has happened yet, and the chart says so.

Stage two — price comes back. When price returns, takes the inducement, and trades into the block while the block is still alive, the entry label is placed at the near edge of the zone and two boxes are drawn from it — one to the stop loss, one to the take profit. The zone box stops at the entry bar and changes colour. If price never comes back, the pattern stays at stage one forever; no entry is invented to make the picture look complete.

Stage three — the retracement fills in. The minor points d1 and d2 are added once the pullback has shaped them, and d2 is only labelled while it stays inside D. If the retracement does not have that shape, the labels are simply left off rather than forced on.

The visual language stays small on purpose: labels for structure, three horizontal levels, one box for the zone, two boxes for risk and reward. No arrows, no clouds, no repainted candles.

The inducement is the entry condition, not a decoration

Drawing the trap is the easy half. The half that changes results is refusing to call anything an entry until the trap has been sprung.

By default the indicator requires the inducement to be taken first. Price reaching the zone without having swept c2 is not an entry — it is price arriving early, which is exactly the sequence that produces the stop-hunt you have been eating. Both halves of the rule are switchable: you can require an inducement to exist at all before a pattern is accepted, and you can require it to be swept before an entry is recognised. Turn both off and you get the plain order-block behaviour, which makes the difference easy to measure on the statistics panel.

The inducement also has to be a genuine one. A minor low that sits below C is not a pullback inside the leg — it is a break of it, and the pattern is rejected rather than stretched to fit.

Two detection engines. Switch between them with one dropdown.

There is no universally correct way to decide what counts as a swing, and that choice changes everything downstream. So the indicator ships with two independent structure engines and one parameter to select between them.

Engine 1 — bar-based. A swing must stand clear of a fixed number of bars on each side. Familiar, predictable, easy to reason about. Its weakness is that it measures structure in bars: the same market move is recognised when it develops slowly and missed when it develops quickly. In this engine the break of B is judged by price alone.

Engine 2 — volatility-based (default). A swing is confirmed when price retraces against it by a configurable multiple of current market volatility. Nothing is measured in bars, so one setting travels between a fast metal and a slow currency pair without re-tuning. This engine also validates the structure differently and more strictly:

  • The break of B must be a genuine close beyond it, recorded before D forms. A long wick through the high that closes back underneath is not a break — and a large class of false structures disappears with it.
  • The chain is explicitly invalidated: if price closes beyond A before D is reached, the whole setup is discarded instead of being counted.

Both engines feed the identical downstream logic — same inducement rule, same order block, same entry, same levels, same statistics. That is the entire point. Flipping the dropdown changes only how structure is read, so the panel gives you a like-for-like comparison of the two engines on your own instrument. Most users find one clearly suits their market better than the other, and now they can prove which.

Each engine carries its own sensitivity for the major structure and for the minor swings that expose the inducement, so you can read big structure while still seeing the small low inside it.

Zones that know when they are dead

An order block is liquidity, and liquidity only matters while price has not traded through it.

Every zone here is an object with a lifetime. It stays valid until a candle closes beyond it — never merely wicks beyond it. A wick that pierces the zone and closes back inside leaves the block alive, which is exactly right: reaching for liquidity and failing to hold there is a signal, not an invalidation.

When a zone dies it is not faded or left as decoration. If the block was invalidated before it ever produced an entry, the whole pattern is discarded — off the chart and out of the statistics. Setups that never became tradeable do not get to flatter the numbers.

The same discipline applies to the levels. The stop is pushed outside the zone, away from the entry, so the position has room to breathe. The target is pulled inside D, towards the entry, so profit is taken before price is required to break the prior extreme. Both offsets are calibrated to market volatility at the entry bar, and both are configurable. If the geometry leaves no room between entry and target, the setup is dropped rather than reported as a trade that won at the moment it opened.

The statistics panel — verify the idea on your own chart

A compact panel sits in the corner and shows, separately for buys and sells:

  • Total / Won / Lost — every pattern that actually produced an entry
  • Win rate

Two things matter more than the numbers themselves.

They are computed on your chart. Your symbol, your broker's history, your timeframe, your settings. Change the engine, change the swing sensitivity, switch the inducement requirement off and on, move the stop and target multiples — the panel recalculates. You are not being asked to believe someone else's screenshot.

They are deliberately conservative. A pattern only counts once price returned and an entry existed. A bar that touches both the stop and the target is recorded as a loss, because the indicator cannot know which came first and the pessimistic reading is the honest one. Patterns whose zone died before an entry are removed from the sample entirely rather than counted as losses avoided.

Read the panel for what it is: a fast, close-only historical tally that ignores spread, commission, slippage and execution quality. It is a research tool for comparing settings against each other — not a broker statement.

Keep the chart to what is still tradeable

History is useful for judging the concept and terrible for trading in front of. One switch — Draw only the newest pattern plus every waiting one — reduces the chart to the setups you can still act on: the most recent structure in each direction, plus every pattern whose zone is alive and still waiting for price.

The statistics do not change. The filter affects drawing only; the panel keeps scoring the full history behind it. You get a clean chart and an honest sample at the same time, which is normally a trade-off you are forced to make.

Alerts that respect your attention

Two alert modes, selectable:

Touch — fires the moment price trades into the zone, evaluated on every tick. Use this when you want to be at the chart while the zone is being tested.

Bar close — fires only when a bar closes, and only if that bar reached into the zone without closing beyond it. A wick through the block that closes back inside still qualifies. This is the filtered mode: it stays quiet when price is slicing straight through and speaks when the zone actually produced a reaction.

In both modes the alert follows the setup that is still waiting, not one that has already played out, and where the inducement rule is active the alert waits for the sweep as well. At most one alert per bar per direction. Loading the indicator, switching timeframes or restarting the terminal never replays historical signals — the first calculation pass runs silently by design. Delivery can be a terminal pop-up, a mobile push notification, e-mail, or Telegram.

Symbols, timeframes and presentation

Any symbol, any timeframe. No hard-coded instrument, no hard-coded session. With the volatility-based engine there is no bar-count parameter to re-tune when you change market.

Attach it to the chart you want to read. The indicator does not quietly pull other timeframes behind your back; everything you see is computed from the chart it is on. Want higher-timeframe context? Attach a second copy to a higher-timeframe chart — object names are made unique automatically, so instances never collide.

Light and Dark themes built in. Pick the preset that matches your chart and every colour is set for you, including a statistics panel deliberately styled to contrast with your background so it stays readable, and sized from the text it holds so nothing is ever clipped. Prefer your own palette? Switch the theme to Custom and every colour becomes editable.

What to expect — honest talk

This is an analysis tool, not a trading system. It marks structure, the inducement, the zone and the levels. It does not open, modify or close orders, and it makes no claim about what you should do with the information.

Not every pattern produces a trade. Price frequently never comes back, or comes back without ever taking the inducement. That is normal, and it is visible: those patterns stay at stage one instead of being quietly converted into signals.

The structure appears after its final swing is confirmed, not at the exact high or low. Every honest structure reading has this delay — a swing is not a swing until price has moved away from it. What the indicator guarantees is that it never looks into the future: the entry is only ever searched for on bars after the pattern became visible, so what you see on history is what you would have seen live.

Settings matter, and the right ones depend on your market. Swing sensitivity is the parameter that moves results the most, and the minor sensitivity decides whether the inducement you see is the one you meant. Loosen them and you catch only large structures; tighten them and you catch many more, with more noise. Use the panel to find the balance on your instrument instead of assuming the defaults are optimal for you.

Past performance does not guarantee future results. The panel describes what happened on historical data under simplified assumptions. It is not a forecast and it is not investment advice.

Run it on a demo chart for a couple of weeks before you rely on it. Watch how the zones and the sweeps behave on your symbol. That is the only test that counts.

Quick setup

  1. Attach SMC Inducement to the chart you want to read — any symbol, any timeframe.
  2. Pick your Colour theme: Light for a white background, Dark for a dark one.
  3. Leave Detection method on the default volatility-based engine to start.
  4. Watch the panel and adjust the major swing threshold until the number of patterns on your chart looks reasonable, then the minor threshold until the inducement lands where your eye says it should.
  5. Turn on Draw only the newest pattern plus every waiting one once you are done exploring history.
  6. Set Alert mode and Alert channel if you want to be told when price reaches a zone.

Main parameters

Parameter Default Description
Detection method Volatility-based Which structure engine is active. Switch to compare the two.
Major swing threshold 2.0 Volatility multiple a retracement must reach to confirm a main swing. The primary sensitivity control.
Minor swing threshold 0.7 Same idea for the finer scale that exposes the inducement.
Major / minor pivot length 8 / 3 Bars required each side of a swing — used only by the bar-based engine.
An inducement is required On Reject structures that never left a trap behind.
Entry only after the sweep On The inducement must be taken before a tap into the zone counts.
Detect BUY / SELL patterns On / On Enable each direction independently.
Patterns drawn per direction 3 How many recent patterns stay on the chart.
Draw only newest + waiting Off Chart shows only what is still actionable. Statistics still cover the full history.
Bars to calculate 3000 History depth. Raise it for a larger statistical sample.
Stop loss offset 1.0 How far outside the zone the stop sits, in volatility multiples.
Take profit offset 1.0 How far inside the target extreme the take profit sits, in volatility multiples.
Points may be non-adjacent Off Allows minor swings to sit inside the structure. Turn on to detect more patterns.
Colour theme Light Light, Dark, or Custom.
Alert mode On bar close Off, on touch, or on bar close.
Alert channel Terminal alert Terminal, mobile push, e-mail, or Telegram.
Object name tag (auto) Leave empty for automatic uniqueness across multiple instances.

Everything else is presentation: fonts, individual colours, panel position and offsets.

Prodotti consigliati
Indicator for binary options arrow is easy to use and does not require configuration works on all currency pairs, cryptocurrencies buy signal blue up arrow sell signal red down arrow tips do not trade during news and 15-30 minutes before their release, as the market is too volatile and there is a lot of noise it is worth entering trades one or two candles from the current period (recommended for 1 candle) timeframe up to m 15 recommended money management fixed lot or fixed percentage of the depo
Market Session Pro MT4
Kambiz Shahriarynasab
5 (1)
The  Market Sessions Indicator for MT5 helps you  predict market turnarounds  by detecting major supply and demand areas. These pivot points tend to occur after a new session has started and the previous one is still open. It is also used to gauge how many points or pips the market moves on average during a session. This helps us to place better our take profits and stop losses. The indicator works on all forex pairs, gold, silver, commodities, stocks, indices and any other instrument that your
Advanced Stochastic Scalper
Evgeny Belyaev
4.56 (16)
Advanced Stochastic Scalper - is a professional indicator based on the popular Stochastic Oscillator. Advanced Stochastic Scalper is an oscillator with dynamic overbought and oversold levels, while in the standard Stochastic Oscillator, these levels are static and do not change. This allows Advanced Stochastic Scalper to adapt to the ever-changing market. When a buy or a sell signal appears, an arrow is drawn on the chart and an alert is triggered allowing you to open a position in a timely mann
Exclusive Bollinger
Evgeny Belyaev
4.2 (5)
Exclusive Bollinger is a professional indicator based on the popular Bollinger Bands indicator and provided with an advanced algorithm. Unlike the standard Bollinger , my Exclusive Bollinger provides better signals and is equipped with flexible settings allowing traders to adjust this indicator to their trading style. In the indicator, you can set up alerts (alert, email, push), so that you won't miss a single trading signal. Exclusive Bollinger  for the MetaTrader 5 terminal :  https://www.mql5
VR Cub
Vladimir Pastushak
VR Cub è un indicatore per ottenere punti di ingresso di alta qualità. L'indicatore è stato sviluppato per facilitare i calcoli matematici e semplificare la ricerca dei punti di ingresso in una posizione. La strategia di trading per la quale è stato scritto l'indicatore ha dimostrato la sua efficacia per molti anni. La semplicità della strategia di trading è il suo grande vantaggio, che consente anche ai trader alle prime armi di commerciare con successo con essa. VR Cub calcola i punti di apert
"Dynamic Scalping Oscillator" - è un indicatore Crypto_Forex personalizzato avanzato - uno strumento di trading efficiente per MT4! - Nuova generazione di oscillatori - guarda le immagini per vedere come usarlo. - L'oscillatore Dynamic Scalping ha zone di ipervenduto/ipercomprato adattive. - L'oscillatore è uno strumento ausiliario per trovare punti di ingresso esatti dalle aree dinamiche di ipervenduto/ipercomprato. - Valori di ipervenduto: sotto la linea verde, valori di ipercomprato: sopra l
Buy and sell zones
Evgeniy Zhdan
5 (2)
Indicator for determining flat and trend. If the price is below any of the two histograms and two lines (red and blue), this is a sell zone. When purchasing this version of the indicator, MT5 version for one real and one demo account - as a gift (to receive, write me a private message)! If the price is above any of the two histograms and two lines (red and blue), this is a buy zone. MT5 version:  https://www.mql5.com/en/market/product/70409 If the price is between two lines or in the zone of
TPA True Price Action indicator reveals the true price action of the market makers through 100% non-repainting signals (except early signals mode) strictly at the close of a candle! TPA shows entries and re-entries, every time the bulls are definitely stronger than the bears and vice versa. Not to confuse with red/green candles. The shift of power gets confirmed at the earliest stage and is ONE exit strategy of several. There are available now two free parts of the TPA User Guide for our custom
GeoWprPro
Georgij Komarov
WPR by Profile, or WPR for Professionals Geo_WprPro is one of the well-known currency profile indicators. It simultaneously displays two WPR indicators with different parameters in the matrix form on all timeframes of multiple currency pairs forming the currency profile . As follows from the description, " WPR is a leading indicator that often goes ahead of the price chart. The oscillator frequently reaches extreme values before the price reversal as if anticipating that event: it almost always
EZZ Zig Zag MT4
Paulo Rocha
5 (1)
EZZ Elite Zig Zag is an indicator for the MetaTrader 4 terminal. This indicator traces the peak of the trend based on the market reversal, thus showing various opportunities in the financial market. EZZ Elite Zig Zag is a visual tool, intuitive, and easy to understand and use.  Test it Yourself by Downloading it for Free. Author Paulo Rocha all rights reserved
PZ Mean Reversion MT4
PZ TRADING SLU
3 (4)
Indicatore unico che implementa un approccio professionale e quantitativo al trading di reversione. Sfrutta il fatto che il prezzo devia e ritorna alla media in modo prevedibile e misurabile, il che consente regole di entrata e uscita chiare che superano di gran lunga le strategie di trading non quantitative. [ Installation Guide | Update Guide | Troubleshooting | FAQ | All Products ] Segnali di trading chiari Incredibilmente facile da scambiare Colori e dimensioni personalizzabili Implementa l
Quantum Falcon Signal Free is a smart visual trading indicator for MetaTrader 4 designed for Forex and Gold traders. The indicator combines: • Trend analysis • RSI momentum confirmation • MACD momentum filtering • ATR volatility filtering • Higher timeframe confirmation • Smart exit signal detection Main Features: • Smart Buy and Sell signals • Exit Buy / Exit Sell alerts • Real-time dashboard on chart • Professional candle arrows • Multi-timeframe trend confirmation • ATR market volatility filt
FREE
Binary Options Support Resistance Indicator This indicator is designed for binary options trading and effectively shows retracements from support and resistance levels. Signals appear on the current candle. A red arrow pointing downwards indicates a potential selling opportunity, while a blue arrow pointing upwards suggests buying opportunities. All that needs adjustment is the color of the signal arrows. It is recommended to use it on the M1-M5 timeframes as signals are frequent on these timef
Scalping dynamic system - a dynamic system for determining price reversals. The indicator looks for price reversal points on the chart and puts arrows in these places. When the indicator draws a blue arrow, there is a high probability that the price will reverse up. When the indicator draws a red arrow, there is a high probability that the price will reverse down. The use of this indicator in the trading process is very simple. In the video below the description, we will show in detail how to t
EARLY REMINDER: The Starting price is 65 price will rise soon up to 365$ and then 750$ after first 10 copies of sales. Grab this offer now! Introduction Hello, traders! Welcome to the demonstration of the Forex Beast Indicator , a comprehensive tool designed to assist aspiring traders in navigating the complexities of the forex market. This indicator incorporates seven essential components to provide a well-rounded trading experience: Moving Averages Colored Zones Support and Resistance Levels
The  Market Sessions Indicator for MT5 helps you  predict market turnarounds  by detecting major supply and demand areas. These pivot points tend to occur after a new session has started and the previous one is still open. It is also used to gauge how many points or pips the market moves on average during a session. This helps us to place better our take profits and stop losses. The indicator works on all forex pairs, gold, silver, commodities, stocks, indices and any other instrument that you
SuperTrend Alerts
Libertas LLC
3 (4)
SuperTrend Alerts adds alerts to the widely popular SuperTrend indicator. As the name suggests, SuperTrend is a trending indicator which works best in trendy (not choppy) markets. SuperTrend is extremely popular for intraday and daily trading, and can be used on any timeframe. Place a call when the price closes above the SuperTrend line, and place a put when the price closes below the SuperTrend line. These crossovers are highlighted by non-repainting up/down arrows. Alerts Email, message and s
TrendWavePattern  an another way to trade with a harmonic pattern, a maestro classic pattern . I made some improvements and combinations with my own strategy. Trend direction, buy-sell signal ,hi-low area and pivot line. These will be helpful for trader to read the current market condition. So it is not blindly following the pattern itself but also following other informations from the market. Readable chart appearance . Designed to be user friendly even you are a new trader. BUY-SELL zone, Tak
Ugenesys AI MT4
Odaine Ramon Mcmillan
5 (1)
uGenesys AI - 90% Accurate Daytrading Indicator Introducing the ultimate forex trading indicator system, uGenesys AI, powered by cutting-edge AI technology and advanced analytical techniques, including Time-Series Analysis and Genetic Algorithms. Our AI-powered trading system leverages the power of time-series analysis to identify trends and patterns in historical price data, allowing traders to make informed predictions about future market movements. By analyzing vast amounts of data, our syst
Your Good Friends — this is not just an indicator, but your reliable trading assistant, designed for traders who value simplicity, clarity, and stability. It combines the best classic methods of technical analysis — support and resistance levels, reversal signals, visual cues — and presents them in the clearest, most user-friendly format possible. Suitable for both beginners and experienced traders — especially those who want to eliminate chaos, reduce stress, and trade based on clear signals.
Indicatore Crypto_Forex "Stocastico con zone dinamiche di ipervenduto/ipercomprato" per MT4, senza ridisegno. - L'oscillatore stocastico è uno degli indicatori più famosi sul mercato, uno strumento di trading perfetto per molti trader. - È ottimo per le posizioni di vendita dalla zona dinamica di ipercomprato e per le posizioni di acquisto dalla zona dinamica di ipervenduto. - Questo indicatore è eccellente anche da combinare con le posizioni di Price Action. - Zona dinamica di ipercomprato - s
Great Strong System   indicator is designed for signal trading. This indicator generates trend signals. It uses many algorithms and indicators to generate this signal. It tries to generate a signal from the points with the highest trend potential. This indicator is a complete trading product. This indicator does not need any additional indicators. The indicator certainly does not repaint. The point at which the signal is given does not change.     Features and Suggestions Time Frame: H1 Wo
Gioteen Volatility Index (GVI)   - your ultimate solution to overcoming market unpredictability and maximizing trading opportunities. This revolutionary indicator helps you in lowering your losing trades due to choppy market movements. The GVI is designed to measure market volatility, providing you with valuable insights to identify the most favorable trading prospects. Its intuitive interface consists of a dynamic red line representing the volatility index, accompanied by blue line that indicat
SystemBinaryM1
Andrey Spiridonov
SystemBinaryM1 - a professional indicator for trading short-term binary options, is a complete, self-contained author's strategy for working in the binary options market. The unique algorithm for analyzing the foreign exchange market is based on the calculation of reference points on three different time periods M15, M5. M1. Thus, the indicator simultaneously analyzes the long-term, medium-term and short-term price behavior before issuing a signal. The indicator is set in the usual way and work
Over Arrow
Svyatoslav Kucher
Over Arrow  - уникальный авторский индикатор, имеющий возможность отображения сигналов в направлении основной тенденции, или против нее. Over Arrow  подходит для любого таймфрейма, валютной пары, но лучше всего использовать его на средних временных периодах, таких как М30, Н1, Н4. Сигналы индикатора не пропадают ни при каких условиях. Отличительной особенностью является наличие фильтра тенденции, при активации которого, сигналы будут появляться только в направлении основного движения. Параметры
True Super Arrows
Muhammed Emin Ugur
True Super Arrows is a powerful and versatile indicator that can help you identify and trade profitable trends. The indicator uses a combination of technical indicators to generate arrows that point to the direction of the trend. Features: Multiple trend identification methods:   The indicator uses a combination of moving averages, trend lines, and other indicators to identify trends. Accurate trend direction:   The indicator uses a variety of techniques to ensure that the arrows are pointing in
MajorAlert
Sergei Vassunov
MajorAlert - is a professional trading indicator for MetaTrader 4 that combines two distinct market analysis approaches into one powerful tool. By integrating a counter‑trend entry logic (upper block) with a trend‑following filter (lower block), the indicator generates high‑probability signals on the chart with clearly separated arrow colors. Key Features Fully self‑contained   – no external indicators required; all calculations are built‑in. Versatile inputs   – adjust all parameters to suit a
Night ghost
Dmitriy Kashevich
Night Ghost - Indicatore a freccia per opzioni binarie. Questo è un assistente affidabile per te in futuro! - Nessun ridisegno sul grafico -Funziona alla grande su tutte le coppie di valute! -Precisione dell'indicatore fino al 90% (soprattutto di notte) -Non c'è bisogno di impostare per molto tempo (impostato perfettamente per le opzioni binarie) - Segnali non in ritardo - La comparsa di un segnale sulla candela corrente -Perfetto per il periodo M1 (non più!) - Colore della candela ad
Cosmic Diviner X Planet
Olena Kondratenko
4 (2)
This unique multi-currency strategy simultaneously determines the strength of trends and market entry points, visualizing this using histograms on the chart. The indicator is optimally adapted for trading on the timeframes М5, М15, М30, Н1. For the convenience of users, the indicator renders the entry point (in the form of an arrow), recommended take profit levels (TP1, TP2 with text labels) and the recommended Stop Loss level. The take profit levels (TP1, TP2) are automatically calculated for
Indicatore Crypto_Forex "MFI FLAT Detector" - è un efficace strumento ausiliario per il trading! Nessuna rielaborazione. Ti offro di aggiornare i tuoi metodi di trading con questo fantastico indicatore per MT4. - L'indicatore mostra le aree di prezzo piatte sul grafico. Dispone del parametro "Sensibilità piatta", responsabile del rilevamento di zone piatte. - "MFI FLAT Detector" è molto utile per il rilevamento delle divergenze ed è ottimo anche da combinare con la Price Action. - Puoi usarlo n
Gli utenti di questo prodotto hanno anche acquistato
Gann Made Easy
Oleg Rodin
4.84 (171)
Gann Made Easy è un sistema di trading Forex professionale e facile da usare che si basa sui migliori principi del trading utilizzando la teoria di mr. WD Gann. L'indicatore fornisce segnali ACQUISTA e VENDI accurati, inclusi i livelli di Stop Loss e Take Profit. Puoi fare trading anche in movimento utilizzando le notifiche PUSH. CONTATTAMI DOPO L'ACQUISTO PER RICEVERE GRATUITAMENTE LE ISTRUZIONI DI TRADING E OTTIMI INDICATORI EXTRA! Probabilmente hai già sentito parlare molte volte dei metodi d
BTMM State Engine Pro by G-Labs — Beat The Market Maker indicator for MetaTrader 4. Asian session range, London and New York kill zones, level progression (L1/L2/L3), peak formation detection (PFH/PFL), entry signals, and a multi-pair scanner from one chart. Stop scanning charts one pair at a time. The State Engine tracks the BTMM daily cycle automatically — Asian box, room boundaries, level blocks, peak formations, and filtered entries — while the scanner dashboard shows level, peak status,
M1 Sniper
Oleg Rodin
5 (26)
M1 SNIPER è un sistema di indicatori di trading facile da usare. Si tratta di un indicatore a freccia progettato per l'intervallo temporale M1. L'indicatore può essere utilizzato come sistema autonomo per lo scalping sull'intervallo temporale M1 e come parte del tuo sistema di trading esistente. Sebbene questo sistema di trading sia stato progettato specificamente per il trading sull'intervallo temporale M1, può comunque essere utilizzato anche con altri intervalli temporali. Inizialmente ho pro
Neuro Poseidon MT4
Daria Rezueva
4.8 (45)
Neuro Poseidon is a new indicator by Daria Rezueva. It combines precise trading signals with adaptive TP/SL levels - creating best possible trades as a result! Message me and get  Neuro Poseidon Assistant  as a gift to automize your trading process! What makes it stand out? 1. Proven profitability on all assets and timeframes 2. Only confirmed BUY and SELL signals present on the chart 3. Adaptive TP & SL levels generated by the software for each trade 4. Easy to understand - suitable for all
Prop Firm Sniper
Mohamed Hassan
4.33 (6)
Prop Firm Sniper MT4  is a professional market structure indicator that automatically identifies high-probability BUY and SELL opportunities using BOS and CHoCH analysis. Recommended Timeframes: For backtesting, use the indicator on   M5 or M15   for Gold (XAUUSD), and   M15 or H1   for more volatile Forex pairs such as   GBPUSD, USDJPY, EURGBP , and similar markets. CONTACT ME AFTER PURCHASE TO CLAIM YOUR FREE BONUSES! Prop Firm Sniper  is a professional market structure indicator designed t
DayTrader PRO MT4
Davit Beridze
5 (1)
DayTrader PRO DayTrader PRO è un indicatore di trading avanzato che combina il filtro Laguerre di John Ehlers con un potente motore di auto-ottimizzazione. Invece di utilizzare parametri fissi, l'indicatore ricerca automaticamente le migliori impostazioni in base alle condizioni recenti del mercato, aiutandoti ad adattarti alla volatilità variabile senza costanti aggiustamenti manuali. L'indicatore genera segnali chiari di ACQUISTO (BUY) e VENDITA (SELL), insieme a livelli adattivi di Stop Loss
KURAMA GOLD SIGNAL PRO (MT4) — Filtro a 7 livelli · TP/SL automatico · Punteggio di qualità · Salvataggio dello storico dei segnali | Sistema di trading completo per XAUUSD Nessun ridisegno (repaint) in tempo reale. Nell'istante in cui appare un segnale, freccia, ingresso, TP e SL vengono bloccati sul posto e non si spostano mai più. Ciò che fai tradare è proprio questo segnale in tempo reale. E nella v7.20, ogni segnale realmente inviato viene salvato automaticamente e ripristinato con esattez
Scalper Inside PRO
Alexey Minkov
4.74 (68)
Scalper Inside PRO helps you read the intraday trend and plan your trade before you enter. It uses exclusive built-in algorithms to evaluate market direction and calculate key target levels the moment a signal appears, so you always see the potential entry, stop-loss and profit targets ahead of time. The indicator also shows detailed performance statistics on historical data, so you can see how different instruments and strategies behaved and choose what fits current market conditions. You can e
Currency Strength Wizard è un indicatore molto potente che ti fornisce una soluzione all-in-one per un trading di successo. L'indicatore calcola la potenza di questa o quella coppia forex utilizzando i dati di tutte le valute su più intervalli di tempo. Questi dati sono rappresentati in una forma di indice di valuta facile da usare e linee elettriche di valuta che puoi utilizzare per vedere il potere di questa o quella valuta. Tutto ciò di cui hai bisogno è collegare l'indicatore al grafico che
SR Liquidity è un indicatore di trading progettato per individuare le zone nascoste in cui si concentra la liquidità di mercato e dove il prezzo reagisce con maggiore intensità. Queste aree di liquidità agiscono come potenti livelli di supporto e resistenza, offrendo una mappa chiara dei punti in cui è più probabile che il mercato inverta la propria direzione. Invece di tracciare le classiche linee di supporto e resistenza, SR Liquidity analizza l'effettivo comportamento dei prezzi per individua
Quantum Breakout Indicator PRO
Bogdan Ion Puscasu
4.96 (26)
Presentazione       Quantum Breakout PRO   , l'innovativo indicatore MQL5 che sta trasformando il modo in cui scambi le zone di breakout! Sviluppato da un team di trader esperti con un'esperienza di trading di oltre 13 anni,   Quantum Breakout PRO   è progettato per spingere il tuo viaggio di trading a nuovi livelli con la sua strategia innovativa e dinamica della zona di breakout. Quantum Breakout Indicator ti fornirà frecce di segnalazione sulle zone di breakout con 5 zone target di profitt
Super Signal – Skyblade Edition Sistema professionale di segnali di tendenza senza repaint / senza ritardo con tasso di vincita eccezionale | Per MT4 / MT5 Funziona meglio su timeframe più bassi, come 1 minuto, 5 minuti e 15 minuti. Caratteristiche principali: Super Signal – Skyblade Edition è un sistema intelligente di segnali progettato specificamente per il trading di tendenza. Utilizza una logica di filtraggio multilivello per identificare esclusivamente i movimenti direzionali forti, supp
Neo Wave PRO
Nikolay Raykov
5 (1)
Price & Time Market Structure Indicator A professional market structure tool that analyzes waves through both price and time — not price alone. Main Description NeoWave PRO is a professional market structure indicator for MetaTrader 4 designed for traders who want to move beyond traditional one-dimensional wave tools such as ZigZag, swing indicators, and basic high/low systems. Most wave indicators analyze only one thing: Price. But a real market wave is not only a price movement. A true wave de
AW Candle Patterns MT4
AW Trading Software Limited
L'indicatore AW Candle Patterns è una combinazione di un indicatore di tendenza avanzato combinato con un potente scanner di modelli di candele. È uno strumento utile per riconoscere ed evidenziare i trenta modelli di candele più affidabili. Inoltre, è un analizzatore di trend attuale basato su barre colorate con a       pannello di trend multi-timeframe plug-in che può essere ridimensionato e posizionato. Una capacità unica di regolare la visualizzazione dei modelli in base al filtraggio delle
All in One Trade
Alexey Minkov
4.5 (28)
All-in-One Trade Indicator (AOTI) – Since 2015. The All-in-One Trade Indicator (AOTI) determines daily targets for EURUSD, EURJPY, GBPUSD, USDCHF, EURGBP, EURCAD, EURAUD, AUDJPY, GBPAUD, GBPCAD, GBPCHF, GBPJPY, AUDUSD, and USDJPY. All other modules work with any trading instruments. The indicator includes various features, such as Double Channel trend direction, Price channel, MA Bands, Fibo levels, Climax Bar detection, and others. The AOTI indicator is based on several trading strategies, and
ECM Elite Channel is a volatility-based indicator, developed with a specific time algorithm, which consists of finding possible corrections in the market. This indicator shows two outer lines, an inner line (retracement line) and an arrow sign, where the channel theory is to help identify overbought and oversold conditions in the market. The market price will generally fall between the boundaries of the channel. If prices touch or move outside the channel, it's a trading opportunity. The ind
Questo prodotto è stato aggiornato per il mercato 2026 e ottimizzato per le ultime build di MT5. AVVISO DI AGGIORNAMENTO PREZZO: Smart Trend Trading System è attualmente disponibile a $99 . Il prezzo aumenterà a $199 dopo i prossimi 30 acquisti . OFFERTA SPECIALE: Dopo aver acquistato Smart Trend Trading System, inviami un messaggio privato per ricevere Smart Universal EA GRATIS e trasformare i tuoi segnali Smart Trend in operazioni automatiche. Smart Trend Trading System è un sistema di tradin
FX Power MT4 NG
Daniel Stein
4.95 (21)
FX Power: Analizza la Forza delle Valute per Decisioni di Trading Più Intelligenti Panoramica FX Power è lo strumento essenziale per comprendere la reale forza delle principali valute e dell'oro in qualsiasi condizione di mercato. Identificando le valute forti da comprare e quelle deboli da vendere, FX Power semplifica le decisioni di trading e rivela opportunità ad alta probabilità. Che tu segua le tendenze o anticipi inversioni utilizzando valori estremi di Delta, questo strumento si adatta
Scalper Vault
Oleg Rodin
5 (37)
Scalper Vault è un sistema di scalping professionale che ti fornisce tutto il necessario per scalping di successo. Questo indicatore è un sistema di trading completo che può essere utilizzato dai trader di forex e opzioni binarie. L'intervallo di tempo consigliato è M5. Il sistema fornisce segnali di freccia accurati nella direzione della tendenza. Ti fornisce anche i segnali più alti e più bassi e i livelli di mercato di Gann. Gli indicatori forniscono tutti i tipi di avvisi, comprese le notifi
BUY 1 and GET 1 FREE - Promotion! Buy Trend Reader Indicator with a huge –60% discount and GET 1 FREE EA by your choice! Promo Price: $117 (Regular Price: $297 — You Save $180! Don't Miss!) After purchase contact me to get your GIFT EA! You can also contact me to get the list of available GIFT EAs! Trend Reader Indicator is a revolutionary trading indicator designed to empower forex traders with the tools they need to make informed trading decisions. This cutting-edge indicator utilizes compl
Market Reversal Alerts
Lee Samson
4.19 (114)
Il profitto dalla struttura del mercato cambia quando il prezzo si inverte e si ritira. L'indicatore di avviso di inversione della struttura del mercato identifica quando una tendenza o un movimento di prezzo si sta avvicinando all'esaurimento e pronto a invertire. Ti avvisa dei cambiamenti nella struttura del mercato che in genere si verificano quando stanno per verificarsi un'inversione o un forte pullback. L'indicatore identifica inizialmente i breakout e lo slancio del prezzo, ogni volta c
Volatility Trend System - un sistema di trading che fornisce segnali per le voci. Il sistema di volatilità fornisce segnali lineari e puntuali nella direzione del trend, nonché segnali per uscirne, senza ridisegnare e ritardi. L'indicatore di tendenza monitora la direzione della tendenza a medio termine, mostra la direzione e il suo cambiamento. L'indicatore di segnale si basa sui cambiamenti della volatilità e mostra gli ingressi nel mercato. L'indicatore è dotato di diversi tipi di avvisi. Pu
Atomic Analyst
Issam Kassas
5 (11)
Questo prodotto è stato aggiornato per il mercato 2026 e ottimizzato per le ultime build di MT5. AVVISO DI AGGIORNAMENTO PREZZO: Atomic Analyst è attualmente disponibile a $99 . Il prezzo aumenterà a $199 dopo i prossimi 30 acquisti . OFFERTA SPECIALE: Dopo aver acquistato Atomic Analyst, inviami un messaggio privato per ricevere Smart Universal EA GRATIS e trasformare i tuoi segnali Atomic Analyst in operazioni automatiche. Atomic Analyst è un indicatore di trading Price Action non-repainting
MT4 Macd Divergence Scanner
Krzysztof Janusz Stankiewic
Questo indicatore offre un modo efficiente per monitorare simultaneamente più coppie di valute e diversi intervalli temporali. Visualizzando le divergenze tra il prezzo e l’indicatore MACD in una tabella chiara e ben strutturata, consente ai trader di individuare potenziali punti di inversione di mercato senza dover passare continuamente da un grafico all’altro. Le divergenze possono segnalare un cambiamento di momentum, sia rialzista che ribassista. Ad esempio, si verifica una divergenza ribass
Naturu MT4
Ivan Stefanov
“Naturu” è un indicatore manuale che utilizza la simmetria della natura come algoritmo. Conquista il mercato con una strategia semplice e saggezza nascosta! Quando carichi l’indicatore, vedrai due linee: Top e Bottom. Clicca una volta su una linea per attivarla. Per spostarla, basta cliccare sulla candela dove vuoi posizionarla. Definisci un punto alto e un punto basso, e l’indicatore calcola automaticamente: Una zona magenta che mostra dove gli interessi di tori e orsi sono più vicini, ossia l’
Cycle Sniper
Elmira Memish
4.39 (36)
Please contact us after your purchase and we will send you the complimentary indicators to complete the system Cycle Sniper is not a holy grail but when you use it in a system which is explained in the videos, you will feel the difference. If you are not willing to focus on the charts designed with Cycle Sniper and other free tools we provide, we recommend not buying this indicator. We recommend watching the videos about the indiactor and system before purchasing. Videos, settings  and descri
Accesso Ufficiale all'Ecosistema BlueDigitsFx Ricevi aggiornamenti sull'infrastruttura, risorse operative, nuovi prodotti e accesso all'ecosistema ufficiale BlueDigitsFx. Ecosistema Telegram Sito Web Versione MT5 BlueDigitsFx OBV Divergence MT4 — Indicatore di Divergenza dei Volumi per Identificare le Inversioni di Mercato BlueDigitsFx OBV Divergence è un indicatore MT4 progettato per identificare divergenze rialziste e ribassiste tra l'azione del prezzo e l'indicatore On-Balance Volume (OBV
Accesso Ufficiale all'Ecosistema BlueDigitsFx Ricevi aggiornamenti sull'infrastruttura, risorse operative, nuovi prodotti e accesso all'ecosistema ufficiale BlueDigitsFx. Ecosistema Telegram Sito Web Versione MT5 BlueDigitsFx Easy 123 System — Potente sistema di rilevamento di inversioni e breakout per MT4 Sistema completo senza repaint per individuare inversioni e breakout di mercato — progettato per trader che apprezzano struttura, chiarezza e operatività basata sulla conferma. BlueDigitsFx
M1 Arrow
Oleg Rodin
4.81 (21)
M1 Arrow è un indicatore basato sui principi naturali del trading di mercato, che includono l'analisi della volatilità e dei volumi. L'indicatore può essere utilizzato con qualsiasi timeframe e coppia di valute. Un parametro di facile utilizzo consente di adattare i segnali a qualsiasi coppia di valute e timeframe. Oltre all'algoritmo principale basato su segnali di acquisto e vendita, l'indicatore include diverse strategie aggiuntive integrate, selezionabili tramite le impostazioni. Queste stra
Break and Retest
Mohamed Hassan
4.2 (20)
This Indicator only places quality trades when the market is really in your favor with a clear break and retest. Patience is key with this price action strategy! If you want more alert signals per day, you increase the number next to the parameter called: Support & Resistance Sensitivity.  After many months of hard work and dedication, we are extremely proud to present you our  Break and Retest price action indicator created from scratch. One of the most complex indicators that we made with over
Altri dall’autore
This is addition of  Effective SV squeeze momentum  that add bolliger band and Keltner channel to chart window.  Squeeze momentum introduced by “John Carter”, the squeeze indicator for MT5 represents a volatility-based tool. Regardless, we can also consider the squeeze indicator as a momentum indicator, as many traders use it to identify the direction and strength of price moves. In fact, the Tradingview  squeeze indicator shows when a financial instrument is willing to change from a trending ma
FREE
This is a Forex Scalping Trading Sytem based on the Bollinger Bands.  Pairs:Major Time frame: 1M or higher. Spread max:0,0001.  Indicators (just suggestion) Bollinger bands (20, 2); ADX (14 period); RSI   (7 period ). Y ou should only trade this system between 2am to 5am EST, 8am to 12am EST and 7.30pm to 10pm EST. Do not scalp 30 minutes before a orange or red news  report and not for a hour afterwards.   Setup: is for price to move above the lower or lower Bollinger Bands, RSI raise above the
FREE
This indicator presents an alternative approach to identify Market Structure. The logic used is derived from learning material created by   DaveTeaches (on X) Upgrade v1.10: add option to put protected high/low value to buffer (figure 11, 12) When quantifying Market Structure, it is common to use fractal highs and lows to identify "significant" swing pivots. When price closes through these pivots, we may identify a Market Structure Shift (MSS) for reversals or a Break of Structure (BOS) for co
The Bheurekso Pattern Indicator for MT5 helps traders automatically identify candlestick pattern that formed on the chart base on some japanese candle pattern and other indicator to improve accurate. This indicator scans all candles, recognizes and then displays any candle patterns formed on the chart. The candle displayed can be Bullish or Bearish Engulfing, Bullish or Bearish Harami, and so on. There are some free version now but almost that is repaint and lack off alert function. With this ve
The Breaker Blocks with Signals indicator aims to highlight a complete methodology based on breaker blocks. Breakout signals between the price and breaker blocks are highlighted and premium/discount swing levels are included to provide potential take profit/stop loss levels. This script also includes alerts for each signal highlighted.   SETTINGS   Breaker Blocks Length: Sensitivity of the detected swings used to construct breaker blocks. Higher values will return longer term break
The liquidity swings indicator highlights swing areas with existent trading activity. The number of times price revisited a swing area is highlighted by a zone delimiting the swing areas. Additionally, the accumulated volume within swing areas is highlighted by labels on the chart. An option to filter out swing areas with volume/counts not reaching a user-set threshold is also included. This indicator by its very nature is not real-time and is meant for descriptive analysis alongside other com
Multiple Wicks forming at OverSold & OverBought levels create Buying and Selling Pressure. This indicator tries to capture the essence of the buy and sell pressure created by those wicks. Wick pressure shows that the trend is Exhausted. Order block should display when buying or selling pressure wick. When price go inside buy order block and up to outside order block, trader should consider a buy order. If price go inside buy order block and down to outside order block, trader should consider a s
OVERVIEW K-means is a clustering algorithm commonly used in machine learning to group data points into distinct clusters based on their similarities. While K-means is not typically used directly for identifying support and resistance levels in financial markets, it can serve as a tool in a broader analysis approach. Support and resistance levels are price levels in financial markets where the price tends to react or reverse. Support is a level where the price tends to stop falling and m
All about Smart Money Concepts Strategy: Market struture: internal or swing BOS, CHoCH; Orderblock; Liquity equal; Fair Value Gap with Consequent encroachment, Balanced price range; Level with Previous month, week, day level or in day level (PMH, PWH, PDH, HOD); BuySell Stops Liquidity (BSL, SSL); Liquidity Void Long Wicks; Premium and Discount; Candle pattern ... "Smart Money Concepts" ( SMC ) is a fairly new yet widely used term amongst price action traders looking to more accurately navigate
The indicator   returning pivot point based trendlines with highlighted breakouts . Trendline caculated by pivot point and other clue are ATR, Stdev.   The indicator also includes integrated alerts for  trendlines  breakouts   and foward message to Telegram channel or group if you want. Settings ·            Lookback bar: Default 200 is number of bar caculate when init indicator. ·            Length:  Pivot points  period ·            Slope Calculation Method: Determines how this lope is calcula
This all-in-one indicator displays real-time market structure (internal & swing BOS / CHoCH), order blocks, premium & discount zones, equal highs & lows, and much more...allowing traders to automatically mark up their charts with widely used price action methodologies. Following the release of our Fair Value Gap script, we received numerous requests from our community to release more features in the same category. //------------------------------------// Version 1.x has missing functions + PDAr
The Breaker Blocks with Signals indicator aims to highlight a complete methodology based on breaker blocks. Breakout signals between the price and breaker blocks are highlighted and premium/discount swing levels are included to provide potential take profit/stop loss levels. This script also includes alerts for each signal highlighted.   SETTINGS   Breaker Blocks Length: Sensitivity of the detected swings used to construct breaker blocks. Higher values will return longer term break
The ICT Concepts indicator regroups core concepts highlighted by trader and educator "The Inner Circle Trader" (ICT) into an all-in-one toolkit. Features include Market Structure (MSS & BOS), Order Blocks, Imbalances, Buyside/Sellside Liquidity, Displacements, ICT Killzones, and New Week/Day Opening Gaps. It’s one kind of Smart money concepts.   USAGE:   Please read this   document  !      DETAILS Market Structure Market structure labels are constructed from price breaking a prior extreme
The FollowLine indicator is a trend following indicator. The blue/red lines are activated when the price closes above the upper Bollinger band or below the lower one. Once the trigger of the trend direction is made, the FollowLine will be placed at High or Low (depending of the trend). An ATR filter can be selected to place the line at a more distance level than the normal mode settled at candles Highs/Lows. Some features: + Trend detech + Reversal signal + Alert teminar / mobile app
The ICT Silver Bullet indicator is inspired from the lectures of "The Inner Circle Trader" (ICT) and highlights the Silver Bullet (SB) window which is a specific 1-hour interval where a Fair Value Gap (FVG) pattern can be formed. A detail document about ICT Silver Bullet here . There are 3 different Silver Bullet windows (New York local time): The London Open Silver Bullet (3 AM — 4 AM ~ 03:00 — 04:00) The AM Session Silver Bullet (10 AM — 11 AM ~ 10:00 — 11:00) The PM Session Silver Bullet (2
Sessions by Lux
Minh Truong Pham
This indicator shows when user set sessions are active and returns various tools + metrics using the closing price within active sessions as an input. Users have the option to change up to 4 session times. The indicator will increasingly lack accuracy when the chart timeframe is higher than 1 hour. Settings Sessions Enable Session: Allows to enable or disable all associated elements with a specific user set session. Session Time: Opening and closing times of the user set session in the  
The liquidity swings indicator highlights swing areas with existent trading activity. The number of times price revisited a swing area is highlighted by a zone delimiting the swing areas. Additionally, the accumulated volume within swing areas is highlighted by labels on the chart. An option to filter out swing areas with volume/counts not reaching a user-set threshold is also included. This indicator by its very nature is not real-time and is meant for descriptive analysis alongside other com
The SuperTrend AI indicator is a novel take on bridging the gap between the K-means clustering machine learning method & technical indicators. In this case, we apply K-Means clustering to the famous SuperTrend indicator.   USAGE Users can interpret the SuperTrend AI trailing stop similarly to the regular SuperTrend indicator. Using higher minimum/maximum factors will return longer-term signals. (image 1) The displayed performance metrics displayed on each signal allow for a deeper interpretat
OVERVIEW A Lorentzian Distance Classifier (LDC) is a Machine Learning classification algorithm capable of categorizing historical data from a multi-dimensional feature space. This indicator demonstrates how Lorentzian Classification can also be used to predict the direction of future price movements when used as the distance metric for a novel implementation of an Approximate Nearest Neighbors (ANN) algorithm. This indicator provide signal as buffer, so very easy for create EA from this indi
This script automatically calculates and updates ICT's daily IPDA look back time intervals and their respective discount / equilibrium / premium, so you don't have to :) IPDA stands for Interbank Price Delivery Algorithm. Said algorithm appears to be referencing the past 20, 40, and 60 days intervals as points of reference to define ranges and related PD arrays. Intraday traders can find most value in the 20 Day Look Back box, by observing imbalances and points of interest. Longer term traders c
An Implied Fair Value Gap (IFVG) is a three candles imbalance formation conceptualized by ICT that is based on detecting a larger candle body & then measuring the average between the two adjacent candle shadows. This indicator automatically detects this imbalance formation on your charts and can be extended by a user set number of bars. The IFVG average can also be extended until a new respective IFVG is detected, serving as a support/resistance line. Alerts for the detection of bullish/be
Consolidation is when price is moving inside a clear trading range. When prices are consolidated it shows the market maker placing orders on both sides of the market. This is mainly due to manipulate the un informed money. This indicator automatically identifies consolidation zones and plots them on the chart. The method of determining consolidation zones is based on pivot points and ATR, ensuring precise identification. The indicator also sends alert notifications to users when a new consolida
This indicator provides the ability to recognize the SMC pattern, essentially a condensed version of the Wyckoff model. Once the pattern is confirmed by RTO, it represents a significant investment opportunity.    There are numerous indicators related to SMC beyond the market, but this is the first indicator to leverage patterns to identify specific actions of BigBoy to  navigate the market. Upgrade 2024-03-08: Add TP by RR feature. The SMC (Smart Money Concept)   pattern   is a market analysis m
Created by imjesstwoone and mickey1984, this trade model attempts to capture the expansion from the 10:00-14:00 EST 4h candle using just 3 simple steps. All of the information presented in this description has been outlined by its creators, all I did was translate it to MQL4. All core settings of the trade model may be edited so that users can test several variations, however this description will cover its default, intended behavior using NQ 5m as an example. Step 1 is to identify our Price Ra
The Buyside & Sellside Liquidity indicator aims to detect & highlight the first and arguably most important concept within the ICT trading methodology,   Liquidity   levels. SETTINGS Liquidity Levels Detection Length: Lookback period Margin: Sets margin/sensitivity for a liquidity level detection Liquidity Zones Buyside Liquidity Zones: Enables display of the buyside liquidity zones. Margin: Sets margin/sensitivity for the liquidity zone boundaries. Color: Color option for buysid
The   Liquidation Estimates (Real-Time)   experimental indicator attempts to highlight real-time long and short liquidations on all timeframes. Here with liquidations, we refer to the process of forcibly closing a trader's position in the market. By analyzing liquidation data, traders can gauge market sentiment, identify potential support and resistance levels, identify potential trend reversals, and make informed decisions about entry and exit points. USAGE (Img 1)    Liquidation refers
The   ICT Unicorn Model   indicator highlights the presence of "unicorn" patterns on the user's chart which is derived from the lectures of   "The Inner Circle Trader" (ICT) . Detected patterns are followed by targets with a distance controlled by the user.   USAGE (image 2) At its core, the ICT Unicorn Model relies on two popular concepts, Fair Value Gaps and Breaker Blocks. This combination highlights a future area of support/resistance. A   Bullish Unicorn Pattern   consists out of:
The Inversion Fair Value Gaps (IFVG) indicator is based on the inversion FVG concept by ICT and provides support and resistance zones based on mitigated Fair Value Gaps (FVGs). Image 1   USAGE Once mitigation of an FVG occurs, we detect the zone as an "Inverted FVG". This would now be looked upon for potential support or resistance. Mitigation occurs when the price closes above or below the FVG area in the opposite direction of its bias. (Image 2) Inverted Bullish FVGs Turn into Potenti
Overview The   Volume SuperTrend AI   is an advanced technical indicator used to predict trends in price movements by utilizing a combination of traditional SuperTrend calculation and AI techniques, particularly the k-nearest neighbors (KNN) algorithm. The Volume SuperTrend AI is designed to provide traders with insights into potential market trends, using both volume-weighted moving averages (VWMA) and the k-nearest neighbors (KNN) algorithm. By combining these approaches, the indicator
Introducing the Reversal and Breakout Signals   This innovative tool is crafted to enhance your chart analysis by identifying potential reversal and breakout opportunities directly on your charts. It's designed with both novice and experienced traders in mind, providing intuitive visual cues for better decision-making. Let's dive into the key features and how it operates: ###   Key Features:   Dynamic Period Settings:   Customize the sensitivity of the indicator with user-def
Filtro:
Nessuna recensione
Rispondi alla recensione