Levels Map
- Утилиты
-
AL MOOSAWI ABDULLAH JAFFER BAQER
 To trade successfully we need to go through the proven path that others had gone and reached!
Here are 17 quotes from such successful investors:
1- Limit your size in any position so that fear does not become the prevailing instinct guiding your judgment.
Joe Vidich - Версия: 1.10
- Активации: 5
See the market through its most important price levels.
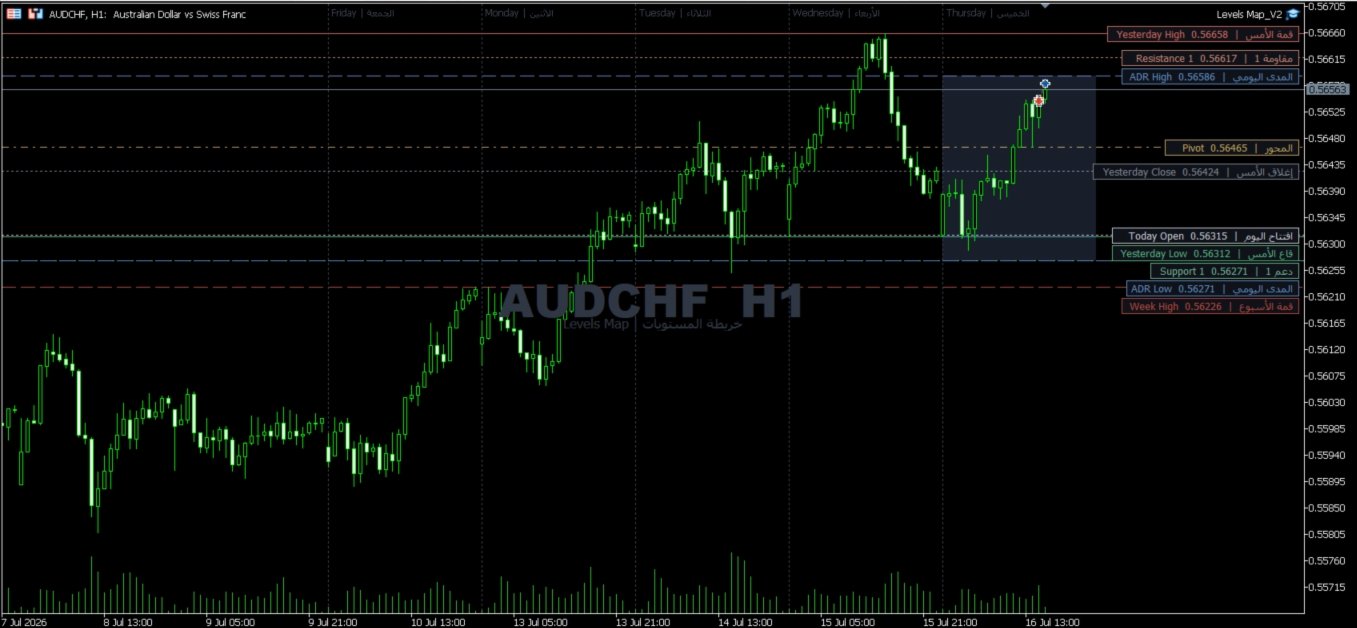
Levels Map is a professional MetaTrader utility that automatically identifies and displays significant market price levels directly on your chart. Designed to help traders visualize key areas of support, resistance, and market structure, Levels Map provides a clearer understanding of where price is likely to react before making trading decisions.
Instead of manually drawing horizontal lines and constantly updating your charts, Levels Map continuously analyzes price action and highlights the levels that matter most, allowing you to focus on planning high-probability trades.
Whether you're a scalper, day trader, swing trader, or long-term investor, Levels Map provides valuable market context to improve trade timing, identify reaction zones, and enhance technical analysis.
Key Features
Automatic Level Detection
-
Automatically identifies important price levels.
-
Continuously updates as market conditions change.
-
Eliminates the need for manual chart marking.
-
Highlights significant support and resistance zones.
Market Structure Visualization
-
Displays key price areas where buyers and sellers have previously reacted.
-
Helps identify potential reversal and breakout zones.
-
Improves overall market awareness.
-
Supports price action trading strategies.
Dynamic Chart Display
-
Draws levels directly on the chart.
-
Clean and professional visualization.
-
Designed to minimize chart clutter.
-
Easy-to-read interface suitable for all trading styles.
Multi-Timeframe Analysis
-
Works across multiple chart timeframes.
-
Helps traders identify major higher-timeframe levels.
-
Supports top-down market analysis.
-
Provides better context for trade planning.
Decision Support
-
Assists with entry and exit planning.
-
Helps determine logical Stop Loss and Take Profit locations.
-
Identifies potential breakout and rejection areas.
-
Complements existing technical trading strategies.
Fully Customizable
-
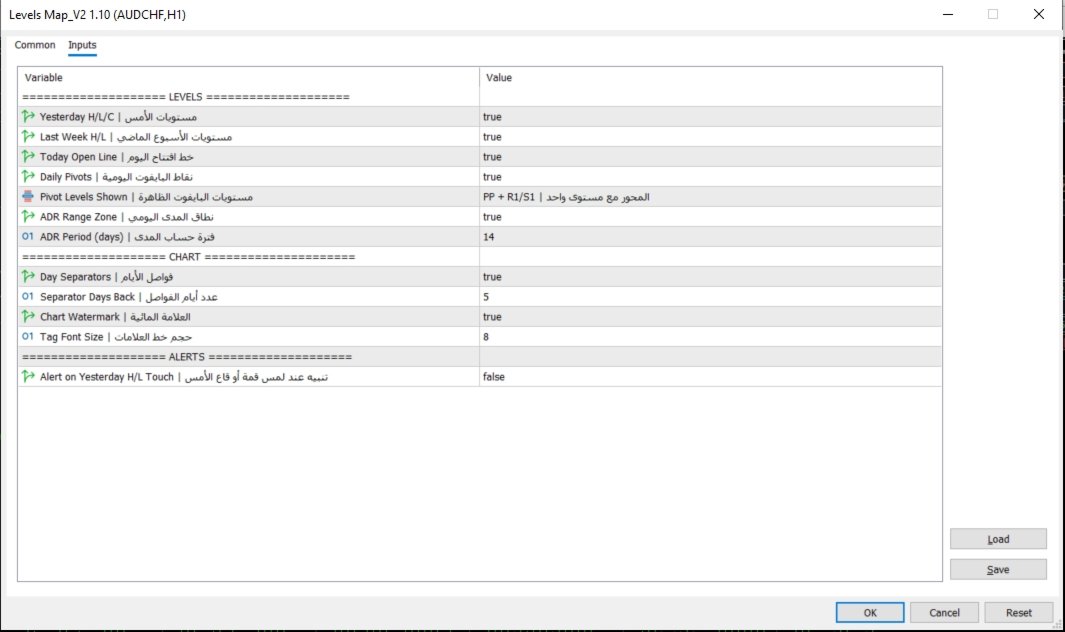
Adjustable display settings.
-
Custom colors and level visibility.
-
Compatible with all symbols and timeframes.
-
Lightweight and optimized for continuous operation.
Why Choose Levels Map?
Successful trading often depends on understanding where the market is likely to react. Major support and resistance levels frequently act as decision points where trends pause, reverse, or accelerate.
Levels Map simplifies this process by automatically identifying and displaying these critical price zones, giving traders a clearer picture of market structure without the time-consuming task of manually drawing levels.
Whether you're trading breakouts, pullbacks, reversals, or trend continuations, Levels Map provides the market context needed to make more informed trading decisions and improve overall chart analysis.
See the levels. Understand the market. Trade with greater confidence.