FutureProfile
- Индикаторы
- Версия: 1.0

🟢Idea
The idea is — it seems to me that exactly at 10:00 EURUSD always goes up. How can this be verified?
This indicator analyzes historical data at the same hour of the day over the past N days and shows:
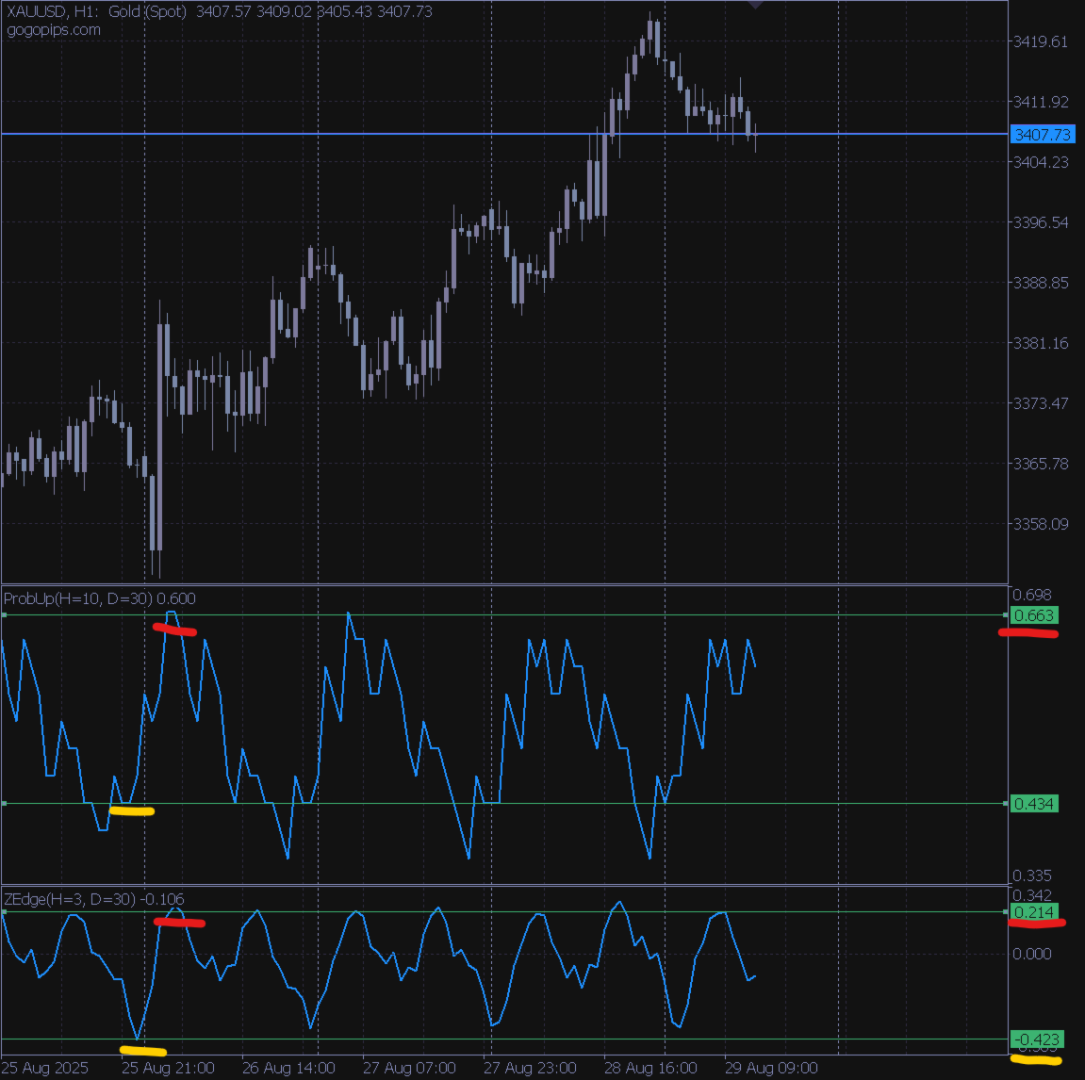
- ProbUp — the probability that after a given number of bars (HorizonBars) the price will be higher;
- ZEdge — the “strength” of the signal = average move / dispersion.
This allows you to understand:
- “In 70% of cases, after 3 bars during this hour the market moved up.”
- “The signal is strong enough (z ≈ +1)” or, conversely, “too noisy (z ≈ 0).”
One more time.
This indicator shows probability and density. It’s like you could see all outcomes over the past 30 days (or any other period) at once — but represented by just two numbers.
- Prob = 0.9 → starting from the current bar (on any timeframe), looking X bars ahead (as you set), in 90% of cases the price went up at this exact time.
- Prob = 0.1 → low probability of growth, high probability of decline.
- ZEdge = 0.9 → high density of growth (signal strength or quality). Think of it like a heatmap, but expressed in one number.
- ZEdge = -0.9 → high density of decline.
🔧Parameters
- Mode — what to display: ProbUp or ZEdge (recommended to attach the indicator twice to get two separate windows).
- DaysLookback — how many previous days to take into account (e.g., 30).
- HorizonBars — forecast horizon (e.g., 3 bars).
- MinSamples — minimum number of observations required for statistics.
- UseLogReturn — use logarithmic returns (more robust to price scale).
- SkipWeekends — ignore weekends.
- ProbThreshold — probability level at which the signal triggers.
- ZEdgeThreshold — threshold for signal strength (absolute value).
- PushEnabled — enable/disable push notifications.
- AlertOncePerBar — avoid repeated alerts on every tick.
Are you interested in professional trading? subscribe to my channel: Subscribe!
In the screenshot below you can see 2 examples:
- Red: Probability of growth = 0.663 (66%), density (quality) = 0.2 (20%).
- Yellow: Probability of decline = 57% (1 - 0.434), density = 42% (-0.423).
This is the probability for the next 3 bars, or any other number you set.