Multi EMA Trend Visualizer
- Утилиты
-
Nana Yaw Osei
 LightTrade Forex.
Providing EAs and trading utilities for global forex learners.
Specialized in risk management, trend following, and trade journaling.
Offering advanced tools for optimal trade exits and performance tracking. - Версия: 1.1
- Обновлено: 7 мая 2025
EMA Line Visualizer with Trend Analysis
Description:
The Exponential Moving Average (EMA) Line Visualizer EA plots multiple EMAs on your chart (25, 50, 100, 200, and a custom EMA) and analyzes real-time trend direction.
It detects whether the market is currently in an Uptrend, Downtrend, or Flat condition based on the latest EMA relationships.
Features:
-
Multi-EMA Display
Plot multiple EMAs with customizable periods. -
Custom Colors
Set distinct colors for each EMA line for better visual tracking. -
Trend Analysis
Clearly shows if the current market trend is up, down, or ranging. -
Timeframe Flexibility
Works with any MetaTrader 5 timeframe.
Input Parameters:
-
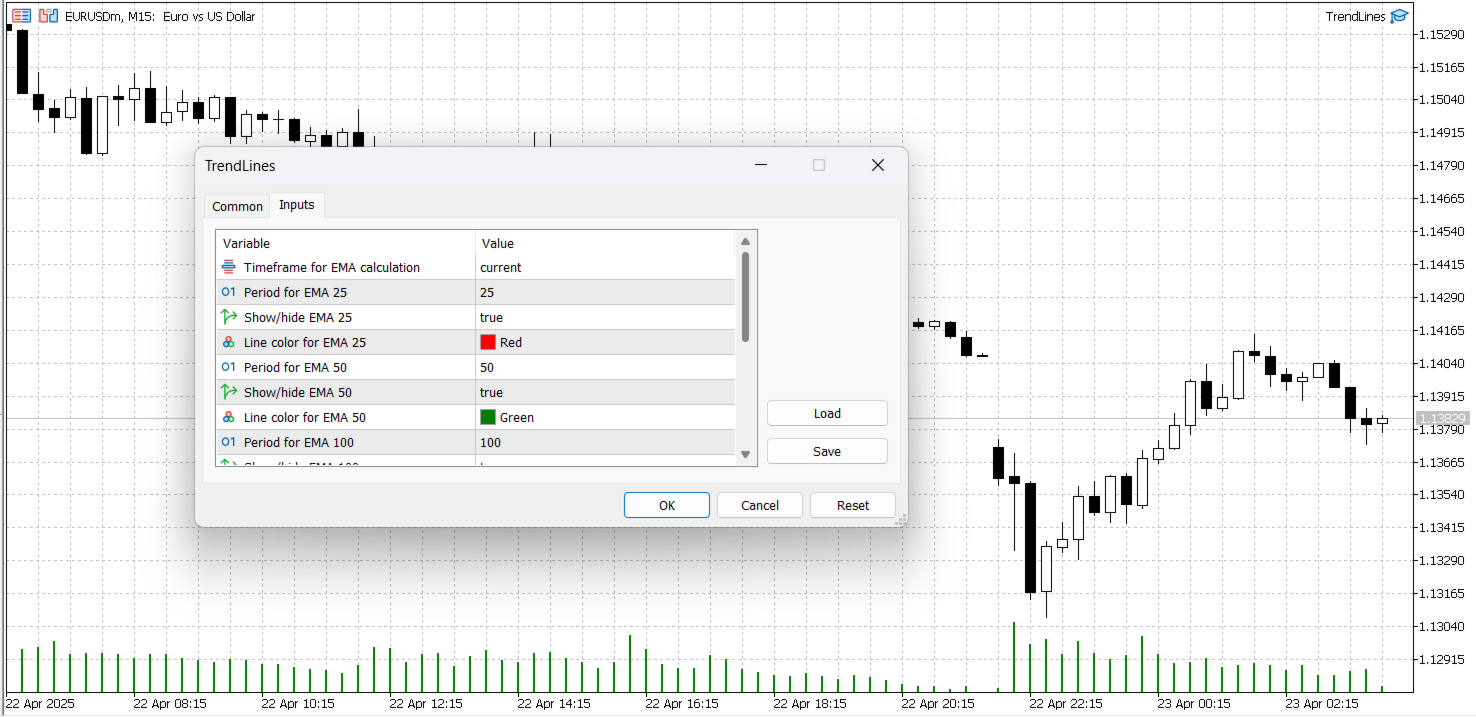
TimeFrame – EMA calculation timeframe (default is current chart timeframe).
-
EMAPeriods – Periods to use for EMA lines (default: 25, 50, 100, 200).
-
ShowEMA – Toggle visibility for each EMA line.
-
EMAColors – Choose specific colors for each EMA line.
-
CustomEMA – Enable and define a custom EMA period.
How It Works:
-
Calculates EMAs using iMA based on selected periods and timeframes.
-
Compares EMA values to determine the current trend.
-
Displays EMA lines and trend direction directly on the chart.
Usage:
-
Attach the EA to any MetaTrader 5 chart.
-
Adjust the input settings to your preferences.
-
View the EMAs and current trend direction visually on the chart.