 MetaTrader 5
 Эксперты
 Индикаторы
 Библиотеки
 Утилиты
 Виджеты
 Правила
Смотри обучающее видео по маркету на YouTube
Как купить торгового робота или индикатор
Запусти робота на
виртуальном хостинге
виртуальном хостинге
Протестируй индикатор/робота перед покупкой
Хочешь зарабатывать в Маркете?
Как подать продукт, чтобы его покупали
Новые технические индикаторы для MetaTrader 4
 На основании сигналов технических индикаторов из списка ниже вы сможете принимать решения относительно открытия или закрытия сделки в платформе MetaTrader 4.
Работа индикаторов заключается в математическом преобразовании цены и/или объемов финансового инструмента для прогнозирования изменений цен.

QUANTUM BINARY SNIPER MT4 Специализированный ИИ-движок | Прайс-экшен на основе трёх свечей | Импульс CCI на нескольких таймфреймах | Quantum Binary Sniper MT4 объединяет несколько уровней анализа графика в единую согласованную рабочую среду MetaTrader 4. Он сочетает компонент AI Special Engine / Prediction Engine, заданный трёхсвечной алгоритм, направленные стрелки в реальном времени, прямоугольные индикаторы импульса CCI на нескольких таймфреймах, отображение паттернов на исторических данных и

SPIDER X MT4 — ПРОДВИНУТЫЙ СИГНАЛЬНЫЙ ИНДИКАТОР PRICE ACTION Интеллектуальное обнаружение сигналов | Технология Spider Chain | Оповещения в реальном времени SPIDER X MT4 — индикатор на основе Price Action, предназначенный для выявления потенциальных возможностей для ПОКУПКИ и ПРОДАЖИ с помощью структурированного анализа свечей. Благодаря характерным сигналам в виде пауков, отображению исторических сигналов на графике, оповещениям в реальном времени и эксклюзивному интерфейсу Chain, Spider X обе

Heatmap Volume с первого взгляда показывает, когда объём действительно необычный. Каждый столбец объёма окрашивается в зависимости от того, на сколько стандартных отклонений он удалён от своей скользящей средней — от Low до Extra High , — и тот же цвет применяется к свечам основного графика. Всплески активности, кульминации и спокойные фазы видны прямо на цене, без чтения цифр. Как это работает Индикатор рассчитывает скользящую среднюю и стандартное отклонение объёма (по умолчанию 610 баров) и и
FREE

Aurex Structure Breakout — это бесплатный индикатор для MT4, предназначенный для определения зон поддержки и сопротивления, выявления пробоев и автоматического построения полного торгового плана прямо на графике. Индикатор работает на любом таймфрейме и любом инструменте, поддерживаемом MetaTrader 4, включая Forex, золото, индексы и CFD. При обнаружении подтверждённого пробоя индикатор может отображать: • Точку входа
• Stop Loss
• TP1
• TP2
• TP3 Также доступны всплывающие уведомления, звуко
FREE

Multi Timeframe Indicator Suite выводит скользящие средние, полосы, Ишимоку, VWAP и осцилляторы со старших таймфреймов на график MetaTrader 4, на котором вы торгуете. Облако Ишимоку с H4, дневная скользящая средняя и четверной стохастик (quad stochastic) умещаются на одном графике M15, и каждый индикатор рассчитывается на своём таймфрейме, поэтому общая картина видна без переключения графиков. Осцилляторы выводятся в отдельных блоках (доках) внизу основного окна графика, а не в подокнах. Что уме
FREE

LIGHTHOUSE — структура рынка с одного взгляда. Без перерисовки. LIGHTHOUSE определяет структуру цены по подтверждённым точкам свинга и показывает её на графике просто и наглядно. Он отвечает на три вопроса, которые задаёт себе каждый трейдер перед входом: куда идёт старший таймфрейм? Куда идёт текущий график? Где важные уровни цены?
Это инструмент поддержки решений. Он не открывает сделки и не предсказывает цену. Почему «LIGHTHOUSE» (маяк)?
Маяк показывает кораблям путь и предупреждает о скалах,

BOA Swing Levels находит swing-максимумы и минимумы на выбранном таймфрейме и показывает, где может начаться следующий пробой, где его цели и стоп и как часто такие цели достигались на истории вашего символа. УРОВНИ Уровни строятся по закрытым барам таймфрейма уровней (по умолчанию M15) ценовым каналом из N баров: swing заканчивается, когда цена выходит из канала с другой стороны, и его экстремум становится уровнем. Активные уровни пробоя: последний непробитый swing-максимум над ценой и после
FREE

Inversion FVG находит Fair Value Gap (имбалансы из трёх свечей) и торгует момент, когда они «ломаются». Если тело свечи закрывается за пределами гэпа, гэп инвертируется и становится поддержкой или сопротивлением. Когда цена возвращается к нему и отскакивает, индикатор рисует стрелку и готовые уровни Entry, Stop Loss, TP1 и TP2.
Как это работает 1. Определяется бычий или медвежий FVG и рисуется как обычная зона. 2. Закрытие тела свечи за зоной инвертирует её. 3. Первый ретест и закрытие с отбое

Crypto_Forex Indicator "Relative Drawdown Display" для MT4, полезный торговый инструмент. Это ОБЯЗАТЕЛЬНЫЙ индикатор для трейдеров, использующих системы торговли по сетке!!! - Индикатор Relative Drawdown Display показывает текущую относительную просадку или плавающую прибыль в % на вашем счете. - Встроенные оповещения для ПК и мобильных устройств с регулируемым уровнем срабатывания. - Индикатор также показывает баланс и капитал счета. - Можно расположить значения индикатора в любом углу график

TrendLadder — адаптивный индикатор тренда с мультитаймфреймовой панелью
НАЗНАЧЕНИЕ TrendLadder показывает направление тренда в виде «ступенчатой» линии. Пока рынок просто шумит, линия стоит на месте и двигается только тогда, когда цена совершает значимое подтверждённое движение. Это позволяет с первого взгляда понять, кто сейчас контролирует рынок — покупатели или продавцы — и когда тренд действительно сменился. MT5-version: https://www.mql5.com/en/market/product/203073 ЧТО ВИДНО НА ГРАФИКЕ Ст

Индикатор Crypto_Forex "Паттерн Перевернутый молот" для MT4. Не перерисовывается, не имеет задержек. - Индикатор "Паттерн Перевернутый молот" — очень мощный индикатор для торговли по Price Action. - Индикатор обнаруживает бычий паттерн Перевернутый молот на графике: синяя стрелка на графике (см. изображения). - С оповещениями на ПК, мобильном телефоне и электронной почте. - Индикатор "Паттерн Перевернутый молот" отлично сочетается с уровнями поддержки/сопротивления. Click here to see high quali

Форекс-индикатор «Ключевые круглые зоны» для MT4. - Индикатор «Ключевые круглые зоны» — незаменимый вспомогательный индикатор для трейдеров, учитывающих уровни поддержки/сопротивления. - Цена учитывает круглые уровни 1000 и 500, от которых цена часто отскакивает. - Вокруг основных уровней 1000 также имеются сильные зоны поддержки/сопротивления (по 100 пунктов в каждую сторону). - Круглые уровни 1000 и 500 также хорошо подходят для размещения тейк-профитов (перед круглым уровнем) и стоп-лосса (з

REBOUND CORRIDOR — индикатор для MetaTrader 4 Rebound Corridor строит вокруг цены адаптивный коридор и отмечает моменты, когда цена выходит за его границу и разворачивается обратно к центру. Индикатор подходит для торговли откатов и возврата к среднему значению. MT5-версия: https://www.mql5.com/ru/market/product/203386 ЧТО ВЫ ВИДИТЕ НА ГРАФИКЕ Центральная линия (ось коридора). Её цвет показывает текущий уклон рынка: голубой — бычий, розовый — медвежий, фиолетовый — нейтральный. Внутренние грани

FalconRidge — универсальный индикатор-оверлей для MetaTrader 4. Он собирает на одном графике структуру свингов, ключевые ценовые уровни, зоны волатильности, ценовой канал и панель тренда, поэтому рыночный контекст читается с одного взгляда, без десятка отдельных инструментов. MT5-версия: https://www.mql5.com/ru/market/product/203426 ЧТО ВИДНО НА ГРАФИКЕ Свинги: стрелки отмечают подтверждённые вершины (красные, смотрят вниз) и впадины (зелёные, смотрят вверх). Ломаная линия соединяет соседние св

Profit Stats Panel: статистика прибыли по парам и Magic Number Для чего Индикатор показывает прямо на графике, как торгует ваш счёт или отдельный советник. Он берёт историю закрытых сделок и собирает её в панель: прибыль по каждой паре, процент прибыльных сделок, Profit Factor, результат за сегодня, вчера, месяц и год, максимальную просадку. Рядом выводится таблица прибыли по часам сервера. Она показывает, в какое время суток советник зарабатывает, а в какое теряет. Индикатор ничего не то

Индикатор Crypto_Forex "Consolidation Bar Pro" для MT4. Без перерисовки, без задержек. - Индикатор "Consolidation Bar Pro" — очень мощный индикатор, ориентированный на прорывы, для торговли по принципу Price Action. - Индикатор обнаруживает консолидацию цены в узкой области в течение 1 бара и показывает: направление прорыва, местоположение отложенного ордера и местоположение стоп-лосса. - Бычий бар консолидации — сигнал синей стрелкой на графике (см. изображения). - Медвежий бар консолидации —

Индикатор Crypto_Forex "HTF Moving Averages Cross" для MT4. - Улучшите свои методы торговли с помощью мощного индикатора HTF Moving Averages Cross для MT4. HTF означает "старший таймфрейм". - Этот индикатор отлично подходит для трендовых трейдеров, использующих входы по ценовому действию. - Он позволяет прикреплять быстрые и медленные скользящие средние с более старшего таймфрейма к текущему графику --> это профессиональный метод. - HTF MAs Cross имеет встроенные оповещения для мобильных устрой

IMD Triangles — сканер треугольников и коридоров по трендовым линиям Чат для обсуждения роботов команды: вступить
IMD Triangles — индикатор, который ищет на списке символов треугольники и горизонтальные коридоры по трендовым линиям и рассчитывает уровни Buy Stop и Sell Stop на пробой.
Индикатор не открывает сделки и не принимает торговых решений. Он показывает фигуру и уровни, а выставлять ли ордера, решает трейдер.
Как ищутся фигуры
Верхняя линия строится по максимумам свечей, нижняя — по

Your lot may risk more than the percent you set. True Risk shows the real risk of your next trade before you open it. The problem Brokers round every lot down to a step and never go below the minimum lot. On a small account the minimum lot alone can be many times your plan. With 300 dollars and a gold stop 25 dollars away, 0.01 lot already risks 25 dollars, which is 8.3 percent and not the 1 percent you set. The spread and the commission are part of the loss as well. Most calculators show the lo
FREE

Видно, какие разрывы справедливой стоимости сменили сторону. Индикатор отмечает каждый инверсионный разрыв справедливой стоимости (IFVG) — разрыв, сквозь который свеча закрылась насквозь, — даёт сигнал и оповещение, когда цена возвращается к нему и уважает его, и проверяет на вашем собственном графике, что цена делала дальше. ICT Inversion Fair Value Gap IFVG Honest Stats находит разрывы справедливой стоимости, ждёт, пока свеча закроется сквозь один из них, и превращает его в инверсионный разрыв
FREE

MD Gold Miner Pro .System For serious Traders
Market, Specially Gold (XAUUSD)is known for its Volatility and Liquidity. Good thing is it can be Trade Easily if you know its Behaviours and Imbalance Shift. Gold Miner indicator is Based on Imbalance and Shift Strategy. No Repaint/Replace.
Pleas Get Template File, APB and Risk Tool Get Strategy Guide PDF When SmartMoney(Big Investors)Creat the Move , Market always show some Imbalance and then Reverse. Gold Miner Pro Trace it and Create the St

TIRED OF FALSE SIGNALS AND DISAPPEARING ARROWS?
Test the logic of Trend Reverting PRO MT5 completely for FREE on EURUSD (M5 & M15) and see the accuracy for yourself!
Hey trader, I know how frustrating it is to look at a beautiful chart history, only to realize the indicator changes its mind during live trading. That’s why I want you to test my algorithm completely risk-free. This is a fully functional free/demo version designed specifically for EURUSD on the M5 and M15 timeframes (works with
FREE

Smart Trade Entry MT5 Discount: The price is $200$, But now it is just $45 for one purchase, next price is 80$. - New Scanner Panel *** Contact me to send you instruction and add you in group for sharing or seeing experiences with other users. + FREE Trading Utility MT5 Description: Smart Trade Entry indicator entries with Entry, Stop Loss and Take Profit levels, a professional panel and a multi symbol, multi timeframe scanner. Smart Trade Entry finds the moments when the market goes quiet a

A Candle Range Theory (CRT) indicator for MetaTrader that marks each CRT setup at the candle close and keeps a record of how those setups played out on your symbol. Every setup is tracked until price reaches the middle of the range, crosses to its opposite edge or fails, and the outcome is written on the chart. A statistics panel counts the recent CRT buys, CRT sells and all setups together, with the share that got to the 50% line and the share that got to the opposite edge. You see what the las

Elliott Wave Auto Count labels Elliott waves automatically on four degrees at the same time: the base degree and the three degrees above it. It follows the rules and guidelines of "Elliott Wave Principle" (Frost & Prechter). For the current wave it also shows a price x time target zone and an invalidation level. This is the MetaTrader 4 version; the counting logic is the same as in the MetaTrader 5 version (sold separately).
HOW IT WORKS 1. Swings: five ATR(100)-based zigzags. Each higher degr

Dow Structure MTF shows the Dow theory trend structure of five timeframes at the same time, using the pullback low / rally high approach that is common among Japanese traders. For each timeframe you see whether the trend is up, down or range, which price would change it, and how far the current price is from that level. Only closed bars are used, so a confirmed result never changes afterwards (no repaint). This is the MetaTrader 4 version; the logic, inputs, display and alerts are the same as i

Fibo Price Time Zones combines Fibonacci price levels with Fibonacci time targets and draws them on the chart as boxes (price x time zones). It helps you organize which price areas to watch and roughly when. Where boxes from several waves and from higher timeframes overlap, the area is emphasized in three levels. Base waves are built only from confirmed swings, so a confirmed box does not move afterwards (see the conditions below). This is the MetaTrader 4 version; the calculation, inputs, defa

Time Average Lines draws four averages that are measured by time, not by the number of bars. When you switch timeframes, each line still averages the same length of time. The main line (3) averages how far price had moved from the day's open at the same clock time on past days, and the rest of today is shown as a dotted path that joins those past averages. The path is a summary of the past, not a forecast.
THE FOUR LINES - (1) Time MA: average close of the bars that started within the last N m

Auto Trendline Channel MTF draws trendlines, parallel channels and horizontal support / resistance automatically from confirmed swing highs and lows. For each line it records the touch count, close breaks, wick breaks and retests. A table shows, for the chart timeframe and two higher timeframes, the nearest line above and below the price, the distance to it and the Dow theory direction. Touch counts and break records describe what happened on the past chart. They do not tell whether price will

Sign@l12 : one indicator, many signals, your settings.
Sign@l12 puts the levels smart money traders usually mark by hand on one clean MT4 chart: liquidity, market structure, fair value gaps, supply and demand, sessions and VWAP. It keeps them on the chart while they matter, shows clearly when one is filled or swept, and alerts you when enough of them line up. It has many signals, and each one can be switched on or off and fine tuned to the way you trade.
The default settings are built for sc

Overview This indicator marks market structure on the chart of any symbol and timeframe. It finds swing highs and swing lows, labels each swing, connects the swings with a line, and marks when price closes beyond the last swing. Each event can trigger its own alert, and each alert can be switched on or off in the inputs. The indicator is a charting and analysis tool. It does not open or close trades, and it does not predict price. What is drawn on the chart Each confirmed swing receives one of
FREE

Pulse Trade Indicator MT4 Intelligent Trading. Disciplined Management. See where Pulse Trade detects a qualifying opportunity and how its initial stop reference is positioned. See signal timing and the initial stop-loss reference directly on the chart. Pulse Trade Indicator is a free MetaTrader 4 chart indicator built on the proprietary Pulse Trade research framework. Once a qualifying candle closes, it displays a clear LONG <price> or SHORT <price> label with a short entry-price reference line.
FREE

Goldcrest Indicator MT4 — Free BUY, SELL and Initial SL Levels Goldcrest Indicator MT4 is a free, standalone MetaTrader 4 indicator that marks qualifying BUY and SELL signals with their entry prices and initial stop-loss (SL) reference levels. It brings Goldcrest's multi-timeframe structural signal framework to a clean, easy-to-read MT4 chart, without executing trades. Key Features Live entry signals: clear BUY and SELL chart labels with the observed broker Ask price for BUY and Bid price for SE
FREE

The MTF Trend Dashboard indicator is a visual technical analysis tool designed for MetaTrader 4 that centralizes the trend status of all timeframes into a single separate window below the main chart. Instead of forcing you to constantly switch charts (from M5 to H4, D1, etc.) to check the macro trend, the indicator calculates real-time crossovers and maps the situation as a graphical matrix of colored bars.
Here is a detailed description of its operation and structure: Visual Structure and O

Footprint Engine MT4 is a synthetic technical analysis tool that provides an "X-ray vision" look inside a standard candlestick dataset.
Three Visualization Modes Bid/Ask (Classic): A two-sided profile displaying estimated buy and sell tick-volume distribution at each price level, reconstructed from 1-minute OHLC and tick-volume bars. Delta (Net Aggression): A focused one-sided profile highlighting the Net Delta (market buys minus market sells) reconstructed from 1-minute OHLC and tick-volu
FREE

A line-by-line port of "Range Filter Buy and Sell 5min" : original Range Filter by DonovanWall simplified version by guikroth Pine v5 update by tvenn It is published as open source on TradingView. All credit goes to those authors. The logic is exactly the original's: Smoothed range = EMA(EMA(|close − close[1]|, period), 2 × period − 1) × multiplier. Each EMA is seeded with an SMA, the same as ta.ema . Range filter: the line stays put until price moves beyond it by more than the smoothed range, t
FREE

A line-by-line port of "Chandelier Exit" , 2019-present Alex Orekhov ( everget ), distributed under the GPL-3.0 license. The original is published on TradingView. This port is released under the same license. The logic is exactly the original's: ATR = multiplier × ta.atr(length) (Wilder RMA, seeded with an SMA). Long stop = highest(close or high, length) − ATR. It only moves up while the previous close stays above the previous stop. Short stop = lowest(close or low, length) + ATR. It moves sym
FREE

Dual Scale Candles MT4 draws a second symbol's candles over your chart, with the second symbol's own prices on a separate left scale. Compare two instruments on one chart. The overlay uses a linear price mapping to fit the second symbol to the chart. Choose alignment at the first available bar of the current day or week, at the oldest drawn bar, or choose Range Fit. Day and week modes show a vertical anchor line. If the beginning of the period is not loaded, the label identifies the partial peri
FREE

Adaptive EMA Envelope
Adaptive EMA Envelope draws an exponential moving average and two symmetrical volatility bands on the main MetaTrader 5 chart. It uses the chart symbol and timeframe without symbol-specific presets.
The center line is an EMA of closing prices. The band distance uses Wilder-smoothed Average True Range. A separate True Range component allows the envelope to respond to sudden changes in a candle's range. Expansion response and contraction smoothing can be adjusted independe
FREE

A line-by-line port of "UT Bot Alerts" by QuantNomad (Pine v4, 2020). The idea is by HPotter and the first version by Yo_adriiiiaan. The original is published as open source on TradingView. All credit goes to those authors. The logic is exactly the original's: ATR is atr(c) = Wilder RMA seeded with an SMA. The built-in iATR is not used. Trailing stop follows the original nested iff / nz recursion: It ratchets up while price stays above the stop. It ratchets down while price stays below the stop.
FREE

ATR Ratchet is an ATR-based indicator similar to the indicator commonly known as Supertrend. It uses adaptive price boundaries to calculate its plotted levels. Experimental indicator: This is a test version. The default parameters have not been optimized or validated, and no particular settings or performance results are implied. Use for testing and evaluation only.
FREE

Click Anchored VWAP An interactive multi-anchor VWAP indicator that lets you place anchors directly on the chart with a single click. The Volume Weighted Average Price is calculated and drawn from the selected candle forward in real time. Click any existing VWAP line to remove it instantly. You can place multiple independent VWAPs at the same time, each with its own color, line width and style.
FREE

Matrix Trend Pro (Free Edition) Matrix Trend Pro Free is a clean, reliable, and powerful trend-following indicator designed for MetaTrader 4. Built around a customized multi-period logic and institutional volatility channels, this free edition helps you instantly identify market direction and key operational zones without cluttering your workspace. Key Features Dynamic Trend Line: Powered by a customized moving-average algorithm that tracks primary market dynamics and automatically changes st
FREE

Pattern Oracle is an all-in-one chart pattern engine for MetaTrader. It scans three zigzag levels at once, finds more than 30 harmonic, chart, continuation and reversal patterns, scores every setup and draws a complete trade plan with entry, stop-loss and two take-profit levels. A built-in teaching mode explains every pattern right on the chart. Pivots are only used once they are confirmed and every decision is made on a closed bar, so signals do not repaint . Patterns detected Reversal : Double

Quantum Edge is a machine-learning trend and signal indicator for MetaTrader. It combines a Lorentzian-distance k-nearest-neighbours classifier, a rational-quadratic kernel regression cloud and a multi-timeframe trend filter into one clean chart tool, then turns the result into clear, tiered BUY and SELL setups with ready-made stop-loss and three take-profit levels. Every signal is calculated on closed bars only . Once a label appears on the chart it stays exactly where it is: no repainting, no

MNFM Gold Conditions MT4
A read-only Gold/USD technical context indicator. It combines completed H1 and M15 candle readings with live spread information in one chart panel. It does not execute trades or estimate a probability of profit.
Dashboard - H1 direction from close versus EMA50, EMA50 versus EMA200, EMA50 slope and directional movement (+DI/-DI). - H1 ADX14 strength and whether the reading is rising or falling. - M15 momentum: three-bar close change normalized by ATR14, confirmed by RSI

Rocket Two – Entry Point Indicator for MT4 Identify Market Direction. Track Dynamic Stops. Recognize Potential Entry Opportunities. Rocket Two is a technical analysis indicator for MetaTrader 4 designed to help traders identify potential changes in market direction through dynamic stop levels and visual Buy/Sell signals. With a clear chart display and configurable parameters, Rocket Two helps traders monitor market trends and evaluate potential trading opportunities across different financial in

Velocitra Aurum Signal Pro - Gold Signals and Dashboard Non-repainting BUY/SELL signals for XAUUSD with a 6-factor confluence score, ATR-based stop loss, three take-profit targets, a multi-timeframe trend matrix and a live trade-advisor dashboard. Velocitra Aurum Signal Pro is a signal and dashboard indicator built specifically for Gold (XAUUSD). It combines trend, momentum and higher-timeframe structure into one confluence score, then gives clear BUY / SELL signals with ready-made stop loss and

The indicator provides fast and reliable alerts whenever price reaches your selected levels. Ideal for scalping,swing or day trading. It provides for multiple Support & Resistance Price Levels (Horizontal Lines) and also multiple manually drawn diagonal trendlines. Provides time delay for next alert when price level hit. Prevents repeating alerts if price moves quickly. Optional Email and push alerts to mobile phone. Excellent for monitoring direction of Live Trades. Installation.
Features:

Aurex Automatic S/R Cleaner Charts. Smarter Levels. Automatic Support & Resistance. Aurex Automatic S/R is a custom MetaTrader 4 indicator designed to automatically identify and display significant support and resistance zones directly on your trading chart. Instead of manually searching through historical price action and drawing levels yourself, Aurex Automatic S/R analyses confirmed swing highs and swing lows, groups nearby price levels together and displays the most relevant areas as clearly

TimeFrame Radar — Временной Радар Целей
Квантовый MTF-индикатор целей на основе распределения цен. Сканирует М1, М15, Н1 без запаздывания. Проецирует точные уровни разворота и Take Profit прямо на график.
TimeFrame Radar — это индикатор, который в режиме реального времени строит математически обоснованные целевые зоны волатильности, проецируя их в будущее пространство графика. В основе индикатора лежит непараметрический статистический анализ распределения цен. Радар полностью отказывается от

Follow Arrow Signals: Follow Arrow Signals plots two smoothed trend lines on the chart and marks each crossover between them with an arrow. The two lines EMAs. It is smooth and reacts quickly, with very little lag for its smoothness. It can optionally be calculated on a higher timeframe and shown on the current chart. centred triangular moving average of the weighted price (2×Close + High + Low) / 4. It gives a clean, flowing read of the price swings. The live bar uses a short weighted average,

Matrix Trend Pro Suite Matrix Trend Pro Suite is a cutting-edge, all-in-one trading system designed for MetaTrader 4. It combines multi-timeframe trend analysis, volatility channels, and automated risk management into a single, clean workspace. Whether you are looking to capture strong market trends or optimize your risk-to-reward ratio, this suite provides institutional-grade insights directly on your chart. Key Features & Capabilities Dynamic Trend Line: Powered by a customized moving-avera

Wolfram — это математический индикатор, построенный на базе дискретных клеточных автоматов . Продукт разработан специально для трейдеров, стремящихся полностью исключить запаздывание стандартных индикаторов и выявлять моменты зарождения крупных импульсов до того, как они отобразятся на ценовом графике.
Фундаментальная логика и принцип работы В основе алгоритма лежит побайтовый анализ локальной структуры рынка (цена-время) без использования классических скользящих средних и осцилляторов. И
FREE

Short description Set your risk as % of balance, % of equity or a fixed amount, drag the Stop Loss / Take Profit lines (or type the SL in points), and read the correct lot size for the symbol, the money at risk, the reward, R:R and the margin needed. Calculator only: it never places orders. Full description Sizing every trade by hand is slow and easy to get wrong, especially on gold, indices and JPY pairs where a point is worth different amounts. ClearSpec Risk & Lot Size Calculator does the mat

FVG DGT Panel [TMT] — Fair Value Gap and Inverse FVG Indicator with Live "% Left" Fill Tracking for MetaTrader 4 Version for MT4 | Non-repainting zone logic | BUY / SELL / NEUTRAL bias panel | FVG + IFVG | Optional second timeframe 1. Overview FVG DGT Panel [TMT] is a chart-window indicator for MetaTrader 4 that finds, draws and tracks Fair Value Gaps (FVG) and Inverse Fair Value Gaps (IFVG) directly on your price chart. It is a MetaTrader 4 port of the popular "Fair Value Gaps by DGT" concept

Zero Lag Real Trend Signals (MTF) — Zero-Lag Trend Line, Volatility Bands, Entry Arrows, Alerts and a 9-Timeframe Trend Panel for MetaTrader 4 Zero-lag basis | ATR deviation bands | Trend flip arrows | Pullback entry arrows | Popup alerts | Multi-timeframe panel 1. Overview Zero Lag Real Trend Signals (MTF) is a chart-window indicator for MetaTrader 4. It draws a zero-lag moving average (the "basis") surrounded by volatility bands, colors the chart according to the current trend, marks trend cha

Dual Slope Moving Averages & Support | Resistance Dashboard
Professional Institutional-Grade Indicator for MetaTrader 4 (MT4)
Transform your chart analysis with Trend Bars With Moving Averages, an elite institutional utility engineered by a professional C++ systems programmer. Designed for high-speed MQL4 execution, this indicator blends multi-slope Moving Average color-coding with a built-in, interactive Support & Resistance Reversal Dashboard.
Whether you trade Forex majors or index futures,
FREE
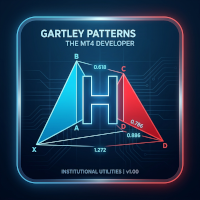
Gartley Patterns (Harmonic Scanner)
Gartley Patterns is an institutional-grade technical overlay engineered to automatically map complex harmonic price structures and swing imbalances across active execution cycles. By processing market geometry dynamically through strict multi-timeframe swing filters, this utility completely eliminates manual calculation errors and gives traders an instant visual panel of high-probability reversal zones on a single chart window.
Utilizing specialized sing
FREE

Introducing EB&SS for MetaTrader 4
MT4 Version = https://www.mql5.com/en/market/product/204221 MT5 Version = https://www.mql5.com/en/market/product/204207
Accurate and non-repainting BUY & SELL signals based on Moving Average activity. Featuring ENMA, a custom MA developed by Encrypted Eyes.
How it works: Select your MA Type: This indicator features an extensive list of Moving Averages that suits every trader. Define the MA Length: The quantity of signal diminishes as the length is increa
FREE

MTF Simple Moving Average (Free Institutional Moving Average Overlay)
The Multi-Timeframe Simple Moving Average (MTF SMA) is an institutional-grade technical utility designed to project higher-timeframe trend baselines directly onto your lower-timeframe execution charts. Developed by a C++ systems programmer specializing in high-speed MQL4 architecture, this indicator provides traders with seamless market structure visibility without requiring multiple open windows or manual chart toggling.
FREE

The EMA Trader System is a technical overlay designed to isolate trend continuation and structural balance across active execution cycles. By processing price action dynamically through multi-timeframe moving average thresholds and robust slope filters, this utility completely eliminates calculation delay and gives traders an instant visual HUD dashboard of live trade signals on a single window.
Utilizing specialized single-pass memory arrays, this system tracks multi-period EMA loops and highe
FREE

TPO Session Letters MS draws a classic Market Profile with letters (A, B, C …) for one cash session per day, directly on the MetaTrader 5 chart. By default it is set up for the Xetra session of the German index (09:00–17:30 Frankfurt time); any other session can be configured in the inputs. You enter the session in its own time zone (Frankfurt, London or New York). The indicator converts it to your broker's server time separately for every day, including the weeks when Europe and the USA change

Ваш индикатор действительно работает или только красиво выглядит на истории? Версия 1.10: новая кривая результатов на панели Кривая результатов в R после издержек: зелёная, когда индикатор выигрывает, красная, когда проигрывает; итог, число сделок и даты. Версия Pro также показывает кривую до издержек, худшую просадку и вневыборочный тест. TravaRisco Signal Checker — бесплатная и честная проверка любого индикатора MT4, который рисует стрелки покупки/продажи. Поставьте его на график, введите имя
FREE

Ribbon Pilot — трендовая лента с торговыми зонами, историей сигналов и списком наблюдения Для чего нужен Ribbon Pilot — индикатор для MetaTrader 4, который показывает направление тренда с первого взгляда, отмечает сигналы входа стрелками и сразу рисует готовый торговый план: вход, стоп и до четырёх целей. Кроме того, он ведёт статистику последних сигналов и позволяет просматривать другие инструменты, не покидая графика. MT5-version: https://www.mql5.com/en/market/product/201869 Как работает Лен

Fulcrum Value Profile - индикатор для MetaTrader 4, который строит профиль тикового объема для каждой сессии, отмечает Point of Control (POC) и зону стоимости (value area), рисует развивающиеся POC/VAH/VAL линиями, отслеживает "голые" POC (naked POC) и отмечает на закрытых барах два сетапа: возврат в предыдущую зону стоимости (правило 80%) и принятие цены за ее пределами (пробой). Индикатор никогда не открывает, не изменяет и не закрывает сделки. Быстрый старт Установите индикатор на график M5,

Хватит угадывать размер лота. TravaRisco Lot Calculator прямо на графике показывает точный лот для выбранного риска. Как это работает: Введите в панели риск в % и стоп-лосс в пунктах. Индикатор сразу рассчитает: Сумму под риском (в валюте счёта) Убыток на 1 лот при этом стоп-лоссе Точный лот, округлённый до шага объёма вашего брокера Реальный риск после округления Работает на форексе, золоте, индексах и криптовалютах, используя стоимость тика вашего брокера. Панель на английском или португальско
FREE

Ваш демо-счёт вам лжёт. На демо-счёте ордера исполняются точно по запрошенной цене. На реальном счёте - нет. Спред расширяется во время новостей, комиссии накапливаются, а проскальзывание незаметно съедает часть каждой сделки - и ничего из этого не видно чётко в истории MetaTrader. TravaRisco Real Cost Monitor показывает прямо на графике, сколько вам на самом деле стоит торговля этим символом. ЧТО ПОКАЗЫВАЕТ 1. Спред Текущий спред в пунктах, в цене и в деньгах для вашего опорного лота Средний сп
FREE

Break and Retest Hunter MT4 is a powerful MetaTrader 5 indicator designed to automatically identify support and resistance levels, breakout structures, and potential retest opportunities in real time. Bonus Indicator: After purchasing Break and Retest Hunter , contact me to receive Trade Indicator Assistant EA completely free as a bonus utility.
$65 for the next 10 copies . Next price is $120. Combining adaptive market analysis, clear BUY/SELL signals, Fibonacci-based profit targets, and a pre

Apex Patterns PRO Купите индикатор — получите Expert Advisor на его основе БЕСПЛАТНО. Самооптимизирующаяся система анализа графических паттернов и пробоев Традиционные сканеры паттернов полагаются на фиксированные входные параметры, что часто приводит к снижению их эффективности при изменении рыночной волатильности и структуры. Apex Patterns PRO разработан для адаптации к меняющимся рыночным условиям, объединяя распознавание структурных графических паттернов, фильтрацию по моментуму и статистич
123456789101112131415161718192021222324252627282930313233343536373839404142434445464748495051525354555657585960616263646566676869707172737475767778798081828384858687888990919293949596979899100101102103104105106107108109110111112113114115116117118119120121122123124125126127128129130131132133134135136137138139140141142143144145146147148149150151152153154155156157158159160161162163164165166167168169170171172173174175176177
Узнайте, как легко и просто купить торгового робота в MetaTrader AppStore - магазине приложений для платформы MetaTrader.
Платежная система MQL5.community позволяет проводить оплату с помощью PayPal, банковских карт и популярных платежных систем. Кроме того, настоятельно рекомендуем протестировать торгового робота перед покупкой, чтобы получить более полное представление о нем.

Вы упускаете торговые возможности:
- Бесплатные приложения для трейдинга
- 8 000+ сигналов для копирования
- Экономические новости для анализа финансовых рынков
Регистрация
Вход
Вы принимаете политику сайта и условия использования
Если у вас нет учетной записи, зарегистрируйтесь