Смотри обучающее видео по маркету на YouTube
Как купить торгового робота или индикатор
Запусти робота на
виртуальном хостинге
виртуальном хостинге
Протестируй индикатор/робота перед покупкой
Хочешь зарабатывать в Маркете?
Как подать продукт, чтобы его покупали
Новые технические индикаторы для MetaTrader 4 - 96

If you need more information than a few numbers in the iExposure index, this indicator is for you.
Better iExposure indicator is an improvement over the original information, such as:
Separate profit column for BUY and SELL Separate SL column for BUY and SELL Separate TP column for BUY and SEL Average Price as Horizontal Line in Chart Pip Value www.foxwave.eu
This Signal Zero Risk indicator uses Donchian channel and ATR indicators. This trend tracking system uses historical data to buy and sell. This indicator does not repaint. The point at which the signal is given does not change. You can use it in all graphics. You can use it in all pairs. This indicator shows the input and output signals as arrows and alert. Open long deals on blue arrows Open short deals on red arrows It tells you that you should quit the transaction.
Parameters Alerts - noti
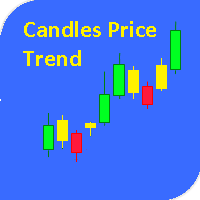
Индикатор рассчитывается по оригинальной формуле и окрашивает свечи в зависимости от общей тенденции на рынке. Синие указывают на восходящий тренд, красные на нисходящий, желтые свечи указывают остановку или возможный разворот. На сильных уровнях или при резком развороте желтые могут не сформироваться но алерт все равно предупредит вас об этом. Достоинства данного индикатора это наименьшее запаздывание, сигнал подается еще вовремя формирования разворотного бара. Настройки: Length - чувствительно

Decent Trading Tools, The ones that separate the Winners from the Losers, do not have to be expensive. This is the second out of a series of two indicators from the magic series. This indicator is Magic Correlation , this is the Middle Indicator in the screenshot. The indicator plots up to 30 instruments and visualizes events like: Time, Start, End and Duration of the events. Underlying Correlation. Trend Strength. Front Runners and Laggards. Directions. Patterns. What normally remains hidden be

Perfect Peenachi
Perfect Peenachi is a new trend based MT4 Indicator. This indicator is perfect for scalp traders as well as swing traders. It simply show you the trend where traders can get into the beginning of the trend.
Indicator Parameters
This has only two input parameters which is easy for the users to make their own customization Main Period = This period used to calculate major trend Sub Period = This period determines the lower level trend
Notes: This indicator alone is en

TRADING INDICATOR SHOWS AS JUDGING FROM the NAME BEGINNING AND the END of the THREE TRADING SESSIONS in the FOREX market : ASIAN(RED),EUROPEAN (GREEN), AMERICAN (PURPLE) COLOR.
This indicator applies a color marking on the chart of any currency pair, in the form of squares. Each square corresponds to the duration of the session and its height corresponds to the trading range.
Fibonacci ZigArcs MT4 Indicator A Signals filter with breakout + 3 S/R levels Zigzag tops and bottoms auto draw and update
the mt4 native fibonacci arcs.
The zigzag parameter can be changed by the user.
The Arcs color can be changed by the user.
This trend map provides the view of
the 360 fibo range with levels as filters and targets
To have this map around the price in a graph,
gives a safe trade, without get lost with trends,
or be trapped by false signals from indicators
125$. Сегодня скидка! Умная торговая система – новичок может просто торговать по сигналу с настройками по умолчанию. С опытом вы сможете уточнить настройки для максимальной эффективности на каждом таймфрейме и каждом торговом символе вашего MT4. Все экраны и шаблон настраиваются автоматически для комфортной торговли. Здесь открыты параметры уникального гибкого алгоритма и % успеха зависит от настроек трейдера. Доступны «Оптимизатор сигналов» и фильтры сигналов: «Filter_Stoch_M15», «Fil

Must be owned and used by Fibonacci traders who like to open position by pending order (limit order). The strategy is that you just have to wait for the automatic custom fibonacci appear then manual place your pending order, stop loss and take profit at the level of Fibonacci. The position will be opened when the price make a successful retest. Fibo Heart Indi come with pop-up alert, email and mobile push notification. Suitable for all instruments and all time frames. Don't miss the trading set

Description: The indicator predicts, with a specific probability, if the actual candlestick range will expand or contract compared to the range of a previous candle. Furthermore, the indicator shows the possible high or low of the actual candle, based on trend direction. (Recommended for Daily, Weekly, or Monthly timeframes).
KEY LINKS: Indicator Manual – How to Install – Frequent Questions - All Products How to use the indicator: Determines, with a certain probability, if there will

Mars 2 is a Oscilator indicator. I s a powerful indicator of TREND for any par and any timeframe. It doesn't requires any additional indicators for the trading setup.The indicator gives clear signals about opening and closing trades.This Indicator is a unique, high quality and affordable trading tool.
Perfect For New Traders And Expert Traders Low risk entries. Never repaints signal. Never backpaints signal. Never recalculates signal. For MT4 Only Great For Scalping Great For Swing Trading

Scalpises Assistant - полностью готовая торговая система для скальпинга на любой валютной паре. Индикатор сам анализирует рынок и дает трейдеру сигналы на открытие ордеров. Так же присылает сигналы с помощью email и push уведомлений. Данный индикатор выводит информацию в два окна. В основном окне индикатор рисует на графике сигналы в виде стрелок. В дополнительном окне индикатор показывает соотношение количества прибыльных сигналов и убыточных, показывает текущий сигнал на других таймфреймах и
Xtreme TrendLine - это мощный мощный индикатор тренда. Индикатор основан на анализе свечей и трендовых каналов. Его можно использовать на любой торговой паре или инструменте на любом таймфрейме. Этот индикатор доступен в советнике через функции iCustom и полностью настраивается пользователем.
Функции Любой торговый инструмент Любой таймфрейм Полностью настраивается пользователем Больше линий тренда на одном графике Может использоваться в советнике через функцию iCustom Можно использовать сразу

Примечание. Это описание было переведено с помощью языкового конвертера Google. Я прошу прощения, если какие-либо ошибки. Уважаемые трейдеры! Этот индикатор отображает привязанный VWAP (AVWAP) на графике. Якорные VWAP от Swing High / Low действуют как сильные поддержки и сопротивления. Они добавляют большое слияние к торговым системам. Инструкции: - В разделе Inputs выберите дату и время, с которого вы хотите привязать VWAP. - VWAP на якоре должен быть от свечи / бара, который является существе
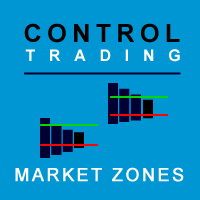
Market Zones This indicator provides an easy way to get to trade based on Gaussian statistical levels similar to the Market Profile methodology. Using an exclusive formula the indicator estimates dinamic zones where the market movements statistically remains most of the time (70%), this allows to see the market on a simplified way avoiding following non-relevant bar movements. Prices stay calm inside market zones and tend to move faster outside the zones. This is crutial to identify best zones

Индикатор ViPa-это мощный инструмент ,который работает как в трендовых,так и флетовых рыночных условиях.Отлично подходит как для новичков,так и опытных трейдеров.
1.Очень прост в использовании. 2.Не имеет входящих параметров. 3.Визуализация с помощью понятных картинок. 4.Не требует дополнительных индикаторов. 5.Работает по всем инструментам. 6.Идеально подходит для скальпинга. 7.Не перерисовывается. 8.Входы с низким риском.

Needing to drill down further on a specific bar's behavior? No need to open another chart! The Magnifying Glass indicator can show the price action of a specific bar from a lower timeframe.
Just hover the cursor over the bar in question and one can see the lower timeframe candles that actually make up the bar on the chart. The candles display scaled to the actual bar that's hovered on to the bar's immediate right.
There is no input parameters, the selections are done entirely via buttons
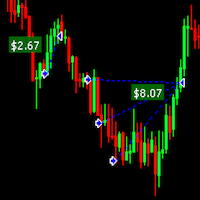
Draw Profit indicator can efficiently help those traders who want to see on the chart all closed positions output: profit or loss. If set DrawProfit on your chart managed by an Expert Advisor (EA) you will see clearly it’s performance by its profits & losses. My other products: https://www.mql5.com/en/users/hoangvudb/seller
Input parameters: Show Profit Labels : show profit of orders with a label (true/false). Profit Mode : available options: Show in currency. Show in pips. Show in currency
FREE

The M.O.D.E stands for " Multiple Oscillator Divergence Exit ". It is an indicator which signals a divergence between the price, and multiple oscillators. It is initially an exit indicator because it signals the weakening of a trend, but it could be used as an entry signal if used analytically Key Features: Check many divergences at once Non repainting Sends Alerts and Push Notifications You could load the M.O.D.E onto a single chart, and be able to see the divergences happening on multiple os
FREE

SIGNALINE INDICATOR This indicator for all pairs and all timeframes I have just completed the M5 timeframe for deep optimization EURJPY yet. EURJPY M5 Optimization ( TP=150 , SL=130 , IndicatorPeriod=6 , Mov1=22 , Mov2=48 ) (*)Added 20.05.2019 You can find this signal page below https://www.mql5.com/en/signals/583477 Other optimizasyon results will be added on this signalpage. Input Parameters: IndicatorPeriod: Default is 8. Mov1 : Default is 21. Mov2 : Default is 48.

PLEASE HELP REVIEW/ SUPPORT/ SHARE THIS OTHER INDICATOR HERE https://www.mql5.com/en/market/product/51637 AS YOU DOWNLOAD THIS ONE FOR FREE. THANKS.
The indicator was created to make trading very easy to understand. It is based on five moving average crosses and pivot points. Download the "EASY TREND" on my Product list for a more advanced and profiting trades. You can trade with this indicator alone and get the maximum out of the market. If you are a new trader, just open your chart windo
FREE

Description The indicator measures a currency’s relative strength, on different timeframes, through certain percentile spread analysis. This allows you to compare which are the strongest currency pairs, against the weakest pairs. These spreads are based on comparison against USD. KEY LINKS: Indicator Manual – How to Install – Frequent Questions - All Products How is "Clever Spread Currencies Strength" useful to you? This indicator determines a currency’s strength for different timeframe

Trend/Range Detector is an indicator that allows to determine with accuracy if the future price will range or trend in the following bars. The Indicator is drawn in a separate window where two lines are displayed : the crossing of the main signal (blue) with a moving average (orange) will determine if each zone is a trending or ranging market.
Parameters : period : the number of bars to look back (default = 20) type : type of the main signal (trend or range) (default = RangeDetector) Moving av

This indicator Super Channel Arrow and zak indicator.Indicator displays trend movement. Indicator calculates automatically line. Features
FiltPer - displays indicator channel period. FiltPer2 - displays indicator period. deviation - displays indicator channel deviation. How to understand the status: If the arrow is green, trend is up. If the arrow is red, trend is down. best FiltPer ,period timeframe M1-H1 (100);H4-MN (50) best FiltPer2, period timeframe M1-H1 (50);H4-MN (25) /////////////////

Golden Chip provides Basic Market Structure, Fibonacci, supply and Demand Zones. Letting you identify when a sell off point is approaching or whne a buy opportunity is arriving. The awesome thing about Golden Chip is that, you will see rejection levels or continuation before ANYBODY ! This indicator moves directly with price and lines up perfectly with the Chart. Some indicators would lag but NOT this one ! Golden Chip is amazing for Clean chart (Naked Chart). GOLDEN CHIP IS ONLY ON METATRADER (

VR Sync Charts это утилита для синхронизации разметки между окнами. ИНДИКАТОР НЕ РАБОТАЕТ В ТЕСТЕРЕ СТРАТЕГИЙ!!! Как получить триал версию с тестовым периодом, инструкции, обучение читайте в блоге https://www.mql5.com/ru/blogs/post/726504 . С помощью VR Sync Charts Ваши трендовые урони, горизонтальные уровни, разметка Фибоначчи будут синхронизированы со всеми графиками. Утилита позволяет синхронизировать все стандартные графические объекты в терминале MetaTrader, все Ваши тренды, линии Ганна, и

Chart Patterns Detect 15 patterns (Ascending Triangle, Descending Triangle, Rising Wedge, Falling Wedge, Bullish Flag, Bearish Flag, Bullish Rectangle, Bearish Rectangle Symmetrical triangle, Head and Shoulders, Inverted Head and Shoulders, Triple top, Triple Bottom, Double Top, Double Bottom) Use historical data to calculate the probability of each pattern to succeed (possibility to filter notification according to the chance of success) gives graphic indication about the invalidation level and

Attention!!! Do not try to test an Indicator in Tester, this is very difficult and mathematical calculation will consume all your Memory of computer. Test can be provide only on high performance computers. In Forward trading Indicator run without any problems. Better is rent product and test this calculation. After buy this indicator - BOILERMAKER, we will give for FREE our another indicator - Keltner MTF , contact us - after buy. PLEASE ONLY BUY LIFETIME LICENSE NO RENT!!! We add on MQL ma

Description: Indicator which uses trend, breakout and reversal innovative indicators to show a complete visual trading strategy, with transparent metrics. It follows simple visual patterns, which will improve your trading significantly. Support: We create great tools for the entire trading community. Most of them are free. If you believe in what we do Support Us Here. KEY LINKS: Indicator Manual – How to Install – Frequent Questions - All Products
Outstanding Features Shows c

Мощный трендовый индикатор, снабженный всем необходимым для торговли и при этом очень прост в использовании. Могу поспорить, что вы сталкивались с индикатором или советником, содержащим множество входных параметров и сложных инструкций. Индикатор полностью оправдывает свое название: входные параметры интуитивно просты и подбирать ничего не нужно — за вас все сделает нейронная сеть.
Отличия от классической версии
Добавлена мультитаймфреймовая панель, чтобы вы могли проверять тренд на других та

Стрелочный индикатор для легкого определения сметы тренда Все стрелки остаются на своём месте и после закрытия свечи не исчезают Может отправлять уведомления на ваш телефон или на емеил Работает на любых валютных парах, металлах и криптовалюте Подходит для работы с бинарными опционами Отличительные особенности Не перерисовывается; Определяет изменения тренда; Отправляет сигналы на смартфон или на емеил; Дополнительные параметры для точной настройки; Работает на всех таймфмреймах и на всех символ

This is a simple PriceTMA bands, non repaint! it can be used for a trend following system or sometimes reversals. as a main signal or a filter for others strategies, it depends on the trader main strategy. calculations for this indicator are a combined Algorithm between moving averages "MA" and average true range"ATR". good luck with your trading! i hope it is helpful Cheers
Представляю Вашему вниманию индикатор ADX-MA Arrows MTF . Индикатор построен на основе двух стандартных индикаторах Moving Average и Average Directional Movement Index . Представляет собой сигналы на вход в виде стрелок. Все сигналы образовываются на текущем баре. Максимально упрощен в использовании как для торговли исключительно одним индикатором, так и для использования индикатора в составе Ваших торговых систем. Особенностью индикатора является то, что таймфрейм индикатора можно устанавли

Strong Retracement Points Pro edition! SRP (Strong Retracement/Reversal Points) is a powerful and unique support and resistance indicator. It displays the closest important levels which we expect the price retracement/reversal! If all level are broken from one side, it recalculates and draws new support and resistance levels, so the levels might be valid for several days depending on the market! If you are still hesitating to start using this wonderful tool, you can check this link to see how ef
Индикатор RSI Symmetric с сигнальной линией на базе индикатора Buzzer. Предусмотрено отображение для старших таймфреймов. Не перерисовывает начиная с 1 бара. Параметры индикатора: RSI TimeFrame - рабочий таймфрейм (должен быть равен или больше текущего); RSI Period - без комментариев; Buzzer Period - период аппроксимации индикатора RSI Symmetric; Buzzer Average - период сглаживания аппроксимированной линии; ShowRSI - вкл/выкл отображение линии RSI Symmetric.

Scalper gun - главное оружие для торговли скальпингом и свингом, с визуализацией и алертом точек входа. Индикатор работает как в трендовых, так и в нетрендовых рыночных условиях. Подходит начинающим и опытным трейдерам. SCALPER GUN превосходит по скорости, качеству визуализации и точности входа популярные топовые индикаторы этого сайта!!!
Перед покупкой скачайте демо Scalper gun и сравните с аналогичными индикаторами для скальпинга в тестере MT4. Особенности Это готовая торговая система с ви

Voodoo Scalper Bars enjoy scalping. Color change trend changed.
Works in EURUSD/GBPUSD/XAUUSD/USOIL/US500/USDJPY/USDCAD/JP225/USDTRY/USDMXN and CFD's all pairs
The input parameters are optimized for all pairs best timeframes M1 and M5 Voodoo Scalper Bars used Bar Charts
Signal on close of a bar.
DOES NOT repaint. DOES NOT repaint. DOES NOT repaint. DOES NOT repaint.
DOES NOT recalculate. DOES NOT recalculate. DOES NOT recalculate. DOES NOT recalculate NOTE : SCALPING COLOR CHANGED FOLLOW

This indicator is just a simple ATR indicator. It calculates the Average True Range and let you tell it to show the percentage of the ATR. You will then see the % of the ATR on the screen. I like to use it to calculate different things for my trading. If I use the really great AW Recovery System ( https://www.mql5.com/en/market/product/28868 ) there is a great strategy made by the developer, where you watch the daily ATR and set the steps calculated on part of the ATR. So if you put the Part of

В основе индикатора TDI лежат следующие индикаторы: RSI, Moving Average, Bollinger bands, но основным из них нужно выделить RSI, весь расчет индикатора завязан от его значений.
Зеленая линия (линия RSI) – сглаженные простой (по умолчанию) скользящей средней значения индикатора RSI, период сглаживания 2.
Красная линия (сигнальная линия) – сглаженные простой (по умолчанию) скользящей средней значения индикатора RSI, период сглаживания 7.
Синие линии – индикатор Bollinger bands по умолчанию п
FREE

This is triangular moving average(TMS). TMS uses Simple Moving Averages for moving average calculation. If TMA periods is 5,five SMAs are used for calculation. TMA weights middle part of the price series. In other words,TMA is less noisy and more accurate .
Input Parameters TMAPeriods ----- Defines perids for TMA calculation.
ModeForTMA ----- Defines mode for TMA calculation.This is normally SMA.
AppliedPriceForTMA ----- Defines applied price for TMA calculation. ShowNormalMA -----Show norma
This indicator was specially developed to support the powerful day trading strategy described in the book "The Price in Time" . The NTZ BOX indicator automatically creates: The Day separators The No Trading Zone divided with the Green Box, the Peach Box and the Turqoise Box Extensions of the long and short Take Profit levels The Yellow Box to display the range of the Asian session The Money Manager for a perfect Position Sizing calculated on your risk percentage Using the NTZ BOX indicator will

ZhiBiTMG - это коллекция трендов и индикаторов мартингейла для всех сегментов рынка и всех циклов графиков. Многие индикаторы на рынке нарушают тренд, но утверждают, что они точные, но так ли это на самом деле? На самом деле, это не точно! Потому что рынок должен идти по тренду. Этот индикатор ZhiBiTMG дает сигнал Мартингейла на предпосылке тренда. Это будет соответствовать рыночным правилам. Инструкция по применению: Красная линия - это линия нисходящего тренда (Sell), всего три линии, по умолч

BeST_Trend Exploiter is a Metatrader Indicator based on a smart proprietary algorithm which can detect the market Median Trend while it filters out the noise providing Buy and Sell Signals and also wherever it is applicable it provides us with TP Levels of High Probability. Additionally as it has Built Inside all the necessary features it can be used as a Complete Strategy of very Impressive Results. Essential Advantages of the Indicator
Clear and Easily Understandable trading rules. Real Time
This indicator was developed to support multiple timeframe analysis. In the indicator settings, the user can set the color, width, and style of the horizontal lines for each timeframe. This way, when the horizontal lines are inserted into the chart, they will be plotted with the timeframe settings.
MTF Lines also allows visibility control of another objets like rectangles, trend lines and texts.
This is a product developed by Renato Fiche Junior and available to all MetaTrader 4 and 5 users
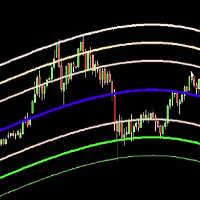
The Belkhayate center of gravity indicator is best used to confirm major turning points, and distinguish price extremes. Generally if price reaches the upper or lower levels one should expect a turn around coming soon, or at least a pull back towards the centre line if there is a strong trend. The upper and lower levels are red and green lines.
Our indicator use the same parameters as the well known trader M.Mostafa Belkhayate the inventor of the indicator, allow the use of buffers for your EA

The Signal Strength Meter is a Multi-Currency, Dual Timeframe Interactive Indicator, which calculates the strength of buy and sell signals, and displays a score for each symbol on a display board. Get a 7-Day Free Trial Version: Click Here (Full Access to The Indicator for 7 Days) Check Video Below For Complete Demonstration, and User Manual here . Key Features:
Allows you to see multiple currency signals from one chart Analyses the signals from more than a dozen classic indicators Identi

CSS " currency strength slope " is a a multi currency strength indicator that use Forex major currencies, EUR, USD, CAD, AUD, NZD, JPY, CHF, GBP. it use 28 major pairs to calculate the power of every currency using a based moving averages algorithm : you will see volatility clearly between currencies. input: MA Fast & Slow. - MA Mode : simple, exponential, smoothed, linear weighted
- Applied Price : close, open, high, low, median price, typical price, weighted price.

This indicator Super MA Pluss indicator.Indicator displays trend movement. Indicator calculates automatically line. Features
FiltPer - displays indicator period. How to understand the status: If the arrow is green, trend is up. If the arrow is red, trend is down. /////////////////////////////////////////////////////////////////////////////////////////////////////////////////////////////////////////////////// //////////////////////////////////////////////////////////////////////////////////////

Use of support and resistance in systematic trading is very subjective. Every trader has their own idea and way to plotting the support and resistance levels on the chart. KT Support and Resistance indicator take out this ambiguity out of the situation and automatically draws support and resistance levels following an algorithmic approach using a unique multi-timeframe analysis.
When launched on the chart, It immediately scan the most significant extreme points across all the available timefr

Supply Demand Zone Pro Indicator works with all products and timeframes. It is using a new calculation method, and now you can select the desired zone on any timeframe! Strongest Zones are already enabled by default This is a great advantage in trading.This indicator has a built in backtester enabled by default, just move the chart.
Supply and Demand ?
Supply is a price zone where sellers outnumbered buyers and drove the price lower. Demand is a price zone where buyers outnumbers sellers and

Индикатор внутри коробки считает количество баров и высоти коробки. фильтрация коробки происходит с помощью пробоя в пунктах или в процентах. Входные парамеиры Минмальное количество баров в нутри коробки Максимальное высота коробки Варянт величины (фылтрация коробки) величина в пунктах после пробоя коробки величина в % после пробоя коробки Максимальное количество стрелок, сигналы на покупку или на продажу.
Военная собака s-army поможет вам определить точки входа для индийской обработки. Он работает на всех перидосов. Вы можете открыть уровни ADR из настроек, дважды щелкнув по стратегии. Если вы отключите функцию ADR, она найдет больше транзакций.
В частности, в дополнение к вашей собственной стратегии, он позволяет передавать входные данные обработки через фильтр лучшего качества.
Вы хотите, чтобы уровень ADR усреднял определенный дневной объем и сигнализировал о торговле, когда количество пу

Keltner MTF (Not repaint!!!) is a channel indicator that can display price channels from different timeframes on a single chart of quotes. For example, on the H1 chart, you can see at the same time the Keltner price channel from the M15 and H4 timeframe. This tactic makes it possible to more clearly understand the tendency of price movements, to determine trading goals and points for making deals. How the Keltner MTF Indicator Works The Keltner MTF indicator can be used both - for trading in

The elite (V3) multi-indicator suite from JoaquinTrading specifically geared towards Forex & binary options, including regulated exchanges such Nadex, Cantor Exchange, and other binary option brokers.
The Probability Tool Suite Elite will provide the given win/loss outcome probabilities of up to 10 strike levels, a specific expiration duration, based on a combination of up to 16 indicators, rules, or conditions and derivative behavior (i.e. expiry, touch, touch & retrace). Using this indicat

Принцип работы индикатора. Индикатор StatChannel (SC) является развитием индикатора Bollinger Bands (ВВ). ВВ представляет собой скользящую среднюю, по обе стороны от которой откладываются среднеквадратичные отклонения std помноженные на соответствующий коэффициент. При этом, скользящее среднее с периодом усреднения (2n+1) баров всегда получается отстающим на n баров, на которые отстают и скользящие std, также просчитываемые по (2n+1) точкам. Такое сильное запаздывание с
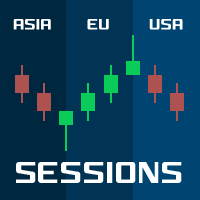
Sessions PRO is a perfect tool which divide your chart screen by 3 main market sessions: 1> asian 2> european (with division for Frankfurt and London start) 3> american
Sessions PRO is perfect especially for trading indices, where main pivot points often occurs along with new market center enters the market. With Sessions PRO you see what events happened at their exact corresponding time - European and American moves and pivot points are much more important than asian. Stop analyzing your char

We stopped creatin small tools for MT4. Our focus are on MT5. Only very useful tools maybe we will develop to MT5. New Candle Alert is a simple indicator that notify you when a new candle is formed.
You can modify the notification message that will appear for you. The alarm sound is default by meta trader program.
MT5 version: https://www.mql5.com/pt/market/product/37986
Hope you enjoy it. Any doubt or suggestions please notify on private or by comments.
See ya.
FREE
Упрощенный индикатор ZigZag. В нем отсутствуют дополнительные буферы и возможность отследить историю работы. Минимально задействует оперативную память. Внимание! Параметр Price noise - ценовой шум оказывает существенное влияние на формирование экстремумов. Параметры: Depth - глубина поиска локального экстремума в барах; Price noise - типовое значение ценового шума для текущего таймфрейма и инструмента; Backstep - глубина коррекции глобальных экстремумов в барах; On minute calc - включить/вы

This indicator alerts you when/before new 1 or 5 minute bar candle formed. In other words,this indicator alerts you every 1/5 minutes. This indicator is especially useful for traders who trade when new bars formed.
*This indicator don't work propery in strategy tester.Use this in live trading to check functionality.
There is more powerful Pro version .In Pro version,you can choose more timeframe and so on.
Input Parameters Alert_Or_Sound =Sound ----- Choose alert or sound or both to not
FREE

This indicator alerts you when/before new candle bar formed. In other words,this indicator alerts you every 1/5/30/60/240 minutes.
This indicator is especially useful for traders who trade when new bars formed.
*This indicator don't work propery in strategy tester.Use Free Version to check functionality in live trading.
Input Parameters Alert_Or_Sound =Sound ----- Choose alert or sound or both to notify you when new bar is coming.
Enable_1mBarAlert ----- Enable alert for 1 min bar
dif
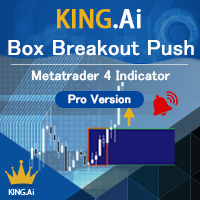
The brand new trading indicator using the box breakout strategy is presented by KING.Ai. This indicator with four-mode alerts is developed by KING.Ai ONLY. It is probably impossible that you could find a box breakout indicator like this one. It is very difficult for you to trade with the box breakout strategy as there is limited time for traders to monitor every currency. However, the box breakout strategy is very profitable. It is because when the price breaks the box, the trend will go further

This indicator weigth the actual close price with the high and the low of past values then it is computed by a simple 1 lag IIR filter before being processed by a final logarithmic algorithm to order the data.
This Indicator is perfect to find precise reversals.
Rules of Trading : 1) Be sure that the yellow line is in overbought/oversold (above +5 or under -5) The higher/lower, the better. 2) Wait for the gray line to touch the yellow line then separate from it : this is the signal. 3) If t

This indicator Master XR indicator.Indicator displays trend movement. Indicator calculates automatically line. Features
FiltPer - displays indicator period. deviation - displays indicator deviation. deviation2 - displays indicator deviation. How to understand the status: If (Timeframe M1-H1) FiltPer = 100; If ( Timeframe H4-MN) FiltPer = 5-20; ////////////////////////////////////////////////////////////////////////////////////////////////////////////////////////////////////////////////////// /

Description: The indicator shows the TDI indicator in a separate window, and with the RSI component, the indicator finds possible divergences with M or W patterns. KEY LINKS: How to Install - Frequent Questions - All Products Functions: Finds Market Makers patterns. Finds extremes or exhaustion into the market. Looks for a trend continuation. Content: TDI Indicator Divergence and M or W Signals Note 1: This indicator should only be considered as a part of any trading strategy. You shoul
Паттерн «голова и плечи» - это форма диаграммы, которая напоминает базовую линию с тремя вершинами, две внешние - близки по высоте, а средняя - самая высокая. Он предсказывает разворот тренда от бычьего к медвежьему и считается одним из самых надежных паттернов разворота тренда. Это один из нескольких верхних паттернов, которые с различной степенью точности сигнализируют о том, что тренд близится к концу. [ Руководство по установке | Руководство по обновлению | Устранение неполадок | FAQ | Все
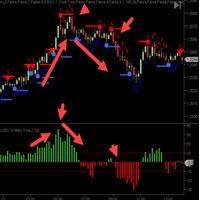
Индикатор значения силы закрытия CycleTraderPro измеряет расстояние от ОТКРЫТОГО нового бара до ЗАКРЫТИЯ этого бара. Вход - длина = 10 по умолчанию Мы добавляем эти значения вместе, возвращаясь к настройке длины. Если бы 1-й бар был плюс 10 тиков, а затем следующий бар был минус 7 тиков, то это зарегистрировало бы +3 Есть 2 способа торговать значением Close Strength: 1. Торгуйте в направлении более низких максимумов и более низких минимумов и наоборот для покупок, более высоких максимумов и боле
FREE

ZhiBi Fast Scalp - это хорошая система индексов быстрого скальпирования, сигнал колеблется в соответствии с трендом, а сигналы на покупку и продажу часто выдаются. Подходит для всех видов рынка и периодов времени.
Появляется стрелка вверх, чтобы разместить ордер Buy, стрелка вниз появляется, чтобы разместить ордер Sell;
Описание настройки параметров: [Signal_line_period]: средний период сигнальной линии малого цикла. [Trend_line_period]: средний период большой линии тренда цикла. [Alert_No_O
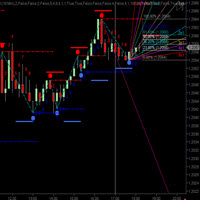
CycleTraderPro CycleWave Indicato r - это 9 индикаторов в 1.
Он использует индикаторы и шаблоны CycleTraderPro для определения циклов и других данных в режиме реального времени.
9 частей CycleWave:
Графики циклических полос и подтверждение максимума / минимума цикла в реальном времени после каждого успешного цикла максимума или минимума.
Графики Цикл Волна Цена Окна выше и ниже каждого бара, используя измененный диапазон% предыдущего бара.
Автоматически строит график Фибон
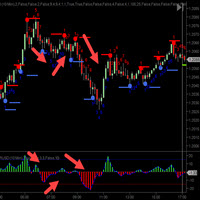
Тиковый момент CycleTraderPro измеряет количество тиков, движущихся рынком в направлении последовательных закрытий. Когда рынок закрывается выше своего уровня, он начинает считать в том направлении, сколько тиков он сдвинул. Если следующий бар находится в движении и закрывается в том же направлении, тиковый импульс будет продолжать отсчитывать, пока рынок не закроется ниже своего открытия. Затем он начнет обратный отсчет в этом направлении. Вы можете увидеть эти движения в тренде с нулевой точко
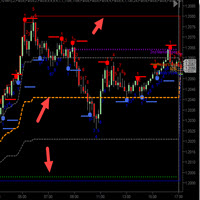
CycleTraderPro Open / High / Low / Medium OHL берет минимум и максимум дня и отображает эти значения: 1. Максимум дня (красная линия) 2. Низкий день (синяя линия) 3. 25% от минимума (серая линия) 4. 50% ассортимента (оранжевая линия) 5. 75% от минимума (серая линия) Мы ищем длинную позицию выше 50% и короткую позицию ниже Вы можете легко увидеть эти уровни по мере движения рынка. Если рынок установит новый минимум или максимум, все значения будут двигаться автоматически в зависимости от дня рынк
MetaTrader Маркет - единственный магазин, где можно скачать демоверсию торгового робота и подвергнуть его проверке и даже оптимизации на исторических данных.
Прочитайте описание и отзывы других покупателей на заинтересовавший вас продукт, скачайте его прямо в терминал и узнайте, как протестировать торгового робота перед покупкой. Только у нас вы можете получить представление о программе, не заплатив за неё.
Вы упускаете торговые возможности:
- Бесплатные приложения для трейдинга
- 8 000+ сигналов для копирования
- Экономические новости для анализа финансовых рынков
Регистрация
Вход
Если у вас нет учетной записи, зарегистрируйтесь
Для авторизации и пользования сайтом MQL5.com необходимо разрешить использование файлов Сookie.
Пожалуйста, включите в вашем браузере данную настройку, иначе вы не сможете авторизоваться.