Смотри обучающее видео по маркету на YouTube
Как купить торгового робота или индикатор
Запусти робота на
виртуальном хостинге
виртуальном хостинге
Протестируй индикатор/робота перед покупкой
Хочешь зарабатывать в Маркете?
Как подать продукт, чтобы его покупали
Новые технические индикаторы для MetaTrader 4 - 60

You have made a great decision to try this powerful indicator. The FX Turbo is a supreme forex trading indicator that will help you achieve your financial goals on currency market. In this post you will learn how to use and trade with FX Turbo Marksman indicator. Recommended Timeframe
This indicator was optimized for 1-hour timeframe but you can successfully use it on any timeframe as well. Generally speaking higher timeframes are for swing trading and and lower timeframes are for scalping.

One of the most popular methods in technical analysis used by both institutional and retail traders is determining the resistance and support levels using the so-called Pivot Point, which in turn is the starting point when defining market sentiment as bullish or bearish. Resistance and support levels are distinguished for their ability to limit the appreciation/depreciation of a certain asset. The most-commonly used technical tools for determining resistance/support levels include: prior tops/bo

Candlestick patterns have little value without the right price action context. If you’ve been studying candlestick formations, you must have heard this principle many times over. You cannot trade patterns in a vacuum. But what do we mean by context ? It is an overall technical assessment that encompasses: The market’s trend Support and resistance structure Recent price formations Volatility It seems intimidating at first, but a simple trading indicator can help us out here - the moving a
Binary Trader Master — это стрелочный индикатор, который предсказывает закрытие свечи. Он делает свой анализ только в пределах одной свечи. Когда свеча открывается, требуется несколько минут, чтобы провести анализ и предсказать закрытие свечи. Затем генерируется сигнал. Индикатор также позволяет вам применять временные ограничения, которые он может использовать для анализа, что означает, что вы можете фактически указать индикатору, сколько времени ему разрешено иметь для анализа в пределах свечи

ICT, SMC, SMART MONEY CONCEPTS, SMART MONEY, Smart Money Concept, Support and Resistance, Trend Analysis, Price Action, Market Structure, Order Blocks, BOS/CHoCH, Breaker Blocks , Momentum Shift, Supply&Demand Zone/Order Blocks , Strong Imbalance, HH/LL/HL/LH, Fair Value Gap, FVG, Premium & Discount Zones, Fibonacci Retracement, OTE, Buy Side Liquidity, Sell Side Liquidity, BSL/SSL Taken, Equal Highs & Lows, MTF Dashboard, Multiple Time Frame, BigBar, HTF OB, HTF Market Structure,
Если вы часто теряете сделки из-за того, что используете только один индикатор, попробуйте этот торговый инструмент. Этот торговый инструмент использует более одного индикатора. Я часто наблюдаю трейдеров, которые используют только индикатор RSI. Очень часто рынок перепродан, но все еще находится внизу, или рынок перекуплен, но все еще вверх. По этой причине вам необходимо использовать более одного индикатора. Представляем новую версию V 3.40 MTF PPAAF: фильтрация точной цены и действия на неск

Мультивалютный и мультитаймфреймовый индикатор Inside Bar (Внутренний Бар). В параметрах вы можете указать любые желаемые валюты и таймфреймы. Индикатор отображает последний найденный паттерн Внутреннего Бара, текущее положение цены и пробитие уровней Материнского и Внутреннего Баров. Вы можете устанавливать размер и цвет для баров и текста в ячейках. Также индикатор может отправлять уведомления при пробитие уровней. По клику на ячейке с периодом будет открыт указанный символ и период
Параметр

Готовая торговая стратегия для скальпинга на периоде M5 (таймфрейм М5), на любой валютной паре. Торговая стратегия протестирована и показала хорошую эффективность. Скальпировать по этой стратегии сможет каждый трейдер, даже начинающий. Для начала торговли Вам нужно открыть на ПК свой Metatrader4, загрузить с єтой страниці индикатор "Scalping signal indicator" и добавить его на график той валютной пары, на которой вы хотите торговать. Таймфрейм нужно выбрать М5 (на других таймфреймах индикатор не

"BUYUK SAVDOGAR" TM разработал эту стратегию для поддержки всех кто торгует на бинарных опционах.
Эта торговая система определяет состояние имбаланса на рынке на основе анализа объемов. Наиболее удобной точкой для открытия сделки является ситуация имбаланса. Торговая система самостоятельно выделяет зону имбаланса . Выдает предупреждение (alert) в нужном направлении. Условия торговли очень просты. Ждем указания направления. Открываем сделку на текущем таймфрейме по направлению. Рекомендуется ра

Cигнальный трендовый индикатор для скальпинга. Имеет три различных варианта чувствительности
Определяет смену тренда и подаёт сигналы для открытия позиций.
Имеет встроенные звуковые и визуальные оповещения о смене тренда. Может отправлять уведомления на ваш телефон или на емейл. Позволяет своевременно открывать позиции в соответствии с направленностью рынка. Работает на всех таймфреймах, на всех валютных парах, металлах, индексах и криптовалюте. Можно использовать при работе с бинарными опци
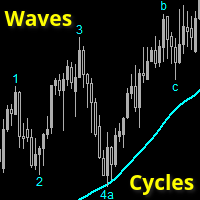
Wave and Cycle counter to give an immediate indication how far the ongoing trend has progressed.
Low numbers: trend has just started, ride the trend. Higher numbers: trend is 'older', watch for reversals
This indicator is 100% compatible with the fantastic TopDog trading strategy.
(I will NOT give any details about this Top Dog strategy)
The trend direction is determined by a SMA value (or any other MA) you can set.
Waves and cycles numbers and letters are derived from a SlowStoch setting.
Wave

Свечной таймер отображает время, оставшееся до закрытия текущего бара и формирования нового бара.
Функция прост в использовании. настроить положение, цвет и Размер шрифта . время сервера не местное.
Входные данные
- позиция - рядом с активной свечой (по умолчанию) ~ Справа вверху ~ Поднимите верхнюю часть ~ Справа внизу ~ Поднять низ - размер шрифта ~ 14 (по умолчанию) - color ~ SpringGreen (по умолчанию)
FREE

MACD Color for GOLD Use for looking moving-way of graph and checking will be buy or sell Easy for looking by see the color of trand. Red is down / Blue is up. Can to use it with every time-frame by 1. Long Trade : Use it with time-frame H1 / H4 / Daily 2.Short Trade : Use it with time-frame M5 / M15 / M 30 / H1 and you can see when you will open or close the orders by see this indicator by well by see signal line cut with color line again in opposite. and you can use this indicator for

This is a tool to measure the velocity of the price. It's completely free, you can download and use. "Way: distance of price after one tick." "Speed: price velocity after one tick." p/s: The time for the price to jump 1 tick will not be fixed, you should know this. If Way > 0, the indicator will change color to Green If Way < 0, the indicator will change color to Red || I am a 3D artist and I love math and programming! ||
FREE

MACD (short for M oving A verage C onvergence/ D ivergence) is a popular trading indicator used in technical analysis of securities prices. It is designed to identify changes in the strength, direction, momentum, and duration of a trend in a security's price.
History Gerald Appel created the MACD line in the late 1970s. Thomas Aspray added the histogram feature to Appel's MACD in 1986.
The three major components and their formula 1. The MACD line: First, "PM Colored MACD" employs two Moving

OB Breakout is alert indicator that identifies when a trend or price move is approaching exhaustion(Supply and Demand) and ready to reverse. It alerts you to changes in market movement which typically occur when a reversal or major pullbacks are about to or have happened. The indicator identifies breakouts and price momentum initially, every time a new high or low is formed near a possible Supply or Demand level point. The indicator draws in a rectangle on Supply or Demand Zones. Once price we

Key Level Key Level is a MetaTrader 4 Indicator that uses a proprietary algorithm based on Price Retracement/Breakout Method to show the Entry-Line on your trading.
Instead, it analyzes data of market and identify entry points and opportunities. (Price Retracement / Price Breakout)
It's also a trading tool that be used to practice and enhance your manual trading skills.
Key Level is an amazing tool for Scalping Trader. It also a trading tool that be used to practice and enhance your manual trad

Momentum Breakout Finder (MoBlast) is an indicator based on Volume to find the when the current pair is making breakout and when market are range bound. Oscillators Indicators like RSI, MACD that works fine for an interval of the market, it fails to generate profitable signals when the market conditions change, and hence it produces wrong signals resulting in big losses. This indicator implements an volume logic algorithm that finds the best breakout of the symbol. When an arrow signal appears
Современный индикатор паттерна Ключевой разворот. Имеет настройки таймфрейма. Можно настроить количество баров для отображения индикатора на графике. Индикатор предпочтительно использовать на часовом таймфрейме и выше, но работает и ниже. Подходит для использования с любой стратегией. Условие отображения: какой таймфрейм указали в настройках, галочку во вкладке отображение ставим там же. Для фильтра можно использовать скользящую среднюю.

Современный индикатор паттернов PinBar по торговой стратегии RAIT. Работает по тренду и без него. Имеет настройки таймфрейма для отображения. Можно настроить количество баров для отображения индикатора на графике. Используется несколько паттернов PinBar. Индикатор предпочтительно использовать на часовом таймфрейме и выше, но работает и ниже . Паттерны: PinBar, InsPinBar, PinInside. Отображаются одной стрелкой.
RumahForexID Momentum Scalping Indicator is the best momentum indicator ever created, and why is that? The indicator works on all timeframes and assets, the indicator is made after 6 years of experience in forex. You know many momentum indicators on the internet are unhelpful, and difficult to trade, but RumahForexID Momentum Scalping Indicator is different , The indicator shows wave momentum, when the market is about to trend or consolidate, all that in one simple and clear indicator!
RumahFo

Этот индикатор является супер комбинацией двух наших продуктов Advanced Currency IMPULSE with ALERT + Currency Strength Exotics .
Он работает на всех временных рамках и графически показывает импульс силы или слабости для 8 основных валют плюс один символ!
Этот индикатор специализирован для отображения ускорения силы валюты для любых символов, таких как золото, экзотические пары, товары, индексы или фьючерсы. Первый в своем роде, любой символ может быть добавлен в 9-ю строку, чтобы показат

Стратегия Owl Smart Levels | Индикатор Owl Smart Levels | MT5 version | FAQ Индикатор Fractals – это один из элементов авторской торговой стратегии Билла Вильямса . Он служит для поиска на ценовом графике точек разворота цены, а следовательно и уровней поддержки и сопротивления. Индикатор Full Fractals – это усовершенствованный Fractals, который есть в инструментарии практически всех торговых терминалов. Его отличие лишь в том, что для построения фрактала мы используем 5 свечей слева и 2
FREE

Версия MT5 | Индикатор Trend Monitor VZ | Стратегия Owl Smart Levels | Индикатор Owl Smart Levels | FAQ Волновая теория Эллиотта – это интерпретация процессов на финансовых рынках, которая опирается на визуальную модель волн на графиках цены. Индикатор Valable ZigZag отображает волновую структуру рынка , на которую можно опираться для принятия торговых решений. Индикатор Valable ZigZag более стабилен и не меняет часто свое направление подобно классическому индикатору ZigZ
FREE
Улучшите свою торговлю на основе прайс экшн с индикатором Higher Highs and Lows MT4 — мощным инструментом, который использует фрактальный анализ для определения ключевых точек свинга и выявления определяющих тренд паттернов, таких как Higher Highs (HH), Lower Highs (LH), Lower Lows (LL) и Higher Lows (HL), для четкого понимания направления рынка. Опираясь на фундаментальные принципы прайс экшн, корни которых уходят в теорию Доу начала 1900-х годов и популяризированные в современном трейдинге экс
FREE
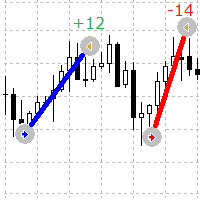
Простой но полезный индикатор, который визуализирует точки входа и выхода ордеров на графике Данный индикатор показывает как текущие открытые ордера на выбранном инструменте, так и завершенные оредра
Параметры индикатора Lines Buy color - определяет цвет для ордеров покупки
Lines Sell color - определяет цвет для ордеров продаж
Lines Width - определяет толщину линии, работает только для стили Solid
Lines style - определяет стиль линии
Lines positive profit color - определяет цвет для отображения
FREE

Индикатор R Delta RSI рисует цветную гистограмму покупки и продажи на основе пересечения быстрого RSI (период 14) и медленного RSI (период 50) вместе с сигнальным уровнем.
Гистограмма красного цвета указывает на бычий тренд (сигнал на покупку). Гистограмма зеленого цвета указывает на медвежий тренд (сигнал на продажу). Гистограмма серого цвета указывает на то, что тренд плоский или ограничен диапазоном (нет сигнала).
Этот форекс-индикатор можно использовать отдельно или вместе с другими тренд

UR-диапазоны (с формулой, используемой в системах машинного обучения)
UR Bands — это индикатор, полученный с помощью формулы, которая включает в себя рыночную волатильность, в принципе аналогичную тем, которые используются в системах машинного обучения. Это математическое представление рыночных условий предлагает точный анализ ценовых тенденций и динамики с учетом присущей финансовым рынкам волатильности. Включая волатильность в качестве переменной, индикатор обеспечивает более точное и надежн

Форекс-индикатор R Ease Of Movement Metatrader 4 представляет собой торговый осциллятор EMZ синего цвета. Это форекс-индикатор типа осциллятора, который генерирует бычью и медвежью торговую зону. Значения выше нулевого уровня считаются бычьими, а значения ниже нулевого уровня — медвежьими.
Осциллятор R Ease Of Movement сам по себе не дает хороших результатов, его нужно торговать в сочетании с техническим индикатором, следующим за трендом. К хорошим трендовым индикаторам форекс относятся: SMA,

UR PulseScalp Калиброванный торговый индикатор для скальперов, ищущих максимальное преимущество на быстро меняющихся рынках.
UR PulseScalp — передовое торговое решение для скальперов, стремящихся получить максимальное преимущество на быстро меняющихся рынках. Этот инновационный индикатор основан на научно откалиброванной формуле, которая сочетает в себе силу волатильности, денежного потока и относительной силы для создания высокоточного и надежного сигнала.
Преимущества использования UR Puls

Индикатор R Show Ticks для Metatrader 4 показывает тики вверх/вниз в режиме реального времени в главном торговом окне.
Ключевые выводы Белая стрелка — это рост. Красная стрелка — нисходящая галочка. Индикатор работает для любой валютной пары и таймфрейма по вашему выбору.
Характеристики индикатора Торговая платформа: разработана для Metatrader 4 (MT4)
Валютные пары: работает для любой пары
Таймфреймы: Работает для любого таймфрейма
Входные параметры: Входной символ, стиль, цвет.
Тип индик
FREE

Contact me after payment to send you the User-Manual PDF File. Harmonic Trading The secret is the Fibonacci. It has been proven in the markets that price always reacts to Fibonacci levels. Fibonacci levels are one of the most important indicators of price changes. Sometimes the sequence of reactions to these levels in the chart make geometric shapes, which are called harmonic patterns. The price creates harmonic patterns with its fluctuation and reaction to Fibonacci levels. Harmonic patterns c

This indicator represents a genuine momentum oscillator according to the true definition of "Momentum", and as realised by the techniques of digital filtering. ( Note : download a complete set of true momentum oscillators here ). A scholarly paper on the subject by the current developer can be found here , but in this description we shall borrow only the minimum of conceptual and mathematical framework needed. In the process, we expose some long-held myths about indicators supposedly measurin
FREE

RSI DIVERENCE INDICATOR
RSI divergence is very powerful pattern which is often used to detect a strong trend reversal. it also indicates the weakening of strong signal. So some traders want to use it as the exit criteria. This indicator works in all timeframe and send notification, alert or email to the user. It also show the Higher Highs and Lower Low Pattern with its corresponding RSI divergency. This indicator can be used in Expert Advisors as it has accessible buffers List of Inputs ______
FREE
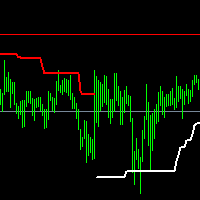
SPT is a trend indicator It is written on the basis of ATR, with clear trend lines indicating the direction in progress, Different traders' understanding of this indicator may form two different purposes Trend-based traders will conduct trend trading when the trend line changes, Respectful shock traders will carry out range trading according to the final support or resistance level marked by this indicator
The index parameters are as follows: Multiplier: multiple of ATR Period: ATR cycle. The s

The True Hero Oscillator indicator is designed for signal trading. This indicator generates trend signals.
It uses many algorithms and indicators to generate this signal. It tries to generate signals from the points with the highest trend potential.
This indicator is a complete trading product. This indicator does not need any additional indicators. This product uses 3 main indicators and many algorithms.
The indicator is never repainted. The point at which the signal is given does not c
Step into Confident Trading with DayTradingArrow v1 Imagine having a tool that gives you clarity, confidence, and control over the market. DayTradingArrow v1 is designed to highlight opportunities, filter out noise, and help you make decisions with ease. Special Bonus: Get the Forex Trend Commander Indicator absolutely free!
With two built-in systems, DayTradingArrow v1 generates a high percentage of successful trades, helping you navigate the market with confidence.
Why DayTradingArrow v1 Wor

updated hidden market support and resistance. this indicator is made for new current market that has new support and resistance that some traders struggle to see. The indicator works on all timeframes from the 1-minute timeframe to the monthly One Trading tip to use When price is at resistance and the indicator appears wait for a bearish candle to close then enter a sell trade. Same applies for a buy trade when price reaches support level, and the indicator appears wait for the bullish candle
FREE

This indicator resolves an unrecognised defect in the Commodity Channel Index Oscillator (CCI). The CCI is based on a high pass filter calculated by subtracting the p-period simple moving average of a price signal (usually typical value) from the price signal itself. Then, the result is divided by the absolute mean deviation of the same period. The frequency response of a signal minus its simple moving average is shown in the first screen shot (in Blue). (see my free indicator : Q n D Frequency
FREE
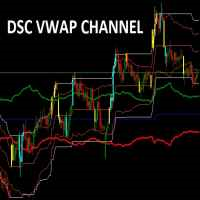
Corretora recomendada para usar esse indicador: https://tinyurl.com/5ftaha7c
Indicador usado para sabermos os pontos de suporte de resistência no gráfico. Funciona em todos ativos e timeframes.
Acerte exatamente os pontos de entradas e saídas das suas operações. SEE OUR RESULTS ON INSTAGRAM: https://www.instagram.com/diogo.cansi/ TELEGRAM GROUP = https://t.me/robosdsc More information by email dscinvestimentos@gmail.com or by Whatsapp 55-991372299
FREE

Latest Changes in 1.6 : Added Signal Modes input. Mode 1 : HPF positive go long blue, HPF negative go short red. Mode 2 : slow envelope only, HPF above upper envelope go long blue, HPF below lower envelope go short red. Mode 3 : HPF above both upper envelopes - go long blue, HPF below both lower envelopes go short red. Mode 4 : Go long blue if HPF crosses above upper slow, but fast upper should be below slow upper at the time, exit when HPF crosses below upper fast, reverse logic for short red
FREE
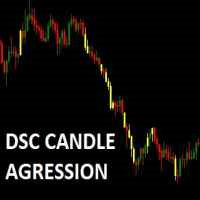
Corretora recomendada para usar esse indicador: https://tinyurl.com/5ftaha7c Indicador que pinta o candle de amarelo em pontos de muita agressão no mercado. Sempre que o mercado for se movimentar o candle irá ficar amarelo. Valido para todos ativos e todos timeframes. SEE OUR RESULTS ON INSTAGRAM: https://www.instagram.com/diogo.cansi/ TELEGRAM GROUP = https://t.me/robosdsc More information by email dscinvestimentos@gmail.com or by Whatsapp 55-991372299
FREE
AC Pivot Panel – Your Ultimate Pivot Trading Tool The AC Pivot Panel is a powerful yet user-friendly pivot point indicator designed to help traders identify key support and resistance levels with ease. Whether you’re a beginner or an experienced trader, this indicator simplifies pivot trading and enhances your decision-making process. Key Features : Interactive Selection Panel : Easily adjust pivot settings directly on the chart with a compact and intuitive panel. Multiple Pivot Methods : C
FREE

This indicator applies the biquad high pass filter to the price-chart data, and displays the filter output for the OHLC as candlesticks. The candlesticks corresponds to the actual calculations of the filter value during the formation of each price bar (not from all historical highs lows or closes). The shape of the bars therefore corresponds directly to the shape of each price bar. High pass filters are an underappreciated type of oscillator that are seldom used in technical analysis in the st
FREE

Deviation has a buy and sell input. Figure out the number to trade by. It is according to MACD. Study the values of the past for inputs to trade by. Use in uptrend or downtrend and follow the bigger trend for entry points or reversals. Use other filters or strategies to employ with the indicator for success. - is buy and + is sell. Trade on time frames according to your wish
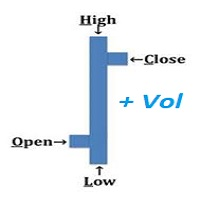
An "Intraday" indicator makes no sense anymore above H1 !! VOHLC is calculated using the following formula: VOHLC= ( Price * Volume ) / Volume Where Price= ( Open + High + Low + Close ) / 4 Volume= Tick Volume This indicator helps us to understand the current direction of the trend in the selected period. Typically, the indicator is calculated for one day, so there is no reason to use it on timeframes larger than the H1 timeframe.
This is a breakout Indicator for MT4 where you can open trades after a breakout has occurred. This indicator will draw blue boxes on the chart. You simply have to follow price until it breaks out of the box and make sure that the candle had closed above the breakout if its a buy trade and the candle must close below if its a sell trade. An alert will now pop up with suggested price entry and TP of 15 pips default. You can change TP Pis depending on your choice The indicator can trade almost any

UR Vortex
The Probabilistic UR Vortex Formula: An Accurate System for Predictive Market Analysis using Volatility and Standard Deviation Calculations. The UR Vortex indicator is a technical analysis tool that uses volatility and standard deviation calculations to predict potential tops and bottoms in a market. It measures the strength of a trend by calculating the distance between the current price and a moving average, and then standardizing this distance by dividing it by the average true

Previous Period High Low . This indicator shows the previous Day, Week, Month and Years High and Low. It's great for price action strategies. : Provides clear and visible breaks in structure. : Easy to see breakout levels. : Easy to see gaps between previous high, low levels after breakouts have occurred. The indicator works on every time frame. Multiple periods can be selected and be seen on the same chart. Every line can be customized to Your liking. Color, style and thickness. Enjoy!

Этот индикатор использует несколько индикаторов для создания прибыльных сигнальных сделок. Индикатор R Signals представляет собой полную торговую систему FX, которая печатает на графике точные стрелки покупки и продажи.
Индикатор отображается в главном окне графика MT4 в виде зеленых и красных стрелок.
Использование сигналов, генерируемых одним индикатором, может быть рискованным при торговле. Это связано с тем, что использование только одного индикатора для торговли может дать больше ложных

Доступен точный индикатор CCI.
Dashboard Trend Bar Smart Level 9TF Double CCI. Двойной CCI, то есть быстрый CCI и медленный CCI Зачем вам вторая ТПП? Использование дополнительных индикаторов убедит нас в реальной торговле 9TF Быстрая кривая CCI 9TF Медленная кривая CCI 9TF угол CCI в реальном времени 9TF значение CCI в реальном времени 9TF направление/фаза CCI в реальном времени Бар тренда 9TF Новый алгоритм расчета тренд-бара Кнопка включения/выключения. Очень удобно показывать/скрывать индик
ALL MOVING AVERAGES: Идеальный Пользовательский Индикатор для Разнообразных Стратегий Пользовательский индикатор ALL MOVING AVERAGES — это ваш незаменимый инструмент для глубокого технического анализа, содержащий впечатляющую коллекцию из более чем 31 самых популярных скользящих средних . Разработанный как для опытных трейдеров, так и для новичков, этот индикатор предлагает беспрецедентную гибкость, позволяя идеально настроить скользящие средние для широкого спектра торговых стратегий. Благодаря
FREE

Доступен точный индикатор RSI.
Dashboard Trend Bar Smart Level 9TF Двойной RSI. Двойной RSI, то есть быстрый RSI и медленный RSI Зачем нужен второй RSI? Использование дополнительных индикаторов убедит нас в реальной торговле 9TF Быстрая кривая RSI 9TF Медленная кривая RSI 9TF угол RSI в реальном времени Значение RSI 9TF в реальном времени 9TF направление/фаза RSI в реальном времени Бар тренда 9TF Новый алгоритм расчета тренд-бара Кнопка включения/выключения. Очень удобно показывать/скрывать ин

Доступен точный индикатор MACD.
Dashboard Trend Bar Smart Level 9TF Двойной MACD. Двойной MACD, то есть быстрый (MACD 1) и медленный (MACD 2) Зачем нужен второй MACD? Использование дополнительных индикаторов убедит нас в реальной торговле 9TF Быстрая кривая MACD 1 9TF Медленная кривая MACD 2 9TF угол MACD в реальном времени 9TF Значение MACD в реальном времени 9TF направление MACD в реальном времени Доступен точный индикатор MACD.
Dashboard Trend Bar Smart Level 9TF Двойной MACD. Двойной MACD

Доступен точный индикатор Stochastic.
Dashboard Trend Bar Smart Level 9TF Dual Stochastic. Двойной стохастик, то есть быстрый стохастик и медленный стохастик Зачем нужен второй Стохастик? Использование дополнительных индикаторов убедит нас в реальной торговле Кривая быстрого стохастика 9TF 9TF Медленная кривая стохастика 9TF стохастический угол в реальном времени Стохастическое значение 9TF в реальном времени 9TF стохастическое направление/фаза в реальном времени Бар тренда 9TF Новый алгоритм

Индикатор R 2EMA Color для MT4 дает надежные торговые сигналы, основанные на пересечении двух EMA.
Ключевые моменты Когда цена пересекает и закрывается выше двух зеленых EMA, это создает торговый сигнал на покупку. Когда цена пересекает и закрывается выше двух красных EMA, это создает торговый сигнал на продажу. Индикатор R 2EMA Color Forex позволяет еще проще определить, когда пора покупать и продавать.
Сигнал на покупку возникает, когда две линии EMA становятся зелеными. Сигнал на продажу в
FREE

Индикатор R Var Moving Average — это индикатор, следующий за трендом, разработанный для стойких последователей тренда.
Это довольно популярный индикатор для торговли на рынке Форекс среди трейдеров, торгующих акциями, а также товарных трейдеров, и его популярность связана с его способностью давать своим пользователям подлинные сигналы о зарабатывании денег.
Индикатор состоит из зеленых и красных точек, расположенных на синей линии. Зеленая точка указывает на бычий сигнал, а красная точка изоб
FREE

Индикатор R Wolfe Wave анализирует поведение цены и преобразует накопленные данные в мощный технический инструмент графического паттерна Wolfe Wave. По сути, графическая модель Волны R Вульфа может быть как бычьей, так и медвежьей и может помочь трейдерам открывать сделки на покупку и продажу без каких-либо запаздывающих индикаторов.
Ключевые моменты Определяет мощные паттерны Волн Вульфа Для продвинутых трейдеров Работает для любой валютной пары Стоит добавить в свою коллекцию индикаторов Это
FREE

Индикатор R Silver Trend — это торговый индикатор, следующий за трендом, который отображает текущую тенденцию непосредственно на графике активности Metatrader 4.
Он рисует два типа свечей: Синие — для бычьего движения цены. Красные для медвежьего движения цены.
Торговать индикатором R Silver Trend довольно просто даже для абсолютных новичков, и его можно использовать для скальпинга (M1, M5), дневной торговли (M5, M15, M30) и свинг-трейдинга (H1, H4, D1) валют.
Основные торговые сигналы Сигна
FREE

Индикатор R Alligator был представлен Биллом Вильямсом, он следует за трендом с помощью 3-х сглаженных скользящих средних.
По умолчанию используются следующие значения: Сглаженная скользящая средняя с периодом 13 (известная как Челюсть) Сглаженная скользящая средняя с 8 периодами (известная как Зубы) Сглаженная скользящая средняя с 5 периодами (известная как Губы)
Индикатор R Alligator уменьшает количество сделок по ложному тренду за счет использования сглаживающих скользящих средних.
Основн
FREE

Индикатор R 3MA Cross — это популярный трендовый индикатор с предупреждениями, основанными на пересечении трех скользящих средних, он состоит из более быстрой, средней и более медленной скользящих средних.
Ключевые моменты Предупреждение о покупке появится, когда более быстрая скользящая средняя пересечет среднюю и более медленную скользящую среднюю вверх.
Оповещение о продаже возникает, когда более быстрая скользящая средняя пересекает среднюю и более медленную скользящую среднюю вниз.
Как

Индикатор R Stoploss Signals основан на тренде, следующем за экспоненциальной скользящей средней.
Этот форекс-индикатор генерирует торговые сигналы на покупку и продажу в виде синих и красных линий, нарисованных на графике активности.
Линии синего цвета указывают на то, что тренд восходящий, и это сигнал на покупку валютной пары. Красные линии указывают на то, что тренд направлен вниз, и это является сигналом к продаже валютной пары. Предлагаемая линия стоп-лосса также включена в этот индикат

УР Гамма (на основе аналогичных вычислений, используемых в системах машинного обучения)
UR Gamma — это передовой инструмент финансового анализа, который предлагает новую и улучшенную версию классического индикатора WaveTrend. Включая передовые методы цифровой обработки сигналов, UR Gamma устраняет некоторые ограничения традиционных алгоритмов WaveTrend и обеспечивает более точный, надежный и динамичный подход к выявлению и измерению трендов в движении цены.
Преимущества использования УР Гамма

Индикатор R Wavy Dash преобразует ценовые данные в отличный индикатор сигналов следования за трендом, который работает для входа и выхода из сделки. Он отображается на основном графике в виде цветной сигнальной линии и может использоваться как самостоятельный торговый инструмент.
Индикатор R Wavy Dash очень надежный, легкий и не замедляет работу вашей торговой платформы.
Ключевые моменты Индикатор сигнала тренда Подходит для новичков Без перекраски Стоит добавить в свою коллекцию индикаторов
FREE

Индикатор R Inside Bar для Metatrader 4 предоставляет простые в использовании уровни ценового прорыва на основе внутренних баров.
Он работает на чистом ценовом действии и не перерисовывается, а всплывает в главном окне графика MT4 в виде двух цветных горизонтальных линий выше и ниже фактического внутреннего бара.
Зеленая горизонтальная линия действует как сопротивление, а красная — как поддержка.
Идея длинной и короткой торговли Открывайте ордер на покупку, если свеча закрывается выше зелено

Pivot Classic, Woodie, Camarilla, Fibonacci and Demark Floor/Classic Точки разворота или просто развороты полезны для определения потенциальных уровней поддержки/сопротивления, торговых диапазонов, разворотов тренда и настроений рынка путем изучения максимума, минимума и значений закрытия актива. Точки разворота Floor/Classic можно рассчитать следующим образом. Pivot Point (P) = (High + Low + Close)/3 S1 = P * 2 - High S2 = P - (High - Low) S3 = Low – 2*(High - P) R1 = P * 2 - Low R2 = P + (H
FREE

Prometheus Trade Engine is an indicator that combines price action, ratio based indicator with custom indicators& other lagging indicators to create this leading indicator that has a multi-timeframe approach to trading so that you are able to see what other timeframes are doing all in one chart and give you high probability trade setups to assist you to make a prediction on what is MOST likely to happen in the market going foward
Chart Features 1. Reversal Zone
It is the rectangular box on you

This indicator does not process the price chart data and does not provide trading signals. Instead, it is an application to compute and display the frequency response of many conventional indicators. Moving averages like the SMA, LWMA and EMA, and oscillators like the MACD, CCI, Awsome Osc, all have the form of digital filters. Electronic engineers use a special method to characterise the performance of these filters by studying their frequency response. Two important quantities of the freque
FREE
[ MT5 Version ] [ Kill Zones ] [ SMT Divergences ] How to trade using Order Blocks: Click here Experience the ultimate in trading precision with the Order Blocks ICT indicator, designed to empower traders with unparalleled insights into market dynamics. This advanced tool leverages order flow and volume analysis to reveal crucial buying and selling pressures driving price action. Why Choose Order Blocks ICT? Unleash Market Insights: Order Flow Analysis: Discern buying and selling pressure

YOU CAN NOW DOWNLOAD FREE VERSIONS OF OUR PAID INDICATORS . IT'S OUR WAY OF GIVING BACK TO THE COMMUNITY ! >>> GO HERE TO DOWNLOAD The system is a free open source pine script originally published on TradingView by everget . It was converted to Mt4 by Forex Robot Makers. This system is a popular trend indicator based on ATR ( Average True Range ) , Moving Averages and the Donchian channel .
System BackGround
ATR The average true range is an indicator of the price volatility of an asse
FREE
MetaTrader Маркет - единственный магазин, где можно скачать демоверсию торгового робота и подвергнуть его проверке и даже оптимизации на исторических данных.
Прочитайте описание и отзывы других покупателей на заинтересовавший вас продукт, скачайте его прямо в терминал и узнайте, как протестировать торгового робота перед покупкой. Только у нас вы можете получить представление о программе, не заплатив за неё.
Вы упускаете торговые возможности:
- Бесплатные приложения для трейдинга
- 8 000+ сигналов для копирования
- Экономические новости для анализа финансовых рынков
Регистрация
Вход
Если у вас нет учетной записи, зарегистрируйтесь
Для авторизации и пользования сайтом MQL5.com необходимо разрешить использование файлов Сookie.
Пожалуйста, включите в вашем браузере данную настройку, иначе вы не сможете авторизоваться.