Смотри обучающее видео по маркету на YouTube
Как купить торгового робота или индикатор
Запусти робота на
виртуальном хостинге
виртуальном хостинге
Протестируй индикатор/робота перед покупкой
Хочешь зарабатывать в Маркете?
Как подать продукт, чтобы его покупали
Новые технические индикаторы для MetaTrader 4 - 104
Highly configurable Momentum indicator.
Features: Highly customizable alert functions (at levels, crosses, direction changes via email, push, sound, popup) Multi timeframe ability Color customization (at levels, crosses, direction changes) Linear interpolation and histogram mode options Works on strategy tester in multi timeframe mode (at weekend without ticks also) Adjustable Levels Parameters:
Momentum Timeframe: You can set the lower/higher timeframes for Momentum. Momentum Bar Shift
FREE
Highly configurable Demarker indicator.
Features: Highly customizable alert functions (at levels, crosses, direction changes via email, push, sound, popup) Multi timeframe ability Color customization (at levels, crosses, direction changes) Linear interpolation and histogram mode options Works on strategy tester in multi timeframe mode (at weekend without ticks also) Adjustable Levels Parameters:
Demarker Timeframe: You can set the lower/higher timeframes for Demarker. Demarker Bar Shift: Y
FREE
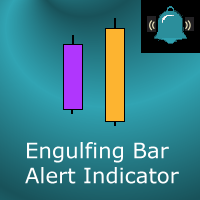
This indicator marks Engulfing Bars (bars with a higher high and a lower low than the previous bar) on your chart. It will also send alerts when one forms, including via e-mail or push notification to your phone . It's ideal for when you want to be notified of an engulfing/outside bar set-up but don't want to have to sit in front of your chart all day. You can configure all the settings including:
Whether it should be "range engulfing" (so high is higher than previous bar and low is lower than
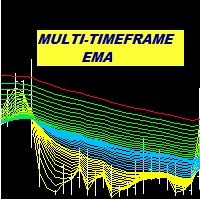
Multi Period EMA A trend indicator based on the exponential moving average. Keeping track of multiple EMA is a more effective way of detecting possible trend development. This indicator allows for the setting of as many as 6 different EMA periods. Unused period parameters can be set to zero to exclude the particular EMA from being displayed on the chart.
Features Up to 6 EMA displayed on chart. Option to select high EMA and Low EMA in order to detect crossovers Alert in event that change in s

Super Trend Lines is an indicator that calculates trends using a set of channels and using a set of algorithms. This indicator helps to find trend return points. It generally represents an oscillator. This trend tracking system helps the investor to understand small or large trends and determines the direction according to it.
Time frames: M15, M30, H1
Parameters Period : general trend period. Bar : bar calculation setting Channel_Cal : channel calculation period. The smaller the value here,

Dynamic Support and Resistance is the collective work of three traders with several decades worth of experience trading all financial markets. The math behind these levels is unlike anything ever produced in the public trading world. Dynamic S&R is a tool to measure ranging markets, trending markets, and aids in catching the turns of the trends when combined with Dynamic PriceWraps. Dynamic S&R can be used for spot FX, futures, stocks, and is incredibly useful in options trading for all produ
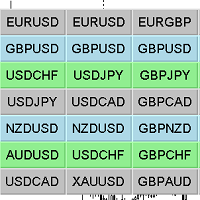
Индикатор быстрой навигации по финансовым инструментам. При нажатии на кнопку, происходит переход на график финансового инструмента, название которого было написано на кнопке.
Другими словами, индикатор открывает или разворачивает уже имеющееся окно графика, если такого графика нет, индикатор его откроет если он существует в обзоре рынка данного терминала.
Для каждого графика можно настроить наименование финансового инструмента, цвет текста и цвет фона, всего можно настроить 42 кнопки. Индик

Fibonacci retracement and extension line drawing tool
Fibonacci retracement and extended line drawing tool for MT4 platform is suitable for traders who use golden section trading
Advantages: There is no extra line, no too long line, and it is easy to observe and find trading opportunities
Trial version: https://www.mql5.com/zh/market/product/35884
Main functions:
1. Multiple groups of Fibonacci turns can be drawn directly, and the relationship between important turning points

Структура индикатора. Индикатор Cunning crocodile ( Хитрый крокодил ) состоит из трех скользящих средних (примененных к цене Median price = ( high + low )/2 ) : обычной MA ( SMA , EMA , SMMA , LWMA ) или среднего < X > процесса X и двух ее обобщений <X F >=<X/<X>>*<X> и <X S >=<X*<X>>/<X>, берущихся с тем же периодом усреднения. Все три кривые пересекаются в единых точках, что (такое пересечение, при котором хитрый крокодил,

Range Volume Profile Индикатор Range Volume Profile показывает распределение сделок по ценовой шкале в заданном
временном диапазоне. Данный инструмент упрощает анализ рыночной ситуации и помогает находит ценовые уровни где сидит крупный игрок. Особенности:
Показывает распределение тиковых объёмов относительно цены. Показывает распределение реальных объёмов относительно цены. Если ваш брокер предоставляет их. Можно выбирать участок графика, который нужно исследовать. При определённых настрой

Индикатор показывает текущий тренд. Он отлично "чувствует" смену тренда. Стрелка-сигнал после закрытия бара не исчезает и не перерисовывается. Открывать ордер в сторону стрелки можно уже на следующем баре после появления сигнала. Пользование индикатором интуитивно понятно. При появлении первой стрелки бирюзового цвета - предпочтительны покупки. Красного цвета – продажи. Использовать индикатор рекомендую на таймфрейме H1. При появлении первой стрелки противоположного цвета и закрытии часового бар

Pips collector - этот индикатор представляет из себя готовую механическую торговую систему. Pips collector сам анализирует рынок на 57 характеристик, определяя направление тренда, волатильность, агрессивность, сопротивление и поддержку. После этого Pips collector выводит на экран сигналы для открытия ордеров на покупку или продажу. Интерпретация торговли с Pips collector очень простая и подходит как для профессиональных трейдеров, так и для новичков. Так же индикатор Pips collector может прис

Очень полезный индикатор для торговли, который показывает текущую нагрузку на депозит. Нагрузка рассчитывается по формуле (маржа/баланс)*100%. Если нужно , индикатор подает звуковой сигнал, когда нагрузка на депозит превышает определенный уровень. Нагрузка отображается общая, с учетом все открытых позиций. Параметры индикатора: Color - цвет текста. Font size - размер шрифта. Font family - семейство шрифта. Right - отступ справа. Bottom - отступ снизу. Max load - максимальная нагрузка, при котор
FREE
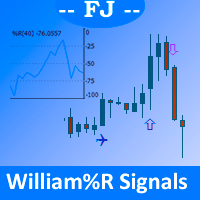
It draws on the main price chart icons indicating clearly the different crosses produced by the William% R oscillator signal as it passes through the overbought, oversold, and intermediate lines.
Allowed customization: - Position of overbought/oversold lines - Your prefered icons - The color of each icon - Periods to use in William% R
Parameters: - WilliSignalsOn_Off: It allows you to hide/show the indicator without having to delete / re-add and configure this indicator - WilliPeriods: Perio
The ' MTF MA Cross ADV ' indicator comes from MTF Moving Average Cross with an advanced algorithm . Fast & slow m oving average crosses are used for generating up to four arrows either at bar 0 or bar 1.
Key Features Advanced algorithm to detect changes in standard moving average cross w/arrows. There are many settings which can all be non-repaint for signals at a new bar and at bar 0. NewBarConfirm as 'true' means notifications come from bar 0 & bar 1(false). PC Alerts, Email notifica
Highly configurable Williams %R indicator. Features: Highly customizable alert functions (at levels, crosses, direction changes via email, push, sound, popup) Multi timeframe ability Color customization (at levels, crosses, direction changes) Linear interpolation and histogram mode options Works on strategy tester in multi timeframe mode (at weekend without ticks also) Adjustable Levels Parameters:
Williams %R Timeframe: You can set the current or a higher timeframes for Williams %R. William
FREE
Highly configurable Osma indicator.
Features: Highly customizable alert functions (at levels, crosses, direction changes via email, push, sound, popup) Multi timeframe ability Color customization (at levels, crosses, direction changes) Linear interpolation and histogram mode options Works on strategy tester in multi timeframe mode (at weekend without ticks also) Adjustable Levels Parameters:
Osma Timeframe: You can set the lower/higher timeframes for Osma. Osma Bar Shift: Y ou can set
FREE

PRO VERSION This free indicator change timeframe of charts(up to 3) at the same time,by clicking a label. If you click the label(shown below),timeframe of charts will change. If you click again,timeframe of charts restore.
You can change the position of the label.
You can change charts up to 3 charts(a paid version enables up to15 charts). You can add second,third timeframe changer label.
This indicator is very useful for speed trading.
There is a more powerful PRO VERSION . The paid v
FREE

This indicator change timeframe of charts(up to 15) at the same time,by clicking a label. If you click the label(shown below),timeframe of charts will change. If you click again,timeframe of charts restore.
You can change the position of the label.
You can change charts up to 15 charts. You can add second,third timeframe changer label.
This indicator is very useful for speed trading.
*This indicator don't work propery in strategy tester.Use Free version to know the real potential.
Inp

The CCI Standard/Hidden Divergence indicator will plot the Commodity Channel Index (CCI), and will also identify and plot standard (regular) divergences between the indicator and the price action, OR it can be set to identify and plot hidden (reverse) divergences between the indicator and the price action. The divergences themselves are implemented as lines (default green for bullish divergence and red for bearish divergence) drawn in the indicator pane. If activated via the Inputs dialog, alert

The MACD Standard/Hidden Divergence indicator will plot the MACD, and will also identify and plot standard (regular) divergences between the indicator and the price action, OR it can be set to identify and plot hidden (reverse) divergences between the indicator and the price action. The divergences themselves are implemented as lines (default green for bullish divergence and red for bearish divergence) drawn in the indicator pane. If activated via the Inputs dialog, alerts will be generated when

The RSI Standard/Hidden Divergence indicator will plot the Relative Strength Index (RSI), and will also identify and plot standard (regular) divergences between the indicator and the price action, OR it can be set to identify and plot hidden (reverse) divergences between the indicator and the price action. The divergences themselves are implemented as lines (default green for bullish divergence and red for bearish divergence) drawn in the indicator pane. If activated via the Inputs dialog, alert

The Momentum Standard/Hidden Divergence indicator will plot the momentum, and will also identify and plot standard (regular) divergences between the indicator and the price action, OR it can be set to identify and plot hidden (reverse) divergences between the indicator and the price action. The divergences themselves are implemented as lines (default green for bullish divergence and red for bearish divergence) drawn in the indicator pane. If activated via the Inputs dialog, alerts will be genera

The Stochastic Standard/Hidden Divergence indicator will plot the stochastic (%K and %D), and will also identify and plot standard (regular) divergences between the indicator and the price action, OR it can be set to identify and plot hidden (reverse) divergences between the indicator and the price action. The divergences themselves are implemented as lines (default green for bullish divergence and red for bearish divergence) drawn in the indicator pane. If activated via the Inputs dialog, alert

Ultimate solution on price action trade system Built Inside One Tool! Our smart algorithm tool will detect the price action pattern and alert upon potential with entry signals and exit levels including stoploss and takeprofit levels based on the time setting on each market session. This tool will also filters out market currency strength to ensure our entry are in a good currency conditions based on it's trend.
Benefit You Get
Easy, visual and effective price action detection. Gives you th

This indicator displays Super Power Beeta trend movement.Indicator is version 2 . Features Multiplier - displays multiplier movement. Multiplier2 - displays multiplier2 movement. Trend - displays indicator trend 1 and trend 2 (true/false).
Background:color - displays background color (true/false).
separate_window - displays trend separate window.(0-1....) separate_window2 - displays trend (background color )separate window.(1-2....) X - move the trend left and right.
Y - move the trend up

Let´s try to make some real money!
Call me profit addicted. I thought why not try to make THE dream come reality. With discipline, a clear strategy and this indicator I focus on entering the perfect trades. This indicator is very easy to use as you will get perfect entry points for Put or Call trades.
The arrows are calculated with: - Momentum parameters - Candle stick patterns - Fundamental Price action
We recommend to combine it with Parabolic, ZigZag or Elliot waves indic

Extended VERSION
Ultimate solution on price action trade system Built Inside One Tool! Our smart algorithm tool will detect the price action pattern and alert upon potential with entry signals and exit levels including stoploss and takeprofit levels based on dynamic and unique calculation. This tool will also filters out market currency strength to ensure our entry are in a good currency conditions based on it's trend.
Benefit You Get
Easy, visual and effective price action detection. Gi

Представляем Entry Point , мощный технический индикатор, предназначенный для предоставления уведомлений о покупке/продаже. Этот индикатор анализирует 5 скользящих средних, CCI, RSI, Stochastic, индикаторы Билла Вильямса и индикаторы объема на 3 разных таймфреймах для генерации точных сигналов. Он предлагает неограниченные возможности настройки для профессиональных трейдеров, позволяя им адаптировать индикатор на основе своего опыта и стратегий. Точка входа отправляет сигналы пользователям че

Индикатор PriceRunner предназначен для определения тренда без эффекта случайных скачков цены. Он использует серию цен и несколько скользящих средних для уменьшения шума. Работает на нескольких таймфреймах, даже на М1. Для повышения эффективности рекомендуется использовать параметры по умолчанию для графики M1 (см. скриншоты). Вы можете изменить настройки для других таймфреймов. Пример использования этого индикатора: если золото пересекается с синим вниз, а золото и синий находятся под серым, эт

Каналы + Индикатор S & R (CSRI)
Индикатор определяет 3 канала (Большой, Средний, Малый) в зависимости от диапазона в барах на текущем периоде времени и пары / инструмента. Он может определять уровни Поддержки и Сопротивления в любом выбранном канале. Кроме того, для Большого канала могут быть построены уровни Фибоначчи. Все линии и уровни могут быть настроены по цвету и ширине.
Определить уровни Поддержки и Сопротивления для любого канала:
IdentifySupportAndResistanceLevels - определить уров

BinaryUniversal - сигнальный индикатор для бинарных опционов и форекс. В своей работе индикатор использует сложный алгоритм генерации сигналов. Прежде чем сформировать сигнал, индикатор анализирует волатильность, свечные модели, важные уровни поддержки и сопротивления. В индикаторе есть возможность настроить точность сигналов, что дает возможность применить данный индикатор как для агрессивной, так и для консервативной торговли. Индикатор устанавливается обычным образом, работает на любом времен

The arrows are calculated with: - 2 Parabolic parameters - 2 ADX parameters - 4 Stochastic parameters
We recommend to combine it with Parabolic, ZigZag or Elliot waves indicator. Always trade the trend!
If you make sure to draw your trend lines and support/resistance zones you will just have to wait for the signal to appear. Take the trade. For Binary Options it is advisable to set the expiry time to 5-15 min in M1 chart. THIS INDICATOR IS ZERO REPAINT
Best assets to trade: -

UniversalFiboChannel - универсальный индикатор, строит торговый канал по уровням Фибоначи. Данный индикатор является полноценной торговой канальной стратегией. Индикатор устанавливается обычным образом и работает с любым торговым инструментом. Параметры HelpBasisTF = "M:43200;W:10080;D1:1440;H4:240;H1:60" - подсказка для параметра BasisTF
BasisTF = 1440 - базовый период для расчета уровней Фибоначи DisplayDecimals = 5 - количество знаков после запятой цены торгового инструмента Преим
FREE

Smart Reversal Signal - это профессиональный индикатор для платформы MT4, разработанный группой профессиональных трейдеров.
Этот индикатор подойдет для работы на Forex и на бинарных опционах.
Приобретая данный индикатор вы получаете: Отличные сигналы индикатора. Бесплатную поддержку по продукту. Регулярные обновления. Возможность получать сигналы различными способами: алерт, на телефон, по почте. Можно использовать на любом финансовом инструменте(Forex, CFD, опционы) и периоде.
Параметры
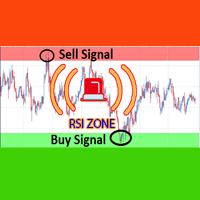
Over BS RSI Zone Alarm is an oscillator indicator which based on RSI oversold/overbought indicator.
It'll alert signal on next bar open with an audio or pop up on the chart
When RSI above 70 that the signal oversold alert.
And RSI below 30 that the signal overbought alert.
The indicator can customize Level of Relative Strength Index. Messages/Sounds (Notifications and sound settings) RSI_Period - Period of Relative Strength Index.
Level_Overbought_Zone - Level of Relative Strength Index f
Highly configurable Macd indicator.
Features: Highly customizable alert functions (at levels, crosses, direction changes via email, push, sound, popup) Multi timeframe ability Color customization (at levels, crosses, direction changes) Linear interpolation and histogram mode options Works on strategy tester in multi timeframe mode (at weekend without ticks also) Adjustable Levels Parameters:
Macd Timeframe: You can set the lower/higher timeframes for Macd. Macd Bar Shift: you can set the
FREE

Double Exponential Moving Average ( DEMA ) is a moving average (MA) that gives the most weight to recent price data.Like exponential moving average (EMA), it is more reactive to all price fluctuations than a simple moving average (SMA) and so DEMA can help traders to spot reversals sooner, because it is faster responding to any changes in market activity. DEMA was developed by Patrick Mulloy in an attempt to reduce the amount of lag time found in traditional MAs. ( TASC_Feb. 1994 ). DEMA can al
FREE

The End Point indicator is an indicator that predicts that the tired trend should now return. In this indicator law, we can easily understand that the trend which is in constant or continuous decline should now be reversed. to With these signals the user starts the trades.
Our Popular Products Super Oscillator HC Cross Signal Super Cross Trend Strong Trend Super Signal Suggestions Recommended time interval: M30, H1 Run with at least 20 pairs. Operate with a maximum of two pairs. For every coup
FREE

This indicator super indicator.Indicator displays trend movement. Indicator calculates automatically bars Features
FiltPer - displays indicator period. Multiplier - displays indicator multiplier. How to understand the status: If the indicator bar is higher , trend is up. If the indicator bar is lower , trend is down. IIIIIIIIIIIIIIIIIIIIIIIIIIIIIIIIIIIIIIIIIIIIIIIIIIIIIIIIIIIIIIIIIIIIII
Алгоритм индикатора строит уровни поддержки и сопротивления. На основе этих уровней индикатор ищет ложный пробой одного из уровней. Если условие выполнено индикатор ждет возврат в зону ложного пробоя. Если возврат произошел - индикатор выдает сигнал. Индикатор не перерисовывается. Встроен звуковой сигнал. Доступна информационная панель о торговле. Есть возможность автоматически вычислять уровни Stop Loss и Take Profit. Входные параметры Set Interval Draw Arrow - интервал уровней поддержки и сопр

The Trend Confirm indicator is a set of indicators and a set of channel movements. The purpose of the indicator is to find a healthy trend and designed to confirm these trends. There are two channels in the trend. The blue channel line is used to confirm the ascending trend. The green trend line is used to confirm the downtrend.
How to use? If the trend line in the indicator goes above the blue channel line, the trend is starting to rise. If the trend line within the indicator falls below the

Информационная панель, которая выставляет уровни покупки продажи и цели для профита на текущий день. Уровни рисуются согласно движению валюты за вчерашний день. Панель вмещает в себя информацию о валютной паре, тенденции на рынке, время до закрытия бара, управление капиталом, рекомендуемый лот, профит в пунктах, а также уровни для покупки и продажи инструмента. Для заключения сделок использовать только отложенные ордера на пробой. Входные параметры Lots - установить текущий лот Risk - риск в про
FREE

3S indicator designed for trend detection without the effect of accidental price leaps. It uses Price Series and a few moving averages for noise reduction. It works on multiple timeframes, even M1. To increase effectiveness, it is recommended to use default parameters for M1 graphic (see screenshots). You can change settings for other time frames. Example of using this indicator : If Gold cross to Blue down and both gold and blue under the Gray , it could be a promising sell signal .
To

The trend is your friend! This is what this indicator is all about. Follow this famous saying and be safe.
Characteristics:
Buy/Sell signals fixed on the close of a bar. Works on all symbols and all timeframes. Clear visual market trend laser line, Buy/Sell signal arrows, market strength meter, TP1 & TP2 boxes. Visual signals when to enter, when to exit the market. No repainting. Compatible with Flexible EA for trading automation. (Ask for a free set file optimized to perform 2010-2018) Para
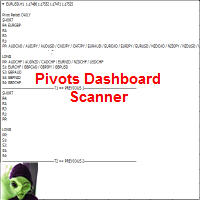
This indicator scans and displays where the currency pairs currently are in reference to Pivot Levels. You have the option to choose between Daily, Weekly, Monthly, Quarterly, and Yearly pivots. Standard Pivot Levels and Camarilla Pivot Levels formulas came from the book Secrets of a Pivot Boss: Revealing Proven Methods for Profiting in the Market by Frank O. Ochoa. It also includes all types of alert options.
Features Attach to one chart and scans all the currency pairs configured and visible

This is the FXTraderariel TrendTrader .It analysis the trend and displays it, due to changing the changing the candle color. It took me over 12 Year to develop this system. But it shows the market perfect. Very easy to follow, even for beginners.
It works on all Pairs and all Timeframes (however we advice only pro traders to trade smaller Timeframes, novice traders should stick to higher TF like H4 and D1).
Depending on the settings it and trading style, it can be used for scalping or long-t
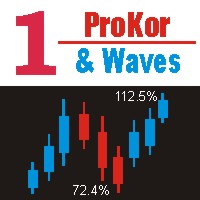
MT4. Показывает процент коррекции цены к предыдущей волне, процент превышения цены над предыдущим пиком или впадиной волны. Помечает волны. Диапазон волн регулируется параметром на графике, путём ввода в поле цифры от 5 до 300. Рисует уровни Фибоначчи от вершин или впадин предыдущей волны, а так же в противоположную сторону от текущей вершины или впадины волны.

A trending market is one in which price is generally moving in one direction. ... When trading a trend-based strategy, traders usually pick the major currencies as well as any other currency utilizing the dollar because these pairs tend to trend and be more liquid than other pairs.
Best Trend Indicator That Tells You the Direction of the Trend
Trend MagicX_v1.1 displays the trend direction, duration, intensity and the resulting trend rating for all time frames in real time. You'll see at

MultiTimeframe (MTF) Support and Resistance Indicator is use to measure last 320 bar (user input) of support and resistance of the dedicated timeframe. User can attached this indicator to any desire timeframe.
Features: User input desire timeframe (default Period H4) User input numbers of last bars (default 320 bars) User input measurement of last HH and LL (default 10 bars) Line styling and colors. MT5 version: https://www.mql5.com/en/market/product/31983
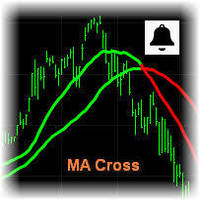
MA Cross Signal Alerts_v1.0 The Moving Average Cross displays a fast and a slow moving average (MA). A signal arrow is shown when the two MAs cross. An up arrow is displayed if the fast MA crosses above the slow MA and a down arrow is given if the fast MA crosses below the slow MA. The user may change the inputs (close), methods (EMA) and period lengths.
When two Moving Averages cross the indicator will alert once per cross between crosses and mark the cross point with down or up arrow.
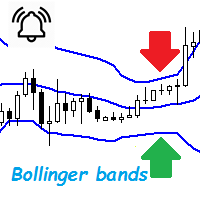
Bollinger Bands are a very common indicator in the world of online trading, this indicator gives very useful information for many forex trading strategies, but also for all other styles of strategies such as scalping and even trading medium and long term. It is calculated from a moving average calculated over n periods (20 by default). From this moving average, a standard deviation calculation is defined. By adding this standard deviation in real time to the basic moving average, we obtain the u

The Sensitive Volume indicator is an indicator designed to generate trading signals. The purpose of this indicator is to generate signals from the highest probability of trading. Using a number of price movements and a set of indicator properties to generate these signals.
Easy to use, simple and understandable to the user. With alert features, user signals can be reached quickly. Visually the user can easily recognize the signals. This indicator will not repaint. Parameters Trend_Period - p
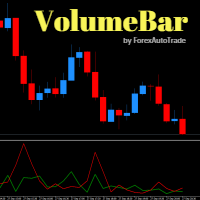
VolumeBar Hola Traders. This indicator will show line graph of each bar's volume. Indicates the volume of purchases and sales of each bar's volume. You can use this indicator with every currency pairs and every time frame. The display parameters are color customizable.
Original Parameters: ColorGreen - buy volume. ColorRed - sell volume.
Thanks Traders
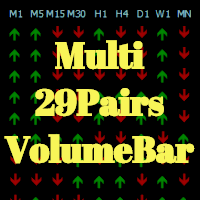
Hola Traders. This indicator Developed from VolumeBar indicator. By the signal show from the last bar complete. Show 9 time frame and 29 pairs currency. XAU,USD,EUR,GBP,AUD,NZD,CAD,CHF,JPY
The display parameters are color customizable. Original Parameters: ColorGreen - buy signal. ColorRed - sell signal. Font29PairsColor - color of font 29 pairs currency.
Thanks Traders

Oscillator Trend indicator macd, divergence and a set of algorithms is a trend indicator. The aim of the indicator is to generate signals with high reliability using the above-mentioned calculations.
The indicator is very easy to use. Red arrows give sale signal. The Aqua arrows give a buy signal. Thanks to the alert feature, you can easily reach the signals. It works without any setting. It can be used in all time frames. The recommended time frames are m15, m30 and h1.
Parameters Trendline

The MESA Spectrum indicator calculates the power spectrum of a data series using the Maximum Entropy Spectrum Estimation method and produces a power spectrum plot. The Maximum Entropy algorithm, unlike a simple FFT transform, will include frequencies from the entire complex frequency plane and not just the Nyquist interval which, in general terms, means that it can resolve cycle periods that are larger than the data window passed to the function. In addition, MESA has the ability to fit very sha

Version 1.05 - added option to use mouse to set the Data Offset (anchor). Just hold down your SHIFT key, then double-click anywhere on the chart, then release the SHIFT key and the anchor will be set to the bar nearest to your double-click.
Version 1.04 - added fix for demo mode (i.e., operation in Strategy Tester). Use Open Prices Only and check Use Date (select a date range)
The MESA Cycles indicator calculates the power spectrum of a data series using the Maximum Entropy Spectrum Estimation

BeST_Visual MAs Signal Generator MT4 Indicator is a very useful Visual Tool that can display in the Chart all ENTRY signals (BUY and SELL) and also any corresponding EXIT signal, based on a total of 12, common but also different trading strategies, in which the Entry and Exit Signals are derived exclusively by using Moving Averages (MAs). The two main groups of MAs Strategies included in this tool are: A) Crossover Signals This group includes 4 different strategies (A1-A4), where Entry and Exi

This indicator displays super power trend movement. Features Multiplier - displays multiplier movement.
Multiplier2 - displays multiplier2 movement. Trend - displays indicator trend 1 and trend 2 (true/false). separate_windor - displays trend separate window.(0-1....)
X - move the trend left and right.
Y - move the trend up and down. How to understand the status: If the Trend color is green, trend is up. If the Trend color is red, trend is down.

Hrumer Alpha - принципиально новый индикатор форекс, который построенный на алгоритме отслеживания пиковых значений цены. Это не ZigZag и не Fraclals и несмотря на визуальную схожесть, не имеет с этими индикаторами ничего общего. Он не перерисовывает свои значения и работает с нулевого бара, то есть с Open[0]. Он быстро реагирует на любые изменения в цене и информирует трейдера о разворотах. Работает на всех валютных парах и таймфреймах. Можно использовать для длительной торговли, так и для скал
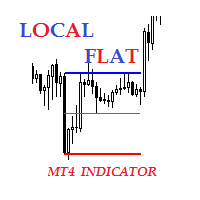
Описание Индикатор локального флета . Индикатор предоставляет возможность поиска локальных флетов в следующих опциях: Ширина каналов не более определенного количества пунктов Ширина каналов не менее определенного количества пунктов Ширина каналов не более и не менее определенного количества пунктов Индикатор отображает середину, верхнюю и нижнюю границы флета. Многократная загрузка индикатора на график с разными диапазонами приводит к отображению системы каналов на графике. Возможные варианты пр

Итерационная скользящая средняя - IMA. IMA получается путем коррекции обычной MA, что заключается в добавления к ней также скользящей усредненной разности между временным рядом Х и его MA, т.е. IMA(Х)=MA(Х) + MA (Х-MA(X)), что делается в несколько итераций (а, именно, 2 итерации в данном индикаторе) и с изменением периода усреднения. При этом точки временного ряда начинают более кучно (со всех сторон) группироваться вокруг получаемой IMA и с мен

Welcome all to the famous Gann's "Square Of 9"!! This method was used by one of the best traders in the history, a person who made his way among the top traders. An "Holy Grail" for whoever wants to learn trading. The "Square of 9" was used by this genius to find the market's future supports and future resistances. Nowadays is possible to find them with just a click, thanks to softwares. At the time Gann was using just his set of square and goniometer!! Gann describes, partially, the tecnique on
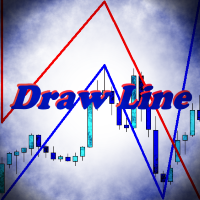
Индикатор Draw Line, является утилитой для отрисовки на графике трендовых линий, соединяющихся вместе и следующих друг за другом. Особенно будет полезна для трейдеров, использующих в своей торговле волновой анализ. Сверху графика расположены кнопки для переключения основных настроек: Вызов цветовой панели, Включение и отключение индикатора, Включение и отключение звука, Очистка графика от созданных объектов . С остальными настройками разобраться будет не сложно. Пользуйтесь на здоровье!

BeST_Darvas Boxes is an MT4 Indicator based on the trading method developed in the 50’s by the Hungarian Nicolas Darvas . BeST_Darvas Boxes indicator draws the Top and the Bottom of every Darvas Box that can be confirmed on the current Chart. draws Buy and Sell Arrows for every confirmed Upwards or Downwards Breakout of the above levels. draws always only after the bar closing and so is non-repainting or backpainting .
Note : Every customer who wants to have the older version v_1.75 with t

Новая интерпритация классического индикатора в виде осциллятора для более точного отображения ситуации на рынке. Менее запаздывающий, чем стандартный Alligator. Полностью доступны все настройки, такие как тип и цены по которым он строится. Благодаря дополнительным параметрам появилась возможность более тонкой настройки.
Отличительные особенности Не перерисовывается; Дополнительные параметры для точной настройки; Работает на всех таймфреймах и символах; Подходит для ручной торговли и для ра
FREE

Price action is among the most popular trading concepts. A trader who knows how to use price action the right way can often improve his performance and his way of looking at charts significantly. However, there are still a lot of misunderstandings and half-truths circulating that confuse traders and set them up for failure. Using PA Trend Reversal will be possible to identify high probability exhaustion moves of a trend. ️ AVOID NEWS AND SPEECHES - most of the bad signals are during the news/sp
Данный индикатор отмечает участки разворота тренда, в точках разворота давая сигнал на вход в рынок в виде стрелок соответствующего цвета и направления и звукового оповещения. За расчет точек разворота отвечают классические технические индикаторы Bollinger Bands и MA . Расчет MA производится не по периоду, а по объему контракта разделённому на цены OHLC. Индикатор не перерисовывается.
Входные параметры Show Text Label - показывать текстовые метки Set Stop Loss - показывать расстояние до Sto

Индикатор FiboZag - перенесите индикатор на график и уровни Фибоначчи будут построены автоматически по последнему развороту ZigZag-а. Основное преимущество заключается в корректном построении уровней Фибоначчи и разметке ценовых уровней. Простое, визуальное и эффективное использование. Индикатор не перерисовывается и не запаздывает. Работает на всех валютных парах и на всех таймфреймах.
MetaTrader Маркет - торговые роботы и технические индикаторы для трейдеров, доступные прямо в терминале.
Платежная система MQL5.community разработана для сервисов платформы MetaTrader и автоматически доступна всем зарегистрированным пользователям сайта MQL5.com. Ввод и вывод денежных средств возможен с помощью WebMoney, PayPal и банковских карт.
Вы упускаете торговые возможности:
- Бесплатные приложения для трейдинга
- 8 000+ сигналов для копирования
- Экономические новости для анализа финансовых рынков
Регистрация
Вход
Если у вас нет учетной записи, зарегистрируйтесь
Для авторизации и пользования сайтом MQL5.com необходимо разрешить использование файлов Сookie.
Пожалуйста, включите в вашем браузере данную настройку, иначе вы не сможете авторизоваться.