Смотри обучающее видео по маркету на YouTube
Как купить торгового робота или индикатор
Запусти робота на
виртуальном хостинге
виртуальном хостинге
Протестируй индикатор/робота перед покупкой
Хочешь зарабатывать в Маркете?
Как подать продукт, чтобы его покупали
Новые технические индикаторы для MetaTrader 4 - 58
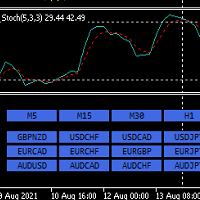
Hello,
This is an easy symbol change panel.
This is a full version of Symbol1 2Changer
Symbols must be active on your Market Watch list.
Parameters:
SymbolList - you can add more symbols with a comma(,) ratio - change the size LineNumber - you can set that how many symbols are displayed per line. button_width - modify the button size button_height - modify the button size
Thank you.

Signal Switched - канальный индикатор предназначен для того, чтобы работать с уровнями поддержки и сопротивления и помогать трейдерам находить возможности для входа в рынок. Также остащен стрелками которые помагают правильно войти в рынок.
Канальные индикаторы в числе из наиболее востребованных инструментов технического анализа на Форекс и Signal Switched перспективный инструмент анализа рынка. Signal Switched можно использовать в качестве базы для построения стратегии или в виде дополнения

PSI tools delivers new special look aimed to bring Detailed Account Statement for all important statistics. The integrated MT4 is not accurate. It does not account correctly for Deposits, Withdrawals and completely ignores cases like hedged trades, break-even trades, other broker related credits, bonuses and so on events and as a result all statistics like draw-down, total trades, average win size, rate and so on are totally skewed. PSI corrects these mistakes. In the example below a demo accou
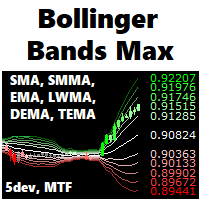
A fully featured BB indicator You're no longer limited to the built in default of using BB off a SMA method, now you can choose from SMA - EMA - SMMA - LWMA - DEMA - TEMA. You now also have up to 5 standard deviation levels, with price labels, and deviation-colored candles are provided.
Options: - MTF - moving average type SMA - EMA - SMMA - LWMA - DEMA - TEMA - 5 adjustable deviation levels
- color gradients to BB lines, candles, and texts - show-hide button to declutter the chart - full a

The Direction Line indicator shows you if the current market is in a up trend or uf ut's in a down trend. The sensitivity of the trend calculation ist customizable. You can adjust it till it fit's your strategy. Even as a beginner is this indicator easy to use and you'll see every trend.
Key Features of Direction Line Real-time trend calculations of all time frames Graphical Interface Identical calculation for all time frames Customizable trend sensivity No repainting
Settings / Inputs
Sen
FREE

Deal Trading SPT (Super Trend) is an indicator, shows the market trend direction, entry position, take profit level, stop loss level and trend strength.
Utility Help to further filter and develop strategy to trade Market overview on the chart Stop loss and take profit calculation with market volatility Resistance and support for trialing stop No repaint after the finished bar Works in any timeframe and financial instrument, including forex, CFD and crypto etc. Message pop-up, notification wi
COMPLETE VISUAL TRADING SYSTEM WITH THE BUY SELL SIGNALS - USING MULTI TIME FRAME TREND ANALYSIS
TREND STRENGTH POWER SIGNALS DASHBOARD.
TRADE INTRADAY, SHORT OR MEDIUM OR LONG TIME FRAME .
ALL THE SIGNALS WITH A MULTIPLE TIME FRAME TREND CONFLUENCE - INDICATES A STRONG MOVE AND CAN BE EASILY TRADED AS HIGH PROBABILITY TRADES.
COMPLE TRADING SYSTEM - WITH THE LOGICAL ENTRY , TARGETS AND STOP LOSS .
THE ALERTS ON THE DISPLAY SIDE OF THE ALERTS PANEL AREA , WILL INDICATE CLEARLY ALL T

A BB indicator with MA options
You're no longer limited to the built in default of using BB off a SMA method, now you can choose from SMA-EMA-SMMA-LWMA. You now also have up to 3 standard deviation levels, with price labels.
Options: - MTF - moving average type SMA-EMA-SMMA-LWMA - 3 adjustable deviation levels
- separate coloring to lines and texts
Troubleshooting: - If there are any issues or suggestions for the indicator, please comment and let me know. The feedback will be noted and c
FREE
Stochastic Crossover Dashboard Pro uses the value of Stochastic indicator. The Stochastic's parameters can be adjusted via the Edit boxes of this dashboard. The monitoring pairs will be selected by adding to the Market Watch (no need to set prefixes or suffixes) , you can monitor many pairs as you like. This dashboard will check almost popular time frame (M1,M5,M15,M30,H1,H4 and D1). The colors can be customized. The parameters of Stochastic can be set at the input. Crossover signal can be sent

This EA is an excellent TP/SL helper for any one Long or Short position. It automatically creates 3 lines of Take Profit (TP) and Stop Loss (SL) with input parameters of your choice (inpTP1_Points - inpTP3_Points and inpSL1_Points - inpSL3_Points). Also, you have input parameters: inpTP1_ClosePercent - inpTP3_ClosePercent and inpSL1_ClosePercent - inpSL3_ClosePercent where you can set up percentage of LotSize input to be closed at particular TP/SL line. Otherwise speaking, you can set a percent
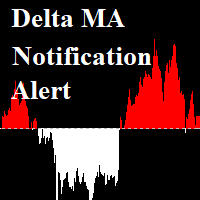
Delta Moving Average with Alert: Delta MA (Candle 1) = MA(Candle 1)-MA( Candle 2) Delta MA shows the speed of market movement. When the market has a low delta MA, it is advised not to trade. When the market is highly volatile, we can put an alert on the indicator and then find an entry point You can set the value Alert, Notification. Set different values for each pair. And On OFF Alert on Terminal, Notification on Smartphone . Notifications - Client Terminal Settings - MetaTrader 4 Help
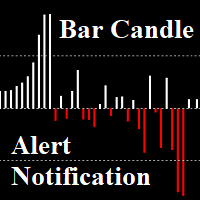
Bar Candle with Alert: Is Candlestick charts are arranged differently. The length of the candles, showing the strength of the trend When the length of the candle is short, advice is not to trade. We can put an alert on the indicator and then find an entry point You can set the value Alert, Notification. Set different values for each pair. And On OFF Alert on Terminal, Notification on Smartphone. Notifications - Client Terminal Settings - MetaTrader 4 Help
How to Setup MT4/MT5 Mobile A
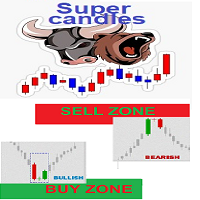
Simple indicator for possible BUY / Sell Zones based on smart volumes indicator two levels of buy/Sell Zones : Main BUY/SELL area and current BUY/SELL area and medium range BUY SELL Levels SELL Levels in Red BUY levels in Green Sell levels(RED) are transformed to buy levels (GREEN) when price is crosses above BUY levels(GREEN) are transformed to SELL levels (RED) when price is crossed Below
your strategy can vary : 1- you can Buy when price is above a green BUY area 2- you can Buy by approa
Некоторые трейдеры в ходе торговли ориентируются на торговые сессии. На рисунке 1 показан средний размах цены в течение одной недели. Видно, что в разные дни торговые сессии отличаются по своей длительности и активности. Этот индикатор создан для оценки среднего движения цены в определенные промежутки времени внутри недельного цикла. Он учитывает движение цены вверх и вниз отдельно друг от друга и дает возможность определять моменты, когда на рынке возможна высокая волатильность. На графике дв

FREE Heiken Ashi Smoothed indicator is fully adjustable, easy to use and comes with possibility to access the indicator via iCustom function so you can use it in your own trading software. Indicator can also pop up alerts when signal changes or send push notifications. For Metatrader 5 version click here: https://www.mql5.com/en/market/product/70825 For detailed information click: >>HERE<< Features
Easy to use Accessible via iCustom Fully adjustable Alerts and Push notifications Possi
FREE

Данный индикатор находит фигуры технического анализа "Двойное дно" и "Двойная вершина", показывает их на графике валютной пары и может сигнализировать, если фигура была сформирована недавно. Эти фигуры являются разворотными, часто после из появления тренд поворачивает обратно или происходит коррекция. Чтобы не искать их самостоятельно, достаточно добавить индикатор на график, после этого, можно изменять разные таймфреймы, чтобы быстро найти такие фигуры на одном из тайфреймов. Имеются некоторые
FREE

Это авторская торговая система. Предназначен для внутридневной торговли. Сигналы не переписываются . Подойдет для любого инструмента и таймфрейма. Можно включить оповещения. Легок в использовании. Смотри скриншоты. Подпишись на мой telegram канал, ссылка в контактах моего профиля . Простые настройки! Все уже сделано для вас! Основа - это анализ текущего тренда. Индикатор ищет выход из накопления. Если ты давно ищешь хорошую торговую систему, то она перед тобой!
FREE

+ 2 бонусные стратегии! + Алерты! Рекомендую посмотреть моего советника - Night Zen EA Индикатор объединил в себе наиболее популярные стратегии по скользящим средним: Простое пересечение скользящих средних. Пересечении скользящих средних относительно положения более медленной скользящей средней. 2 бонусные стратегии: Пересечение быстрой скользящей средней с расчетом цен открытия медленной скользящей средней с расчетом цен закрытия с учетом более медленной скользящей средней. (Настройки данной
FREE

Индикатор SPV Corr отображает усредненную процентную корреляцию между телом бара и его тенями. Очень эффективная система для построения различных фильтров и подтверждений входа в рынок. Фиксирует цикличность, и можно использовать в торговле разными способами. Можно увидеть подъемы и спады индикатора чередуются и имеют такую зависимость с рынком по которой можно делать выводы для предсказания поведения цены. Также индикаторы можно комбинировать между собой. Ценность индикатора заключается в том,
MT5 версия - https://www.mql5.com/en/market/product/70786
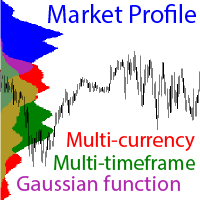
Внимание : для корректной работы необходимо загрузить данные для всех инструментов на всех тайфреймах! Возможность отображения нескольких валютных пар. О тображения данных из более мелких таймфреймов на текущем графике для более точного выявления ключевых уровней . Например, отображение данных из M1 периода на графике H1. Расчет ом значений по формуле Гаусса (формула нормального распределения). Гибк ая систем а настроек. Принци
MACD FACTOR!
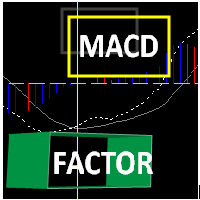
Macd factor is amazing!...it draws multi lines of its own factor of macd(12,26,9) on the chart! not on separate windows as normally macd (12,26,9) it is. It is not 12,26 of EMA's on that chart ... it is now really different! ...
It has 6 difference lines + 1 line of it own factor line ..
You can examine every each of the lines cross over of each other at the specific time and price while at the same time, the main line of macd (12,26,9) cross over the sign

Master Binary is Binary Indicator Highly Winrate No Repaint, No Delay Result look on https://t.me/BonosuProBinary Pair : All Forex Pairs Time Frame : M1 Expaired : 2 Minutes Trade Time Once Time a Day Backtester, Alert Avaliable Average Signals Generate 5 - 20 Signals All Pair A Day Broker Time Zone GMT+3 Default Setting [Example Broker GMT+3 : Alpari, ICMarkets] Support Broker : Deriv, IQOption, Alpari, Binomo Olymtrade, etc Support Auto Trading : MT2 Trading, Binary Bot, Intrade Bot, Binomo B
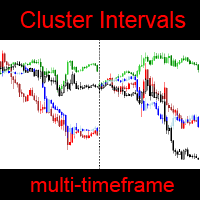
MT5 версия — https://www.mql5.com/en/market/product/70988 С помощью данного индикатора вы сможете наблюдать относительные изменения цены других инструментов на текущем графике. Настройки : refreshEveryTick — обновлять каждый тик .
sym1 — Имя Инструмента. Если пусто или равно «0», то игнорируется. numberOfIntervals — кол-во отображаемых интервалов. i ndicatorMode — режим отображения. Задает величину каждого интервала: by4h (4 часа), by6h (6 часов) и т.д. Режим byDeep - интервал раве
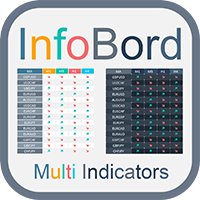
A useful indicator dashboard scanner that shows the direction of all kinds of indicators in multiple symbols and timeframes.
Shows indicator's overall direction without you having to keep checking other chart symbols and timeframes. You can move the dashboard around the chart and you can display or hide it by double clicking on the name of the indicator you are using. Symbols and Timeframes input must be separated by commas. (Example: "EURUSD, GBPUSD" , "M1, M15, H1") This indicator has buil

The popular saying in forex "The Trend is your friend" has always stood the test of time because it is valid statement for every generation of traders and in every market. Most successful traders do not fight against the trend but lend to flow with it.
Sometimes finding the best pair to trade can be a daunting task even when you have a good strategy . Some strategies works well with trending markets and some don't . So the question is how can you easily spot trending pairs without any hass
FREE

The Relative Trend Index or RTI , is a technical indicator that is used to identify trend changes in the price of an asset, as well as the Strength of that trend. The RTI fluctuate between zero and 100, with values close to 100 indicating a strong sell and values near zero indicating a strong buy Indicator Parameters: RTI : the indicator is typically applied to 14 periods of data, so the indicator is showing how many periods it has been since a 14 period high or low Signal : Cross signal occur

Em uma negociação no Mercado Financeiro nada é mais importante que saber o momento certo de entrar em uma negociação. O AndInvest Impulse auxilia traders a capturar o momento exato de abrir uma negociação, para isto ele desenha topos e fundos facilitando a leitura do Price Action e após um breve momento de realização do mercado ele identifica o retorno da ponta compradora ou vendedora de força antecipada e sem repintura. Comprovação de Resultados: https://youtu.be/CA1_ZtZY0vk Funciona em qualque
The Spread Ratio indicator allows you to view the ratio between the value of one instrument and another in order to operate with spread trading techniques.
In the image we can see an example of the Spread Ratio indicator on the Brent Oil and Crude Oil instruments. As we see from the image, the Spread Ratio indicator shows the trend of the ratio between these two instruments, allowing us to grasp the misalignments and realignments of the prices.
It is also possible to combine the Spread Rati

Only work on Crude Oil H1 time frame Swing follow trend. do not trade against trends Specifies the first destination and entry and exit points For 16 years, I only traded on CrudeOil. Crude oil is one of the most extreme combinations in the world and it is safe to say that such a good indicator has never been made before. This indicator will save you a lot of money because it introduces a new type of approach, Good luck

Indicator : Forex Reversal Trend The indicator helps investors to identify the earliest and perfect reversal point. Easy to make decision to trade with the trend Price action trading. support resistance and market trends. By technical analysis, the robot creates a short-term strategy to determine the most optimal entry position. Version PRO: https://www.mql5.com/en/market/product/70867 Telegram: https://t.me/tForexSniper
FREE

Tick Speed Pro povides a charted record of tick speed to allow you to see the ebb and flow of market activity. Observing patterns in tick speed may allow you to better time entries to reduce slippage and re-quotes.
The tick speed plot updates it's entire position to show you only the last N seconds you choose, ideal for scalping and HFT approaches. An alert is provided to signal when the instrument is getting ticks at a higher rate than the alert limit. Multiple loadings are supported to compar

Tick Speed Free povides a on-chart label of tick speed to allow you to see the ebb and flow of market activity. Observing rises and falls in tick speed may allow you to better time entries to reduce slippage and re-quotes.
Options include: - colores for low-mid-high tick speeds - placement and styling - prefix & suffix to customise the speed label
Troubleshooting: - Note, in the tester environment, tick timings are limited to what is supplied by the tester environment and it's speed
- If
FREE

Power Scalping Indicator is based on a very complex mathematical model that can capture market movements and identify the current start of a trend & finds the exact price to enter the market whether buy/sell with instant alerts. GIVE ME A GOOD RATING!
MARKET ORDERS Get Instant trades Buy/Sell with Entry, Target and Stop loss
ACCURATE ANALYSIS
MULTIPLE TIME FRAME Now supports Multi-Time frame analysis and trades
MARKET SESSION Know which trading session is going on on same dashboard windo

This indicator analyzes the ranges in the selected LookBack Bars and shows the relative strength of the price movement with the Level percentage you set. The blue line indicates that the current price movement is strong, and the yellow line indicates that we are in a flat price movement. The blue line does not determine whether the price action is up or down, it just shows relative strength. Therefore, as seen in the picture, direction can be determined with a simple zigzag indicator on the main

Индикатор предназначен для переключения ТФ. Если у вас стоит советник который зависит от текущего ТФ, тогда это вещица вам необходима. Выставление ТФ происходит по количеству ордеров или по набранной лотности. К примеру, для ясности, если ваш советник начинает просаживаться, набирая сетку, то индикатор переключает ТФ автоматически, на увеличение ТФ и не даёт набирать лотность. Как только он закрыл сетку, происходит автопереключение на М1 и по новой. Так ваш советник торгует как скальпер и далее

Entry Point to Trend Pro The indicator helps investors to identify the earliest and perfect reversal point. Easy to make decision to trade with the trend Price action trading. support resistance and market trends. By technical analysis, the robot creates a short-term strategy to determine the most optimal entry position. Optimal usage: 1. Wait for the trend reversal arrow to appear, we can enter an order to start a new trend. 2. The corresponding arrow in the bar that appears in the same directi

Simple to read and powerful, no fancy lines and drawings to clutter your chart or distract you. The trend probability oscillator estimates how likely a trend will continue in a certain period. The cummulator period controls how many bars in the past to use and is a proxy for the timescale the trend probability should hold. The use of a Max Line improves this further by indicating when a trend is likely to reverse. In most cases a trend must lose momentum before reversing. Hence, a trend probabil
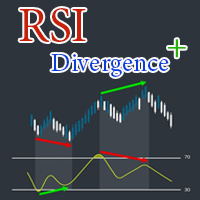
- RSI Divergence Plus is an RSI indicator which also detects divergences & Reversal candlestick pattern & Trend (Moving Average). - RSI Divergence Plus Send Arrows signal on the chart where you should buy and sell. Input parameters : - Rsi Period (Default 8) - True=Close/Open, False=High/Low (Default true) - Alerts (Default true) Return parameters: - 0 = Divergence Up Signal ---> iCustom(Symbol,TimeFrame,"RSI Divergence Plus",8,true,false,0,1) - 1 = Divergence Down Signal --->

Macd Four Color is an advanced Macd indicator that can filter Trend and Sideway. - It is an ideal tool for Long term trading and scalping - Filter trends and sideways with special techniques - Can be used for any time frame - Can be used on all currency pairs Color Signal : - Dark Green = Trend Up Strong - Light Green = Trend Up Weak - Red = Trend Down Strong - Orange = Trend Down Weak Return parameters: - 0 = Macd Main - 1 = Macd Signal - 2 = Tren

Reversal Patterns Pro
Reversal Patterns Pro is a Price Action (PA) analytical tool that scans the reversal patterns. - Finds and marks the most dependable Japanese candlestick patterns in real-time. - Supports all time frames (Best for Scalping) - Doesn't repaint making it an exceptional indicator for Expert Advisors. Input parameters :
- Support & Resistance Mode ( true or false ) for enabling advanced filtering - Donchian Period - RSI Period - RSI Oversold Level - RSI Overbought Level -

IBB Candles is a tool that is based on the concept of Inverse Bollinger Bands. It compares price relative to state of the bands and plots candles with different colors defining the current state of the market i.e range | trend | strong trend. As the name suggests IBB(Inverse Bollinger Bands) is a technique which is completely different from the traditional Bollinger Bands and proves to be much more effective in analyzing market. This personal implementation makes this tool a more reliable option

Counter trade type indicator.
Jcounter can capture the timing of the trend collapse phase.
There are signs of a trend collapse. It is the world standard to confirm the sign with LSMA adopted by Jcounter.
The numerical setting of LSMA is very important, but after many years of verification, the numerical value was identified and completed.
When the trend starts, the rising market moves like a support, and the falling market moves like a resistance.
Gradually overtake the candlest

This indicator analyzes the most important levels of different timeframes and shows you the best of them on the chart and these levels are obtained with fractal (bill williams) approval You can use this indicator to determine the most important levels for yourself and trade with ease. You no longer need to spend hours checking different levels because the indicator will do it for you in the best possible way and will save you time. The surfaces that are extracted for you have the highest possi

This indicator is a trend indicator . It is based on moving averages. Very simple and very useful. One thing to keep in mind is that it is a trend indicator , so it is better to use it when the market is trending. Use on any pairs . It is not re paint indicator . It should not be used in ranging markets . Stop Loss, Entry and Exit can also be used with this indicator. You can see how to use this indicator in the screenshots. More useful on M15, H1, H4 time frames. Thanks For All. For MT5

In combination with the BT you can test python strategies. The BT has a history of M1 bars from 2016 onwards (over 5 years, source DukasCopy). At this moment the history for the basic 28 instruments will be available.
All time frames are deducted from these M1 bars (M5, M10, M15, M20, M30, H1, H2, H3, H4, H6, H8, H12, D1). Stepping through the history in M1 bar increment or multiple M1 bar increments. Orders and positions will be updated every increment.
All history bars of the instruments a
Scalping Meter - полуавтоматическая торговая система на базе систематизированной математической модулярной структуры точечного взаимодействия. Данный индикатор с помощью нейронной сети самообучения анализирует исторические данные графика, изучает движение и поведение цены, определяет точки разворотов на истории и используя эти данные прогнозирует будущие развороты цены. Точки разворота цены на графике обозначаются с помощью простых и понятных для каждого трейдера стрелок. Учитывая постоянное и д
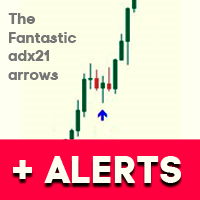
Смотри скриншоты индикатора. Использует информацию о текущем тренде. В основе лежит классический индикатор ADX. Дает сигнал на вход в сделку по нестандартной стратегии. Подпишись на мой telegram канал, ссылка в контактах моего профиля . Настройки: Наименование Описание
Period of ADX Период классического индикатора ADX Distance between +D & -D lines Расстояние между линиями +D и -D. Определяет силу тренда Freshness of the signal (bars) Проверка свежести сигнала на покупку или продажу.
Выбир
FREE
What Is MSI Indicator? A tool for metatrader4 which gives signals Forex Technical Analysis Indicators are usually used to forecast price changes on the currency market. By using Forex indicators , traders can make decisions about market entry and exit . MSI indicator is one of the most accurate indicators you will face. Features
Applicable on all forex pairs of Metatrader4. Non Repaint 5m,15m,30m,1h time frames One Time Payment with Free updates 84% winning rate
User Friendly How
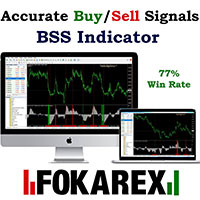
What Is BSS Indicator? A tool for metatrader4 which gives signals Forex Technical Analysis Indicators are usually used to forecast price changes on the currency market. By using Forex indicators , traders can make decisions about market entry and exit . BSS indicator is one of the most accurate indicators you will face. Features Applicable on all forex pairs of Metatrader4. Non Repaint 5m,15m,30m,1h time frames 79% winning rate
User Friendly How BSS Works ? A file that you downlo

Asynchronous Trend - это и будет окончательным сигналом того, что восходящий или нисходящий тренд начался или исчерпал себя. Это отличное дополнение к любой стратегии. Торговля на основе показателей тренда самая простая и, зачастую, самая эффективная. Инструмент не занимает на графике много места и не перегружает терминал. В интернете можно найти много разных версий этого инструмента, но одна из самых эффективных – это версия без перерисовки, которую вы можете купить здесь. Индикатор позволяет

Mastodon - отображает потенциальные точки входа в рынок.
Согласно теории волн Mastodon отображает ход крупной волны, в то время как осциллятором можно уточнить точку входа, тоесть поймать ценовое движение внутри её, т.е. мелкие “подволны”. Правильно понимая волновую природу ценовых движений и используя индикатор Mastodon в связке с осциллятором, можно создать собственную торговую систему, например, вход в рынок после образования крупной волны с последующим выходом, когда эта волна сменилась д

The indicator builds a Renko chart in the sub window for the current symbol. The bars are formed from live data and the desired bar size can be set in the inputs tab. Most importantly, because the Renko chart only uses price to construct bars and ignores time, the indicator can be applied to any time frame and same results can be achieved. Recommended usage
As Renko charts are famous for eliminating noise so traders can use this tool to see clear picture of the trend to help their analysis, ent
FREE
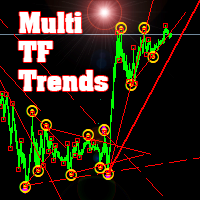
Индикатор трендовых линий и точек разворота тренда на разных таймфреймах. Этот индикатор способен заменить целую торговую систему. Главная красная линия отображает направление общего тренда. Другие линии отображает линии поддержки и сопротивления. Другие сигналы:
Маленькие красные квадраты: максимум/минимум младшего таймфрейма; Фиолетовый ромб: максимум/минимум текущего таймфрейма; Круги в точкой: максимум/минимум старшего таймфрейма;
Настройки:
Fast period - Период быстрой средней; Slow
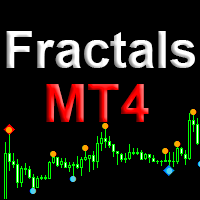
Индикатор Fractals MT4 отображает на графике только фракталы с заданными параметрами в настройках индикатора. Это позволяет с большей точностью фиксировать разворот тренда исключая ложные развороты. По классическому определению фрактал, это свеча - экстремум на графике, который не пересекала цена 2 свечи до и 2 свечи после появления свечи фрактала. В данном индикаторе есть возможность настройки количества свечей до и после экстремума, а также минимальное количество пунктов терминала ухода цены
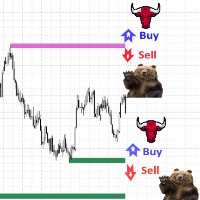
Индикатор уровней поддержи и сопротивления рисует уровни возможного разворота цены или её прорыва!
Если цена касается уровня вы можете на выбор в зависимости от ситуации на рынке и потенциала движения в ту или иную сторону покупать в отбой уровня или продавать в случае пересечения ценой уровня.
Проще всего торговать отложенными ордерами , когда вы видите уровень чтобы не дожидаться когда цена дойдёт до него или пробьёт его установить отложенные ордера.
Когда цена пересекает уровень он ис
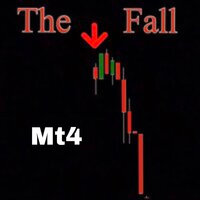
Newly Updated 50% OFF for 24 Hours ! Hurry and Buy Before Price Doubles Today! Join FREE Telegram Channel https://t.me/joinchat/IWJPxfIhtaBkNjIx After Purchase Message Me For FREE Trend Filter Tool I Use To Determine Trend Direction *Non-Repainting Indicator "The Fall" is an indicator that shows precise Sell Trades. A great arsenal to add to any chart. It's Best to Use The 15M chart "The Fall" is designed to alert SELLS only. So Of course, Only Take The Arrows In a Downtrend Only For Best R

This indicator plots Heiken Ashi candles in a subwindow instead of the main chart, making it possible to analyse HA candles whilst keeping the main chart clean.
- optional bid/close line is provided, stylable, updates on tick - HA candles are stylable via the inputs tab - optional price smoothing to the HA candles, with moving average period and method options - auto-scaling when scrolling back and forth
FREE

US30 Ninja is a 5 minute scalping indicator that will let know you when there is a trade set up (buy or sell). Once the indicator gives the trade direction, you can open a trade and use a 30 pip stop loss and a 30 pip to 50 pip take profit. Please trade at own own risk. This indicator has been created solely for the US30 market and may not yield positive results on any other pair.

Индикатор сглаженного MACD (xMACD)
Входные параметры: Fast EMA Period - период быстрой EMA Slow EMA Period - период медленной EMA Signal SMA Period - период сигнальной SMA Applied Price - тип цены (0 - CLOSE | 1 - OPEN | 2 - HIGH | 3 - LOW | 4 - MEDIAN | 5 - TYPICAL | 6 - WEIGHTED) Принцип работы Индикатор перерассчитывает стандартный технический индикатор MACD (дважды усредняет получаемые значения). Индикаторный буфер не перерисовывается.
FREE

T hinking encompasses a flow of ideas and associations that can lead to logical conclusions . Although thinking is an activity of an existential value for humans , there is still no consensus as to how it is adequately defined or understood. Thinking allows humans to make sense of, interpret, represent or model the world they experience, and to make predictions about that world. It is therefore helpful to an organism with needs, objectives, and desires as it makes plans or
FREE

Velvet RVI is intended for use with the Velvet advanced ordering layer. It is based on the algorithm for the Relative Vigor Index, provided by Investopedia here . All of the data it displays is accurate and verified against the internal API function iRVI, when it is detected by the ordering layer. In order to place orders with the Velvet RVI indicator, the ordering layer must be installed and running. Ordering from the Velvet RVI indicator requires that "Velvet Ordering Layer" ( found here ),
FREE
Velvet MACD is intended for use with the Velvet advanced ordering layer. It is a modified version of the MACD indicator provided by Metaquotes and all of the data it displays is accurate and verified, when it is detected by the ordering layer. In order to place orders with the Velvet MACD indicator, the ordering layer must be installed and running. Ordering from the Velvet MACD indicator requires that "Velvet Ordering Layer" ( found here ), version 2.0 or higher, be installed and running. Whe
FREE

Spin is an intrinsic form of angular momentum carried by elementary particles, composite particles (hadrons), and atomic nuclei.
Spin is one of two types of angular momentum in quantum mechanics, the other being orbital angular momentum. The orbital angular momentum operator is the quantum-mechanical counterpart to the classical angular momentum of orbital revolution and appears when there is periodic structure to its wavefunction as the angle varies.For photons, spin is the quantum-mechanica
FREE

Индикатор сглаженного DeMarker Oscillator (xDeM)
Входные параметры: Period - период усреднения Принцип работы
Индикатор перерассчитывает стандартный технический индикатор DeMarker Oscillato r (дважды усредняет получаемые значения). Период усреднения индикатора соответствует двойному периоду стандартного DeMarker Oscillato r . Например : xDeM с периодом усреднения 7 соответствует DeM c периодом 14. Индикаторный буфер не перерисовывается.
FREE

If you want to know what will happen in the future of the chart, you are in the right place. This indicator allows you to predict the future of the market with advanced computational methods and make the right deal by knowing the support and resistance points and receiving timely buy and sell signals. What does "Tendency" indicator show us? 1. Prediction line: Using mathematical calculations, the price is predicted in different timeframes and is interconnected. This means that based on the previ
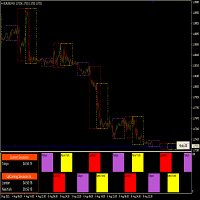
Auto GMT Base Session Indicator "The Link to find your session time base on your GMT is given inside the indicator Description" You can find your GMT Zone and Session times from the following website to insert into this Indicator inputs, and keep the Keep GMT On as true for the first time, when you determine your Session Times according to your GMT base then you can keep this inputs as false and modify your session time according to your broker, GMT calculation is only need when you don't know t

The only Market Ticker on the market! Add a professional novelty to your workspace, with built in mini-charts
A scrolling Market Ticker that displays price changes from all symbols in the Market Watch list. Provides an easy snapshot of symbol prices, and keeps scrolling automatically while you trade and analyse the chart. The ticker color (+/- price changes) are based on either the current or completed candle, and the previous candle.
Options include: - MTF, eg choose to show price changes
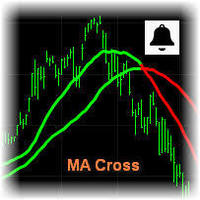
MA Cross Signal Alerts
MA Cross Signal Alerts_v2.0 The Moving Average Cross displays a fast and a slow moving average (MA). A signal arrow is shown when the two MAs cross. An up arrow is displayed if the fast MA crosses above the slow MA and a down arrow is given if the fast MA crosses below the slow MA. The user may change the inputs (close), methods (EMA) and period lengths.
When two Moving Averages cross the indicator will alert once per cross between crosses and mark the cross point w
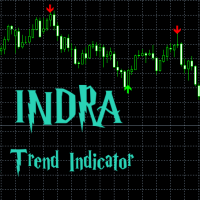
What is the INDRA Trend indicator? A INDRA Trend is a trend following indicator which give most accurate arrow signals of BUY and Sell based on the moving average , buying power and selling power in market, checking with other multiple indicators and providing the best possible time to get in to the market . This indicator is tested in multiple time frames as showed in screenshots it is also tested in multiple currency pairs , crypto and metal pairs such as USD/CAD EUR/JPY EUR/USD EUR/CHF US
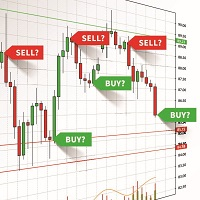
Индикатор для скальпинга, который точно показывает точки разворота цены и не перерисовывает свои значения!
Forex trading signals - аналитический индикатор который, показывает на графике направления тренда, продолжительность, интенсивность и итоговый рейтинг. Это даст вам возможность определить точки входа и выхода из рынка с помощью точек и линий сопротивления. Индикатор очень простой в использовании. Возможно использование на всех валютных парах и на всех таймфреймах. Как торговать с Forex t
А знаете ли вы, почему MetaTrader Market - лучшее место для продажи торговых стратегий и технических индикаторов? Разработчику у нас не нужно тратить время и силы на рекламу, защиту программ и расчеты с покупателями. Всё это уже сделано.
Вы упускаете торговые возможности:
- Бесплатные приложения для трейдинга
- 8 000+ сигналов для копирования
- Экономические новости для анализа финансовых рынков
Регистрация
Вход
Если у вас нет учетной записи, зарегистрируйтесь
Для авторизации и пользования сайтом MQL5.com необходимо разрешить использование файлов Сookie.
Пожалуйста, включите в вашем браузере данную настройку, иначе вы не сможете авторизоваться.