Смотри обучающее видео по маркету на YouTube
Как купить торгового робота или индикатор
Запусти робота на
виртуальном хостинге
виртуальном хостинге
Протестируй индикатор/робота перед покупкой
Хочешь зарабатывать в Маркете?
Как подать продукт, чтобы его покупали
Новые технические индикаторы для MetaTrader 4 - 68

Индикатор определяет самую важную составляющую любой торговой системы - возможную точку выхода из сделки.
По мере движения цены, в зависимости от рыночной ситуации, индикатор строит цели.
Цель становится актуальной, когда цена начинает движение в сторону цели.
Если движение сильное, то для его остановки или разворота может потребоваться некоторое количество целей. Скопление целей наиболее вероятно способно остановить цену.
Некоторые цели исполняются по нескольку раз.
Но графике о
Индикатор для бинарных опционов Время экспирацыи 1 свеча Таймфеймами от м1 до м15 Отсутствие перерисовки
Можно использовать любой мани менеджмент Если это будет мартингейл то доходность увеличится Мартингейл использовать на маленьком счету не рекомендуется Сигналы Синяя стрелка вверх сигнал на покупку Красная стрелка вниз сигнал на продажу Рекомендуется избегать торговли во время выхода сильных новостей
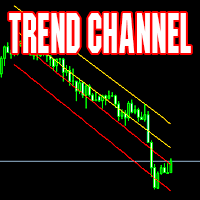
Индикатор каналов. Рассчитывается динамически. Подходит как для работы в направлении тренда, так и внутрь канала. Отличные результаты при работе на таймфреймах от 4Н по направлению в центр канала. Support: https://www.mql5.com/en/channels/TrendHunter Пример использования: при касании цены одной из крайних линий - открытие сделки в центр канала с тейк-профитом на ближайшей средней линии индикатора. Версия для МТ5 Индикатор можно использовать в советниках (4 буфера), получая данные стандартным с

Представляем уникальный продукт для анализа эффективности стрелочных индикаторов !
С его помощью Вы сможете обработать сигналы любого стрелочного индикатора, узнать их эффективность, собрать статистику по успешным сигналам и подобрать лучшие параметры — все эти возможности заложены в настройках! Индикатор работает с сигналами стрелочных индикаторов, формируя из них сигналы. Arrow Trade собирает статистику сигналов: на табло отображается число и процент успешных и неуспешных. В наст
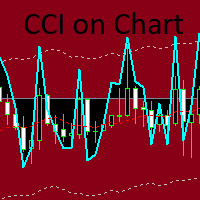
Индикатор CCi с динамическими уровнями на основе стандартной МА, взятой за основу отсчета уровней, и модифицированных данных стандартного CCi относительно МА. Входной параметр CutCCi если больше 0, ограничивает рисование графика CCi по вертикали, но не влияет на расчеты. Есть 3 варианта отображения стрелок: стрелки при пересечении уровней на выход из зоны уровней - тренд, стрелки на возврат после выхода из зоны уровней - реверс и пересечение нулевого уровня (красной линии МА). Можно отдельно
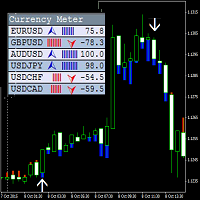
Данный индикатор рисует на графике стрелки, которые являются сигнала на вход и выход из сделки, а также в качестве фильтра индикатор окрашивает каждую свечу в синий и красный цвет. Дополнительно ко всему в левом верхнем окне показывается сила тренда и его направление по основным парам. У индикатора новая логика, которая существенно отличает его от множества аналогов. Он дает ранние сигналы на вход и на выход, свои значения не перерисовывает — то есть, если индикатор дал сигнал на вход в сделку,
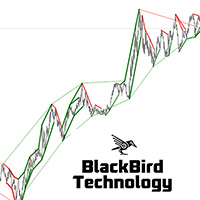
Multi Level Trend Direction is an indicator that identifies the most accurate buy/sell swing points with the highest probability, based on multi-level Zig Zag Swings. The indicator draws a color Zig Zag at the Higher Highs, Higher Lows, Lower Lows and Higher Lows in the chart, but based on two level Zig Zag Swing. If the fast price swing is in line with the trend of the slow price swing, then the buy/sell trend lines are bigger. If the price swing is against the trend, no lines are drawn to si

This is a volume profile that shows the volume with a fixed constant time frame that you set. The indicator also shows the maximum volume value (VPOC - VOLUME POINT OF CONTROL) and the average value, colors and settings you can adjust as you like, there are many possibilities. If you need an indicator that shows the variable volume range frames there is ...HERE... Volume Profile is an advanced charting study that displays trading activity over a specified time period at specified price leve

Volume, momentum, and market strength are key indications that price is about to move in a certain direction. The Volume-solution indicator is one indicator which can help traders objectively classify a momentum type of trade setup as one having volume and strength or not. What is the Volume-solution Indicator? The Trading Volume indicator is a custom technical indicator which works somewhat like a market sentiment indicator. It indicates the strength of the bulls and the bears of the market. Wh

Action Alert indicator generates and writes data on the chart when performing any modification to the dead process. Expertise Properties: An audible alert is issued in the name of the operation and the labor that has been made You only need one chart Writes the processed operations in clear handwriting The font color can be controlled on the chart Setting Action Alert indicator
What is meant by it is to alert me any change in my deals of , it will reverse if any new deal comes out, a

With the purchase of the Auto-Harmonic Pattern Recognition Trading Software for MT4 , you will have access to: The Auto Harmonic Pattern recognition software is designed to take the heavy lifting out of a traders Harmonic trading strategy. The Software automatically Identifies and Projects Harmonic Pattern Completion Zones for the 6 most trade-able Harmonic Patterns. If the Pattern Completes in the projected zone, then there is a high probability of the resulting trade being successful. Pleas

Concept of Market Profile was created at Chicago Board of Trade (CBOT) by trader Peter Steidlmayer and first published during the 1980s as CBOT product. Market profile by itself is not a stand-alone strategy, but a different way how you can view the market and make better trading decisions.
They have seen a market as an auction process which is affected by supply and demand the same way as every other auction, for example, development of prices of food, gas etc.
The price goes up as long
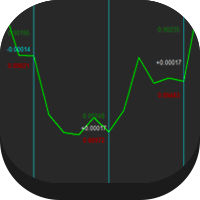
This indicator gives the highest and lowest information of the currency you have selected and the day you selected. It also shows the average. In this way, you can find out the profit / loss probability of your transactions for the same days. Reported: Average points per week Average points per year Lifetime average points Note: It does not provide you with buy / sell signals. Shows average points only
FREE

The Perfect Supply & Demand Indicator for the MetaTrader 4 Platform ! It comes packed with the following features...
Supply & Demand Zones
The indicator charts Supply & Demand Zones on your favorite profiles. It works on all time frames and in all markets. Fresh & Used Zones
The indicator color codes each zone so that you know if it's fresh or not.
When the zone is no longer fresh it changes color, indicating that price have already traded at the level once or multiple times before. Stru

Информационная панель ADR Alert показывает вам, где в настоящее время торгуется цена по отношению к ее нормальному среднему дневному диапазону. Вы будете получать мгновенные оповещения через всплывающие окна, электронную почту или push-уведомления, когда цена превышает свой средний диапазон и уровни выше него по вашему выбору, чтобы вы могли быстро переходить к откатам и разворотам. Черта предназначена для размещения на пустом графике и просто находится в фоновом режиме и предупреждает вас о до

Панель предупреждений RSI / TDI позволяет вам одновременно отслеживать RSI (выбирается вами) по каждой основной паре, которой вы торгуете.
Вы можете использовать его двумя способами:
1. Выберите несколько таймфреймов, и тире покажет вам, когда несколько таймфреймов выходят за рамки обычных торговых условий. Отличный индикатор того, что цена в последнее время сильно подросла, поскольку она достигла уровня перекупленности или перепроданности в нескольких временных рамках, поэтому вскоре ожи

Распределение Коши является классическим примером распределения с толстыми хвостами. Толстые хвосты указывают на то, что вероятность отклонения случайной величины от центральной тенденции очень велика. Так, для нормального распределения отклонение случайной величины от ее математического ожидания на 3 и более стандартных отклонений встречаются крайне редко (правило 3 сигм), а для распределения Коши отклонения от центра могут быть сколь угодно большими. Это свойство можно использовать для модели

All Candlesticks Library - это индикатор, который предлагает интеллектуальную систему распознавания образов с ДЕЙСТВИТЕЛЬНО широким диапазоном вариаций свечей! Существует более 100 свечных паттернов, от обычных доджи и вариантов консолидации до ряда хорошо известных моментумных свечей и свечей прорыва и до редких паттернов, которые мы не видим каждый день.
ПЛЮС, он поставляется со статистикой (НЕ 100% ТОЧНОЙ, но достаточно справедливой)! Вы можете видеть подсвечники, оба или ни один, изменить

Definition : VPO is a Volume Price Opportunity. Instead of using bars or candles with an Open, High, Low, and Close price, each "bar" in a Market Profile is represented by horizontal bars against the price It is called Market Profile terminology.
In other words volume-price-opportunity (VPO) profiles are histograms of how many volumes were traded at each price within the span of the profile.
By using a VPO chart, you are able to analyze the amount of trading activity, based on volume, for eac

индикатор разработан для торговли на финансовых рынках для скальпинга, пипсовки инструмент использует в своем алгоритме уровни поддержки и сопровождения Это собственная стратегия и уникальная разработка сигналы стрелка вверх покупка стрелка в низ продажа рекомендуется использовать на таймфреймах до м 15 можно торговать от сигнала к сигналу внимание выделяйте на сделку не более 2% от депозита

!!!!UPDATED VERSION!!!!
Multi Currency Strength Indicator is the ultimate simple multi-currency strength dash meter that consists of Signal provider and automated labelled levels, that is effective for beginners and seasoned traders to enhance their strategies. The Author coded the program for the aim of bringing simplicity yet effective indicator that is user-friendly for all who use it. Try it out , its worth a try. INDICATOR INCLUDES: 1.Push Notification to get notifications on MT4 App o

The indicator helps the trader in identifying potential liquidity levels. The algorithm used in this indicator checks the behavior of the asset taking into account the price levels, momentum and volume analysis.
Features:- Parameters for signal optimization and alerts.
Usage:- The levels formed by the indicator can be helpful to traders in identifying potential entries, breakouts or reversals. it can assist traders of technical trading background or even pure price action trading. Examples o

Fibonacci Magic Pivot Levels The Fibonacci Magic Pivot Levels is a powerful yet easy to use indicator . It continuously monitor s intra-day price action and uses complex algorithms to calculate and detect key support, resistance and pivot levels, using the D1 timeframe as a filter. The Fibonacci Magic Pivot Levels is optimized for H4, H1, M30, M15, M5 & M1 timeframes and can be used on ALL Currencies, Indices, Commodities, and Cryptocurrency pairs . Trade with improved confidence an

Торговая система разработана для работы с золотом на временных периодах: 30M, 1H. Индикатор позволяет подстраиваться под рыночную ситуацию.
Параметры для 1H : PERIOD=9F , FILTER=300 .
Параметры для 30M : PERIOD=22B , FILTER=450 .
Допускается небольшая подстройка под конкретного брокера .
При изменении количества отображаемой истории, также может потребоваться подстройка параметров.
Индикатор не перерисовывается .
В "Gold n XAU" используются разные правила для входа в
Start Signal один из самых надёжных инструментов для торговли на финансовых рынках С помощью Start Signal можно торговать как Бнарными Опционами так и на других рынках Таких как Форекс Изначально Start Signal разрабатывался для Бинарных Опционов Но в ходе торгов было принято решение что он так же хорошо подходит и для скальпинга При чем он предоставляет хорошую точность Отлично подойдёт как для новочков так и для опытных трейдеров Сигналы крайне просты и понятные Не нужно анализировать множе

This Weis Wave Volume indicator is a tool to help traders identify the current price trend. Understanding volume can provide insight into a market's behavior to help you determine its overall health. The most important rule is this: volume precedes price. Typically, before a market price moves, volume comes into play. It has 2 main colors histogram which are green and red. – Green indicates an upward wave. The more the price increases, the bigger the green volume gets. – The red color shows a d
FREE

InpRSIshort =13; // RSI short InpRSIPeriod =34; // RSI long PeriodRs =0; //Price 0C 4HL/2 5HLC/3 mafast =13;//mafast maslow =65;//MAslow
Double line RSI sub graph index. The parameters are adjustable. The RSI lines with two different cycles can be used to observe the trend strength effectively. Meanwhile, a short period cross long period color column image is displayed below. When the cycle (Jin Cha) is on the short cycle, the color of the column map changes from the light green to th
FREE

Индикатор Velocity of price change ( VP ) показывает среднюю скорость изменения цены на тех характерных промежутках времени, где эта скорость была приблизительно постоянной. Используемый в VP робастный алгоритм сглаживания цены от ее случайных скачков, обеспечивает надежность показания индикатора, который не реагирует на простую волатильность цены и её незначительные подвижки. Индикатор позволяет отслеживать тренды и моменты их разворотов , во время которых показ
Хорошый и надёжный инструмент если соблюдать правила мани менеджмента Разработан по собственной стратегии на уникальном алгоритме Индикатор полностью заточен под бинарные опционы Binary Luck очень прост в работе настраивать ничего не нужно Просто добавляем на график и можно приступать к торговли Отлично подойдёт как для новачков так и для опытных трейдеров Сигналы простые и понятные. Стрелка вверх покупка. Стрелка в низ продажа. Рекомендуемое время експирацыи 1 свеча. На одну сделку не более 3

Back testing can't; get indicator full performance
Trading the currency markets is a complex business. With so many pairs and multiple timeframes it is almost impossible to monitor them all – but with with the Currency Heatmap you can. The Currency Heatmap indicator delivers the information you need to base your trading decisions on the entire spectrum of currency pairs derived from the 8 major currencies; namely the US dollar, the Euro, the British Pound, the Swiss Franc, the Japanese Yen,
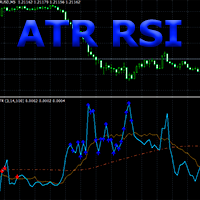
Композиция индикаторов ATR и RSI.
ATR RSI индикатор сопоставляет на одном графике два расчета индикатора ATR с периодами Fast и Slow, плюс линию среднего значения и зоны перекупленности (Overbought) и перепроданности (Oversold) индикатора RSI.
ATR по казывает значения изменения волатильности валютной пары в пунктах с учетом периода, задаваемого в качестве параметра. Точки входа, которые дает индикатор RSI показывают очень хорошее соотношение риск-прибыль на волатильных и трендовых рынках. AT

Follow a step-by-step system that detects the most powerful breakouts!
Discover market patterns that generate massive rewards based on a proven and tested strategy.
Benefits You Get On Indicator: Unique price action based algorithm. Powerful combination to any trading strategy. Auto-detects entry, exit, stop loss & take profit levels. Auto-calculates statistics of signals. Never repaints, never backpaints, never recalculates. Signals strictly on the "Close of the bar". Works in all symbol

XMaster Scalping NEW - простой индикатор определяющий начало и конец тренда. Очень хорошо можно сказать даже идеально подходит как для скальпинга так и для средне/долго срочной торговли. При нанесении на график располагается в подвале, что даёт вам возможность строить трендовые линии/уровни на цене и поглядывать в подвал на индикатор.
Как использовать: Всё просто. Желтый цвет продажи, зелёный покупки. Цвета можно изменить в настройках.
Дополнительная торговая информация: Лучше всего отр
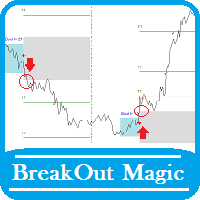
<< See how it works on YouTube >> You can also download the script of this indicator for free here: BreakOutMagic_EA.ex4 Then copy it to the following address: ...\MetaTrader 4\MQL4\Experts Note that in order for the script to work, it must have already downloaded and activated the Break Out Magic indicator from the market. Possibilities:
Arrow signal to buy, sell and hit the targets Alert signal send mail Execute custom audio file The Break Out Magic indicator monitors price fluctuations over
红黄绿简明指示趋势与震荡指标升级版。 使用红黄绿三色来标示上升趋势 、震荡、下跌趋势。 红色表示空头趋势(下跌)。 绿色表示多头趋势(上涨)。 黄色表示震荡区域。 从黄色转变为红色时,行情可能从震荡转变为下跌趋势。一段连续的红色,说明下跌趋势很强。 从黄色转变为绿色时,行情可能从震荡转变为上升趋势。一段连续的绿色,说明上升趋势很强。 指标的上半部分区域和下半部分区域若同步为红色,表明下跌趋势已经形成共振,接下来大概率走出一段空头趋势。 同时,红绿黄分为上下两部分:
若上下部分同时为绿色,表明上涨趋势已经形成共振,接下来大概率走出一段多头趋势。 若上下部分同时为红色,表明下跌趋势已经形成共振,接下来大概率走出一段空头趋势。
若上下同时为黄色,表明当前行情为震荡。 升级版2.0: 新增两条快慢线。 当慢线(Blue/Red线)为蓝色时,视为多头行情。当慢线为红色时,视为空头行情。 当快线(DarkGray线)从下方向上穿过慢线时,作为参考做多信号,激进交易者可进场做多。反之亦然。
参数可调。 //+------------------------------------------
FREE

This indicator show all history orders on chart with the same symbol. It help you see time and price that orders opened and closed. 1) Show all history 2) Open chart with symbol that you need to watch 3) Attach the indicator 4) Press key "h" -Downwards line Blue: sell with profit -Downwards line Red: buy with loss -Upwards line Blue: buy with profit -Upwards line Red: sell with loss.
FREE

This indicator examines the relative strengths of the currencies of 8 different countries and displays the one that has the potential to gain profit in the short term as a suggestion. The relative strength of each country's currency over the selected time period is shown on the graph as a percentage.
The recommended currency according to BuyLevel and SellLevel determined by the user is shown in the bottom right section. The indicator also automatically brings up the 30-minute graph of the sugge
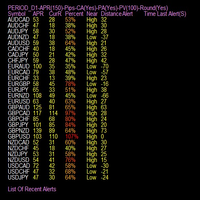
Indicator is able to alert by pop and acoustic alarm the achievement of the average price range of the last periods so as to be able to set our operation. It allows different percentage variables reached and periods of variation according to the parameters entered. Apply your reverse strategies to achieving that threshold so you get higher success rates. Indispensabile per le strategie reverse intraday.
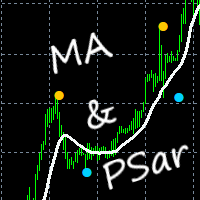
This indicator gives you PSar crossings in the form of blue and yellow dots on the chart, as well as a Moving Average. Parameters: MAPeriod (Change to your preference) Alerts PSarStep PSarShift PSarMaximum How to use: Simply attach to any chart with default settings. Sell on yellow dots, with white MA line above price. Buy on blue dots, with white MA line below price. Best results when checking the higher time frames before entering trades. Best results on Major Pairs, but can also be used on o

This indicator XX Power indicator.Indicator displays trend movement. Indicator helps to buy and sell.In dicator displays arrow and line. Features
FiltPer - displays indicator period.
How to understand the status: If the Trend color is green, trend is up. I f the Trend color is red, trend is down.
//////////////////////////////////////////////////////////////////////////////////////////////////////////////////////////////////////////////////// ///////////////////////////////////////

This indicator is a must have tool that scans the active chart for candlestick patterns. It labels each bar according the candlestick pattern(s) that it finds enabling you to more easily analyze price action and be more informed about your trading decision. There are 103 common and uncommon possible patterns plus 6 new patterns based on research that the indicator can identify. If a candlestick(s) meets the requirements for multiple patterns, the bar will be labeled with up to 4 patterns names f

Currency RSI Scalper - это профессиональный индикатор на базе известного индикатора Relative Strength Index (RSI). Хотя индикатор RSI отлично работает в определенные периоды рынка, он не может генерировать прибыльные сигналы, когда состояние рынка меняется, и, следовательно, выдает неправильные сигналы, которые могут привести к большим потерям. Вы когда-нибудь задумывались об адаптивном индикаторе RSI , который адаптируется в соответствии с рыночными условиями? Представленный индикатор реализуе

Are you looking for Price Levels and Price Channels and Price VWAP and Volume On Balance Indicators ? Now you have all in one !!! With Alarm and Push Notification. Info on your chart is showing you: where current price is and all levels, channels and vwap, how big is current On Balance Volume, is it going Bearish or Bullish, and who has the power, Buyers or Sellers. Up and down arrows showing you growing Seller or Buyer Volume. Lines showing you all Levels and Channels. Search f
FREE
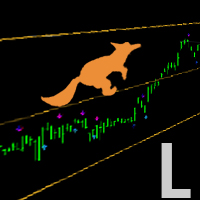
Search for an entry with low risk for trading by Lisek Moving Average Indicator. There are many ways to trade with Lisek Moving Average Indicator: Trend continuation (Trend trading). Trade pullbacks (Range trading). Trade breakouts. Trade reversals. Take profits or set stop-loss based on your MA.
Moving Averages are a frequently used technical indicator in forex trading, especially over 10, 50, 100, and 200 periods. Moving Averages are lagging indicators, which means they don't predict where
FREE

Koala Trend Line Введение: Я сделал этот индикатор, чтобы помочь трейдерам лучше находить тренд, этот индикатор может показать вам текущую линию тренда. Как вы знаете, линия тренда должна проходить между двумя самыми высокими или самыми низкими точками. Итак, основная логика - найти самые высокие и самые низкие точки. Индикатор находит все самые высокие и самые низкие точки в истории и показывает их красными и синими точками. Эти самые высокие и самые низкие точки рассчитываются в соответствии

Этот индикатор позволяет вам управлять размером риска и видеть как меняется лот. Вы можете подобрать оптимальное значение лота для вашего депозита, не открывая реальных позиций. А также оценить новые торговые инструменты. Если вы торгуете вручную, то управление риском, поможет избежать неожиданных убытков. В индикатор включена возможность получать звуковой сигнал при достижении заданного уровня, а также отправлять push уведомления и сообщение на почту.
FREE

Модифицированный Parabolic SAR : Ваш надежный помощник на рынке Эта улучшенная версия индикатора Параболический Сар отлично отображает направление тренда и может стать прекрасным дополнением к вашей торговой стратегии. Преимущества: Отражение направления тренда: Индикатор хорошо показывает направление тренда на рынке, помогая вам принимать осознанные торговые решения. Фильтрация сигналов: Это может быть отличным фильтром, который дополнит вашу стратегию, помогая исключить ложные сигналы и сдел
FREE
индикатор для бинарных опционов сигнал появляется вместе с открытием новой свечи сигнализирует на неё полное отсутствие перерисовки рекомендации сигнал на покупку синяя стрелка направлена вверх сигнал на продажу красная стрелка направлена в низ время экспирацыи рекомендуется 1 свеча используемого таймфрейма если сделка оказалась убыточной можно увеличить сумму и отрыть сделку ещё раз на следующем сигнале
инструмент прост в настройках всего два периода оптимальные настройки иже установле

Murrey Math Multi Timeframe Indicator Support/Resistance
Murrey Math Lines are strong tools to plot the support and resistance levels.
Murrey Math Multi Timeframe Indicator draws multi timeframe MM lines on a smaller tf chart.
General Information: According to Gann, prices move in 1/8's, these 1/8's act as points of price support and resistance as an entity's price changes in time. Given this 1/8 characteristic of price action, Murrey assigns properties to each of the MML's in an a given

After Purchase, Please Contact
t.me/hakimsann
These Indicator are Mixed on All Logical Value Such As
Trend
Support and Resistance
Candle Pattern
Price Action
we Combine
2 Bollinger Band
6 Zigzag Periods
4 Relative Strength Index Period
1 MACD Trend
Support and Resistance
Price Action
Pattern Candle
Avoiding Doji On Market Can Be Applied On Every Market
24-7
Maksimum Martingale lv 5.
First stake 0.4% Balance
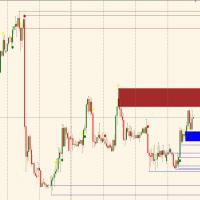
It automatically tracks the supply and demand zones and indicates the current trend. Once you have identified the trend on the main time frame just wait for the price on the operating time frame to arrive in the near future of a demand (buy) or supply (sell) zone and execute the trade. It is recommended to wait for the higher time frame trend and operational time frame to be aligned and operate exclusively on the areas indicated by the. Developed the right awareness you can achieve more and more
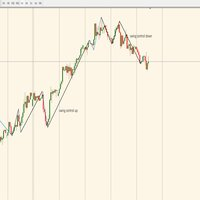
Indicator automatically translates control swings (trend-dominated market) and correction swings (retracing market); It is a simple indicator to be combined with your strategies in order to improve them and enter the market only when the trend is in control; Check on the largest time frame how the market is moving (swing black color control or swing blue color correction) from here, going down from time frame to set its operation in the direction of the trend. OPERATIONAL EXAMPLE: LOCATE DOWNWAR

LinearRegressionDecomposition ( LRD ) Linear Regression Decomposition has been calculated using a very complex method.
Basically, by examining the retractions of the price movements of the instruments on the Metatrader platform, it is aimed to decompose these movements linearly.
The indicator is shown on the graph with two separate lines.
The red line is our main indicator and handles the price divergence.
The blue line filters the red signal.
For example, for a buy signal to occur: the red

The ATR Levels Indicator For MT4 is an indicator that is built specifically for traders who use the Meta Trader 4 for their trading analysis, charting of different currency pairs and trading assets, doing their technical analysis and making trading decisions all through the trading day as they work.
One of the first major advantages of using the ATR Levels Indicator For MT4 is that it automatically helps the trader to spot very important levels in the markets based on the Average True Range In
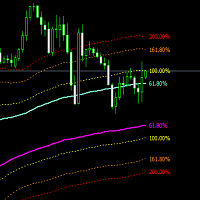
DYNAMIC CHANNEL Forex is a Metatrader 4 (MT4 (MT4)) indicator and the essence of this technical indicator is to transform the accumulated historical data. Forex DYNAMIC CHANNEL Indicator provides for an opportunity to detect various peculiarities and trends in price dynamics which are invisible to the naked eye. Based on this information, traders can assume further price movements and adjust their strategy accordingly.
Dynamic channel, which is calculated based on the maximum distance between

What Is Currency StrengtT Indicator?
A currency strengthT indicator is a graphical tool that shows the strength of a currency. Common indicators usually show the strength of a currency in relation to another currency, however, with some calculations it is possible to find the absolute strength of each individual currency.
Therefore, a currency strength matrix indicator (or meter) is a tool that tries to express the absolute strength of a currency, so that you can compare this strength with
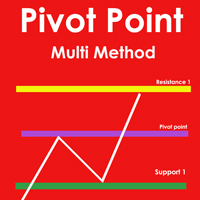
Pivot Point Multi Method is a fully automatic pivot point indicator and indicate support and resistances (S1,S2,S3,S4,R1,R2,R3,R4) based on four Methods that you can select on of them Pivot point detection and drawing support resistances Methods( Classic ,Camarilla ,Woodie ,Fibonacci)
Pivot Point Multi Method is working on all time frames and all currency pairs and gold silver and crypto currencies .
Recommended Setting : Pivot_Method select one of the methods ( Classic ,Camarilla ,Woodi

Perfect Entry Spotter Indicator with Alert is based on a combination of Support Resistance, Fractals, Alligator and Moving Average indicators, based on an intense research. It has alert included with option to enable/disable it. You can trade based on it with high accuracy. Recommended trading rules: 1. Buy - Wait for the Lime arrow to appear and trade in the direction of the trend (trend going up). 2. Sell - Wait for the Red arrow to appear and trade in the direction of the trend (trend going d

This indicator is customizable to whatever settings you preferred
you only buy above the ema, and sell only under the ema using the stochastic as an entry and the ema to filter bad trades DEFAULT SETTINGS: Stochastic(8,3,3) EMA (200) *Non-Repainting
*For Desktop MT4 Only
*Great For Scalping
*Great For Swing Trading
*Arrow Entry Alerts
*Mobile Alerts
*Works On Any Timeframe
*Works On Any Mt4 Pair

This indicator identifies the major and minor swing high and low points on a chart. It then takes the most recent swing and draws a fibonacci pattern of retracement and extension levels to give you an idea of where price may move next. It allow allows you to set a pair of moving averages to help identify the direction of the overall trend. There are configuration parameters for the major and minor swing and the moving averages.

нестандартный подход к стандартному индикатору скользящей средней. суть индикатора состоит в определение силы и быстроты направление цены определением угла наклона скользящей средней. берется точка на пятнадцатой свечи MA и точка на последней закрытой свече MA, между ними проводится прямая линия, она подвижна и на полусфере показывает угол наклона от 90 градусов до -90. выше 30 градусов зона покупок, ниже -30 градусов зона продаж. выше 60 градусов зона сильных покупок ниже -60 сильных продаж. ин

Сбалансированный вход VArmadA
Простой, но мощный фрактальный индикатор поддержки/сопротивления
Работает с таймфреймами 1Н и выше и протестирована на всех основных парах. Обратите внимание на сигнал: Стрелка, указывающая на длинную или короткую запись.
Как это работает:
Стрелки указывают на обратную поддержку/сопротивление. Стрелка вверх означает длинную - стрелка вниз указывает на короткую сделку.
Инструкции:
- IndicatorLong/IndicatorShort: Выберите цвета для стрелок данного
FREE

Описание
Bitcoin Manager - лучший индикатор для торговли на криптовалюте Биткоин. Он рассчитывается на базе отклонения цены от канала скользящих средних линий. Восходязие и нисходящие стрелки указывают потенциальные точки и уровни для открытия позиций на покупку и продажу.
Как использовать?
Настоятельно рекомендуем использовать этот индикатор на таймфрейме H1. Стрелка вверх указывает на уровень для покупки. Стрелка вниз - уровень для продажи.
Параметры
Maximum History Bars - максима

Индикатор TrueChannel показывает нам истинные каналы движения цены. Этот индикатор своим видом напоминает Donchian Channel , но построен на основе совершенно иных принципов и дает более адекватные торговые сигналы. Как показано в статье цена на самом деле движется в каналах параллельных временной оси и резко – перепрыгивает из предыдущих каналов в последующие. Установить такое движение цены позволяет индикатор Probabilities distribution of price ( PDP ). Индикатор
FREE
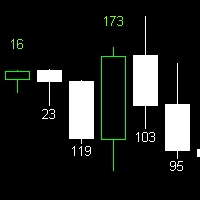
Candle Size Indicator Explore the candle size using this convenient indicator. It works across various timeframes, providing valuable insights for technical analysis. Key Features: Display the size of the candle after configuring the indicator. Compatible with all timeframes. The size of the candle is a significant metric in technical analysis, offering insights into market strength and volatility. This indicator enables clear and accurate visualization of candle sizes on your chart. Utilize thi
FREE

Hello Traders, A very simple but useful tool for an automatic traders. An indicator that allows you to adjust the speed of the strategy tester in a very simple way. Just drag the indicator into the chart before launching the strategy tester and adjust the speed manually, and that's all! Buttons can be located in any part of the chart as you like, just enter the x and y coordinates --------------------------------------------------------------------------------------------------------------------

BolingCustom is a Trend indicator designed for all Time frames and all currency pairs. For a better experience, it is recommended to use in time frames above 15 minutes.
Due to its understandable and simple presentation on the chart, even beginners can easily learn how to use it.
If you have any problems or questions, let us know. We will be happy to contact you: Direct massage
How this indicator works is that it shows the trend using a combination of several indicators such as the Bo
FREE
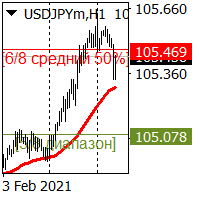
Индикатор точно отображает уровни поддержки и сопротивления. Визуализирует на графике важные сильные уровни и уровни средней силы.
Важно, индикатор не перерисовывается в зависимости от смены таймфрейм.
Индикатор можно использовать для любой формы торговли, скальпинг, среднесрок.. на любой валютной паре.
Для среднесрочной торговли рекомендуем использовать параметры по умолчанию. Все параметры в индикаторе настраиваемые. Линии индикатора выводится в основное ценовое окно.
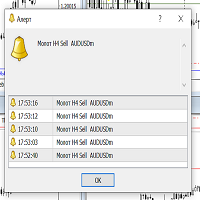
Индикатор полезен для опытных трейдеров и новичков. Отображает свечной паттерн МОЛОТ. Одновременно сканирует Н1, Н4, D1 и выводит соответствующий alert на экран в сопровождении звукового сигнала. В alert отображается информация о таймфрейм паттерна и торговом символе на котором паттерн появился. Принимать решение о входе в рынок на основании паттерна только Вам. Поскольку входить в рынок лучше от уровней поддержки и сопротивления, рекомендую использовать данный индикатор одновременно с индикатор

Day Trades Resistance and Support (daytradesSR) is an indicator composed of 1. The main line (support/resistance line), which shows i. either UP or DOWN trend ii. levels of dynamic support or resistance 2. A specific range defined by a line for range high and another line for range low. These lines serve as weak secondary support or resistance . 3. When the main line (support/resistance line) is first hit by the price after a detected trend reversal , either an UP ARROW (sup
Узнайте, как легко и просто купить торгового робота в MetaTrader AppStore - магазине приложений для платформы MetaTrader.
Платежная система MQL5.community позволяет проводить оплату с помощью PayPal, банковских карт и популярных платежных систем. Кроме того, настоятельно рекомендуем протестировать торгового робота перед покупкой, чтобы получить более полное представление о нем.
Вы упускаете торговые возможности:
- Бесплатные приложения для трейдинга
- 8 000+ сигналов для копирования
- Экономические новости для анализа финансовых рынков
Регистрация
Вход
Если у вас нет учетной записи, зарегистрируйтесь
Для авторизации и пользования сайтом MQL5.com необходимо разрешить использование файлов Сookie.
Пожалуйста, включите в вашем браузере данную настройку, иначе вы не сможете авторизоваться.