Смотри обучающее видео по маркету на YouTube
Как купить торгового робота или индикатор
Запусти робота на
виртуальном хостинге
виртуальном хостинге
Протестируй индикатор/робота перед покупкой
Хочешь зарабатывать в Маркете?
Как подать продукт, чтобы его покупали
Новые технические индикаторы для MetaTrader 4 - 101

Индикатор " ZigZag on Trend " представляет из себя помощника в определении направления движения цены, а так же калькулятора баров и пунктов. Состоит из трендового индикатора, следящей за направлением цены трендовой линией представленной в виде зигзага и счетчика вычисляющего число баров пройденных в направлении тренда и количество пунктов по вертикальной шкале.(расчеты ведутся по открытию бара) Индикатор не перерисовывается. Для удобства исполнен в виде окрашенных баров или в виде линий. Можно и
Trend Scanner - это трендовый индикатор, помогающий определить текущее и прогнозируемое направление рынка с помощью продвинутого алгоритма. Благодаря гибким настройкам оповещения, индикатор своевременно предупредит вас о развороте тренда. Индикатор интуитивно понятен и прост в использовании, и станет отличным фильтром в ваших трендовых торговых стратегиях. Линии данного индикатора, так же являются отличным динамическим уровнем для стоп-лосса, и применяется как один из видов трейлинг-стопа в Торг
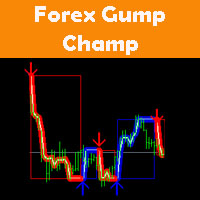
ForexGumpChamp является профессиональной торговой системой. С помощью данной торговой стратегии работают многие известные форекс трейдеры и управляющие инвестора. Мы как разработчики проанализировали их торговую стратегию и конвертировали ее в простой и понятный индикатор. ForexGumpChamp сам анализирует рынок и дает трейдеру простые и понятные сигналы на открытие и закрытие сделок. Для того, чтобы сделать Вашу работу еще проще и избавить от потребности постоянно находиться за компьютером, мы инт

BeST Oscillators Collection is a Composite MT4 Indicator including the Chaikin,Chande and TRIX Oscillators which by default are contained in MT5 but not in MT4 platform. It also provides the option of displaying or not a Mov. Avg. as a Signal Line and the resulting Signals as Arrows in a Normal (all arrows) or in a Reverse Mode (without showing up any resulting successive and of same type arrows). Analytically for each one of the specific Oscillators: The Chaikin Oscillator ( CHO ) is
FREE
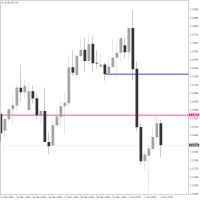
Crosshair Levels : Free version of Object Synchronizer. ** No synchronization of objects among grouped charts and no group chart features supported in this version. Are you bored to save and load template many times for the same symbol for many chart time frames? Here is the alternative. With this indicator, you enjoy creating 3 objects. All objects that you created/modified always are moved easily with clicking the object, moving cursor to the point you wanted and clicking again). Supported
FREE

Индикатор My Big Bars (мои большие бары) показывает бары (свечи) более старшего таймфрейма. То есть, если открыт график с таймфреймом H1 (один час), индикатор "подкладывает" снизу график с таймфреймом H4, D1 и так далее. Используются следующие старшие таймфреймы: M3, M5, M10, M15, M30, H1, H3, H4, H6, H8, H12, D1, W1 и MN1. Индикатор автоматически подбирает только те старшие таймфреймы, которые больше текущего и кратны ему. Если открыт график с таймрфеймом M30 (30 минут), то среди старших таймфр
FREE

Trump Day индикатор для эффективнoй прибыльной торговли бинарными опционами полное отсутствие перерисовки Cтрелка указывает направление следующей свечи и возможного направления тренда процент правильных прогнозов индикатора от 80%. его преимущества: точность сигналов. полное отсутствие перерисовки. Вы сможете выбрать абсолютно любой инструмент. индикатор обеспечит точные сигналы. Рекомендуется открывать сделки на 2 - 3 свечей. плюсы индикаторa: 1. опережающие сигналы. 2. высокая точность сы

Dark Sniper стрелочный индикатоp. полное отсутствие перерисовки процент правильных прогнозов индикатора от 80 85% Cтрелка указывает направление следующей свечи и возможного направления тренда в дальнейшем. подходит для маленьких таймфреймов м1. Pекомендуется открывать сделки от 1 до 2 свечей. Сигнал появляется на прошлой свечи плюсы индикаторa: 1. опережающие сигналы. 2.полное отсутствие перерисовки 3. высокая точность сигналов. 4. чaстота появления сигналов.

Open High Low Close Внешняя Свеча
Индикатор внешних свечей наложенных на график с выбранными вами тайм фреймом.
Наглядно отображаете уровни OHLC и пройденное значение ATR текущей свечи и свечей в истории.
OHLC — аббревиатура, дословно расшифровывается как:
O — open (цена открытия интервала (бара или японской свечи)).
H — high (максимум цены интервала).
L — low (минимум цены интервала).
C — close (цена закрытия интервала).
Данный индикатор наглядно покажет трейдеру, уровень открыт
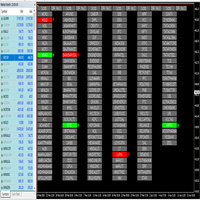
* Compatible with MCX, NSE, Futures, Forex. * No need to monitor individual script. * Sound Alert and Popup on new signal. * Change Number of previous candles to signal to be generated. * Single Click To See Live Chart From Defined Templates * Custom List of Script Can be Made
*Parameters of Each Indicator can be changed for Scanning * Scan based on multiple indicators like: - Moving Average Crossover (All Types of MA) - RSI - Parabolic SAR - Stochastic - M

This indicator mostly inspired from BW-ZoneTrade custom indicator from MT5. How To Use:
BUY when both dots colored Green. SELL when both dots colored Red. In addition to original one, MACD-OsMA-generated signal also can be drawn. Input Description:
MA_period_short: Faster EMA period for MACD. Applied when drawMACD is true. MA_period_long: Slower EMA period for MACD. Applied when drawMACD is true. MACDperiod: MA period for MACD. Applied when drawMACD is true. drawMACD: When true, draw an addi
FREE

KT Trend Magic shows the trend depiction on chart using the combination of market momentum and volatility. A smoothing coefficient is used to smooth out the noise from the signal.It can be used to find out the new entries or confirm the trades produced by other EA/Indicators.
Usage
Drag n drop MTF scanner which scans for the new signals across multiple time-frames. Find new entries in the trend direction. Improve the accuracy of other indicators when used in conjunction. Can be used as a dyna

This indicator displays XR Power Trend movement.Indicator displays Moving Average period 5,Moving Average period 26,Moving Average period 52,Commodity Channel Index,MACD,Average Directional Movement Index,Bulls Power,Bears Power,Stochastic Oscillator,Relative Strength Index,Force Index,Momentum,DeMarker,average movement.Indicators period is standard period.
Features X - move the trend left and right. Y - move the trend up and down.
How to understand the status: If the Trend color is green

Introduction
This indicator alerts you when certain price levels are reached. The alert can be on an intrabar basis or on a closing price basis. It will also send alerts when one forms, including via e-mail or push notification to your phone . It's ideal for when you want to be notified of a price level being reached but don't want to have to sit in front of your chart all day.
Input Parameters
DoAlert: if set to true a desktop pop-up alert will appear from your MetaTrader terminal whe

A simple but very useful indicator that allows you to display the current date and time on the chart. Especially useful when you save your analysis or trades.
Features: show local date and time show server date and time show remaining time to end the current timeframe interval customizable display parameters - show/hide date or time set display position set display size set display color works on every timeframe

Scalping Trender ***Specialized for scalping trading on timeframe 5m & 15m***
work best with: **USDMXN m5 **USDMXN m15 **GBPJPY m15 **EURJPY m15 **USDTRY m15 **EURTRY m15
Scalping Trender use smart algorithm detects the price circles with time . give strong signals at the right time as result of combine the price and time.
our team spent months to develop this indicator specially for Scalping..with high success rates about 89% win trades .
Advantages Easy, visual and effective

This indicator helps you to find price that may cause MACD Signal crossover on the current bar.. These crossover points are depicted in form of stars (like Parabolic SAR).
prevEMA line also helps you to decide the trend.
Get 20% OFF for rents for 1 year! How to use:
MACDSignalStars (Violet) stars displayed are the the prices that make the MACDmain = MACDsignal.
If the close price is higher than the star, then MACDmain > MACD signal. If the close price is lower than the star, then MACDmain
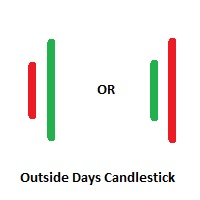
Outside Days Candlestick Bulkowski The Outside days candlestick is a well-known candle pattern composed of two candles. This indicator for showing outside days candlestick that describe by Thomas Bulkowski.
If you need for MetaTrader 5 version, please visit here: https://www.mql5.com/en/market/product/34406
Feature Highlights Show outside days candlestick. Customizable "Symbol". Customizable symbol distance from candlestick.
Input Parameters Symbol - Input symbol code from "wingdings" for

KT Pin Bar identifies the pin bar formation which is a type of price action pattern which depicts a sign of reversal or rejection of the trend. When combined with support and resistance, BRN and other significant levels, Pin Bar pattern proved to be a very strong sign of reversal.
Basically, a pin bar is characterized by a small body relative to the bar length which is closed either in upper or lower 50% part of its length. They have very large wicks and small candle body.
A pin bar candlest

KT Auto Fibo draws Fibonacci retracement levels based on the ongoing trend direction. The Highs and Lows are automatically selected using the Maximum and Minimum points available on the chart. You can zoom in/out and scroll to adjust the Fibonacci levels accordingly.
Modes
Auto: It draws the Fibonacci levels automatically based on the chart area. Manual: It draws the Fibonacci levels only one time. After that, you can change the anchor points manually.
Usage: Helps to predict the future pr

KT Psar Arrows plots the arrows on chart using the standard Parabolic SAR indicator. A bullish arrow is plotted when the candle's high touch the SAR. A bearish arrow is plotted when the candle's low touch the SAR. The signals are generated in the real-time without waiting for the bar close.
Features
A beneficial tool for traders who want to experiment with the trading strategies that include the use of Parabolic Sar indicator. Can be used to find turning points in the market. Use custom PSA

Индикатор Sensitive Signal ( SS ), используя разработанные автором методы фильтрации (что включают и кластерный мультивалютный анализ), позволяет с большой долей вероятности устанавливать начало истинного (отфильтрованного от помех – случайных блужданий цены) трендового движения, что очень эффективно для торговли . Разработанная автором фильтрация проводится в несколько итераций и выявляет истинную траекторию закономерного движения цены (точнее, наиболее вероятную кривую такого д

Данный индикатор отображает точки входа в рынок и точки выхода, которые определяются по заданному расстоянию в пунктах. В основе взят индикатор Parabolic, различные математические и статистические методы. Индикатор помогает во многих случаях пропустить ложные входы, линия поддержки и сопротивления огибает цену в определенном режиме, снижая убытки. Информационная панель показывает результаты работы индикатора, чтобы можно было его настроить более точно и видеть, как параметры влияют на результа

Индикатор выводит на график статистику торговли анализируемого Сигнала маркета. Данные по сделкам Сигнала представляются в файле формата excel (csv) и могут быть взяты со страницы Сигнала > История сделок ( Экспорт в CSV: История ). Скопированный файл нужно сохранить в директорию МТ4>File>Open Data Folder>MQL4>Files. Доступно управление цветом и шрифтом выводимых результатов. В случае различия имен инструментов на счете Сигнала и на счете пользователя используйте параметры Prefix и Suffix .
FREE

SmartStochasticMt4 - универсальный индикатор для принятия торговых решений. Незаменимый инструмент для начинающих трейдеров, так как не имеет настроек и полностью готов к работе после установки.
Преимущества индикатора:
1. Работает с любым торговым символом
2. Работает на любом временном периоде
3. Не имеет настраиваемых параметров
4. Представляет полную картину торговой ситуации с разных временных периодов
5. Не запаздывает
Работа с индикатором
1. Установить индикатор
2. Исключить из
FREE

FIBO ALERT https://www.mql5.com/en/market/product/34921
This indicator draws a fibonacci retracement (high and low) of a candle. It alerts and notifies the user whenever price touches or crosses the fibonacci levels. INPUTS ON Alert: set to true will alert pop up whenever price crosses levels at chart time frame. ON Push: set to true will send push notification to phone whenever price crosses levels at chart time frame. ===== FIBO (High & Low) ===== Time Frame: indicator draws fibonacci lev
FREE
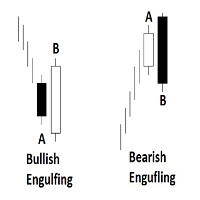
Engulfing Candlestick Bulkowski The engulfing candlestick is a well-known candle pattern composed of two candles. This indicator for showing engulfing candlestick that describe by Thomas Bulkowski.
If you need for MetaTrader 5 version, please visit here: https://www.mql5.com/en/market/product/34183
Feature Highlights Show bullish engulfing and bearish engulfing. Customizable "Up Symbol". Customizable "Down Symbol". Customizable symbol distance from candlestick. Customizable "Down Color". Cus
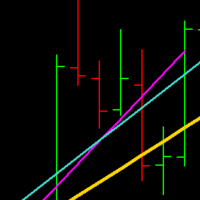
TrueRegression will calculate the linear regression of a given sequence of bars, and display the line of best fit on the chart. Regression is used to determine whether a market is currently trending, and whether sub-trends are occurring, which can hint at a potential breakout situation. The indicator will recalculate every 'n' bars (defined by the user input). When the indicator re-draws, it will keep the original lines on the chart, unmodified, so they can be referenced by a custom EA, or by th

Advanced Currency Strength Indicator
The Advanced Divergence Currency Strength Indicator. Not only it breaks down all 28 forex currency pairs and calculates the strength of individual currencies across all timeframes , but, You'll be analyzing the WHOLE forex market in 1 window (In just 1 minute) . This indicator is very powerful because it reveals the true movements of the market. It is highly recommended to analyze charts knowing the performance of individual currencies or the countries ec

This indicator displays the histogram and arrows on chart. When Simple The Best Pro are placed on a chart, they identify the trend. The color of may be blue or red. The blue color stands for upside moves and the red color stands for downside trends. The indicator offers to set Stop Loss (SL) and Take Profit (TP) setting. The default value is ATR. Indicator has automatic optimization. The STB is a unique indicator that shows the tendency (button Bars) of a particular signals. The STB tells us

Принципы построения индикатора. Индикатор Absolute Bands ( AB ) напоминает своим видом и функциями индикатор Bollinger Bands , но только более эффективен для торговли из-за существенно меньшего количества выдаваемых им ложных сигналов, что обусловлено его более робастным характером. В индикаторе Bollinger Bands по обе стороны от скользящего среднего – Ma откладываются среднеквадратичные отклонения Std=Sqrt(<(X- Ma )^2>) (где X - история цены, <…> - процедура усред
FREE

This indicator will allow you to evaluate single currency linear regression.
WHAT IS LINEAR REGRESSION?(PIC.3) Linear regression is an attempt to model a straight-line equation between two variables considering a set of data values. The aim of the model is to find the best fit that can serve the two unknown values without putting the other at a disadvantage. In this case, the two variables are price and time, the two most basic factors in the Forex market. Linear regression works in such a wa
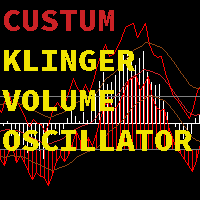
Or (KVO) determines the long-term trend of money flow while remaining sensitive enough to detect short-term fluctuations.It u ses the key price compared to the prior bar's key price to assign volume as positive or negative value. Volume is a measure of how many units of a pair are trading per unit of time.You can choose between a KVO line, histogram, or both combined with this Klinger Volme Oscillator.The Klinger Volume Oscillator is a trend reversal indicator. It relies on the concept of a vol
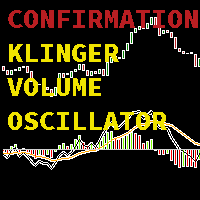
Or (KVO) determines the long-term trend of money flow while remaining sensitive enough to confirm short-term reversals.It u ses the key price, and increasing and decreasing bars compared to the prior bar's key price and increasing and decreasing bars to assign volume and the trend as positive or negative values. Volume is a measure of how many units of a pair are trading per unit of time, while the increasing and decreasing bars are a measure strength of the trend the trend .The Klinger Volume O

Update: For those who want to manually backtest this indicator, check this tool https://www.mql5.com/en/market/product/59248
The indicator will help make your calculation of stop loss easier as it will be visually aiding you in choosing where to put your stoploss level on the chart by calculating the current value of ATR indicator. For those who are unfamiliar with ATR, it is a useful indicator to calculate stoploss for trend following strategy. If volatility is high, ATR stoploss level will b
FREE

A lmas Wall Street - профессиональный стрелочный индикатор без перерисовки. Сигналы появляются одновременно с формированием свечи. Рекомендации по торговле : Войдите в сделку минимум на 2 свечи или на следующей свече после сигнала за 1 свечу. Скриншот 5. Красная стрелка вниз указывает на необходимость рассмотрения продаж, а синяя - на покупку. Все, что вам нужно настроить, это цвета сигнальных стрелок. Рекомендуется применять этот индикатор для скальпинга на временных интервалах M1-M5. Сигналы

Brilliant Wall Street является профессиональным стрелочным индикатором. O н основан на математическом расчете. благодаря специальному алгоритму расчета который разрабатывался лутшыми спецыалистами он не опаздывает более того он дает опережающие сигналы . --------- практически полное отсутствие перерисовки---------. сигналы появляются вместе с появлением свечи. Bходить в сделку минимум на 1-2 свечи рекомендуется на следующей свечи но можно и на сигнальной. . Красная стрелка вниз указыв

Insider Sniper MTF это стрелочный индикатор для торговли от уровней поддержки сопротивления ---полное отсутствие перерисовки---
он умеет определять уровни поддержки сопротивления находит най лутшые точки входа и показывает их стрелочками
Если формируется тенденция, индикатор всегда оповестит с помощью стрелочного сигнала . сигнал на покупку синяя стрелка на продажу красная стрелка.
Этот сигнальный инструмент также можно применять на боковом движении рынка. Главное, чтобы оно было волати
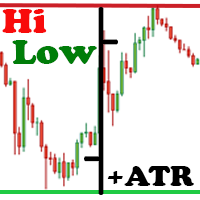
Индикатор Hi Low Last Day ( Hi Lo Last Day ) показывает максимум и минимум прошлого торгового дня и второго торгового дня. Существует множество торговых стратегий по дневным уровням. Этот индикатор незаменим при использовании таких торговых стратегий. На самом деле, в торговле все просто, нужно только это понять и принять для себя. Есть только цена!!! А что такое цена? На графике это уровень. Уровень - это цена, которую сдерживает покупатель и продавец. Какую цену сдерживает контрагент? Цену
Highly configurable OBV indicator.
Features: Highly customizable alert functions (at levels, crosses, direction changes via email, push, sound, popup) Multi timeframe ability Color customization (at levels, crosses, direction changes) Linear interpolation and histogram mode options Works on strategy tester in multi timeframe mode (at weekend without ticks also) Adjustable Levels Parameters:
OBV Timeframe: You can set the lower/higher timeframes for OBV. OBV Bar Shift: Y ou can set the offs
FREE

This indicator helps you to comfirm SMAs' crossovers by draw a signal line that determines SMA movement direction. when Short SMA cross above Long SMA and Close price is above the signal several bars later, then uptrend is expected. when Short SMA cross below Long SMA and Close price is below the signal several bars later, then downtrend is expected.
Input Description :
MA_Period_short: Short-term SMA's period. Used for short-term PriceX. Must be higher than 1. MA_Period_long: Long-term SMA'
FREE

Introduction Professional traders use pivot points as support/resistance levels or as an indicator of a trend. Basically, a pivot point are areas at which the direction of price movement can possibly change. What makes pivot points so popular is their objectivity as they are recalculated each time the price moves further. The pivot points indicator implements 5 popular pivot points calculation and drawing: Standard – The most basic and popular type of the pivots, each point serve as an indica
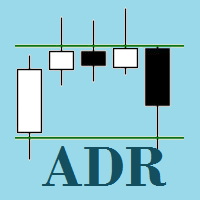
Average Daily Range (ADR) SR is an indicator which shows how far a currency pair can move in a day. It can be used to find hidden support and resistance levels (SR), estimate effective profit and stop loss targets, and provide short term trade signals from the hidden SR levels. Features
Automatically plots on the chat, the top and bottom of the ADR value (i.e. a horizontal channel) which acts as Support and Resistance Levels Automatically calculates the percentage of the ADR reached by the curr

This indicator will generate signal from other indicators like RSI, MA, Force Index etc into one confluent signal.
Which indicators to be used is up to the users to decide. You can add a simple MA, OsMa, RVI and ADX to see how these indicators will work out when combined together, an arrow will be drawn onto your chart where confluence happens.
And if that combination doesn't seem so good, then tweak the setting a little bit or remove it completely or add another different indicator, as you
Psychological or Round Levels indicator automatically draws lines or zones at the psychological levels (00 or 50) as the market moves. New lines are drawn as the market moves while the old lines are deleted. This ensures that your chart is clutter-free. The user specifies the number of lines preferred on the chat, and the indicator keeps the number of lines constant. The indicator plots two types of levels, the Main Level (00 levels e.g. USDCAD 1.33000, 1.34000) and the Sub Level (50 levels -

The indicator signals about "Impulse near!" or "Reversal point near!" The arrow-signal does not disappear and does not redraw after a bar closes. On next bar you may to open orders: buy stop && sell stop. Working timeframe: D1, H4, H1, M30, M15. The indicator parameters Momentum soon Period1 18 Calculation period 1 Period2 37 Calculation pe

KT COG is an advanced implementation of the center of gravity indicator presented by John F. Ehlers in the May 2002 edition of Technical Analysis of Stocks & Commodities magazine. It's a leading indicator which can be used to identify the potential reversal points with the minimum lag. The COG oscillator catches the price swings quite effectively.
MT5 version of the same indicator is available here KT COG Advanced MT5
Calculation of COG The COG indicator is consist of the two lines. The mai

Demarker levels cross Alert is a modified version of the classic Demarker indicator, with email and mobile alert when demarker cross High or Low levels, default levels setting are: low=0.1 and High=0.9 and Demarker of periode=10, you can modify all these entries to find the best setting for every Pair or Stock. Basically these Alerts are reversal Alerts, you will get: 1-Buy alert when Demarker cross above Low level. 2-Sell alert when Demarker cross below High level. -----------------------------

Price Momentum Index (PMI) Price Momentum Index (PMI) is a powerful and easy to use indicator. It can use for any currency and timeframe. Features Noise reduction. Trend detection. No lag. Good entry point detection. Good TP guide line. All in one window, easy to use and make decision. How to Use Prepare entry - When the PMI line (aqua) is between Signal (yellow) and Sinal2 (red) line. Entry - When the PMI (aqua) line breaks through Signal1(yellow) or Signal 2 (red) line. Exit - When the PMI li

(В настоящее время скидка 30%)
Прежде чем читать описание этого индикатора, я просто хочу познакомить вас со следующей концепцией.
ДВИЖУЩАЯСЯ СРЕДНЯЯ ЛИНИЯ - Типичная скользящая средняя, основанная только на одном графике.
ЛИНИЯ НАПРАВЛЕНИЯ ВАЛЮТЫ- Скользящее среднее определенной пары, в которой сила основана на 28 парах. Можно сказать как НАСТОЯЩАЯ ДВИЖУЩАЯСЯ СРЕДНЯЯ ЛИНИЯ.
Скользящая средняя действительно является одним из самых популярных индикаторов, который использует поч

Цель приборной панели - обеспечить быстрый обзор дневного, недельного и месячного диапазона настроенных активов. В "режиме одного актива" приборная панель показывает возможные точки разворота прямо на графике, тем самым делая статистику доступной для торговли. При превышении заданного порога приборная панель может отправить оповещение на экран, уведомление (на мобильный MT4) или электронное письмо.
Использовать эту информацию можно по-разному. Один из подходов заключается в том, что актив, с

Уникальная авторская стратегия, одновременно определяющая разворот тренда, точки входа и предполагаемые уровни получения прибыли по каждой сделке. Индикатор может определять точки входа на любом торговом периоде, начиная с графика М5 до W1. При этом для удобства пользователя по определенной точке всегда рисуется стрелка и строятся рекомендуемые уровни получения прибыли (Take Profit1, Take Profit2, Manual Take Profit) так же отображается уровень ограничения убытков Stop Loss. Огромным плюсом ин

(Перевод с Google)
смысл Индикатор SuPrEs указывает расстояние до следующей горизонтальной линии, имя которой начинается с настроенного префикса (см. Параметры).
использование Нарисуйте сопротивления и опоры на графике и позвольте индикатору предупредить вас, как только настроенное расстояние окажется ниже. Используйте префикс для предоставления линий сигнализации для других линий, а также для стандартных линий (см. Скриншот с индикатором поворота).
Отображение индикатора Индикатор отображ
FREE

(Перевод с Google)
смысл Панель инструментов должна помочь получить быстрый обзор корреляций различных базовых факторов друг с другом. Для этого серии значений сравниваются по методу Пирсона. Результатом является значение корреляции (в процентах).
использование Существуют разные методы корреляции. В так называемой керри-торговле базовый актив покупается. Пара с сильной отрицательной корреляцией продается. Соответствующие свопы играют важную роль в этом методе. Другой метод заключается в хедж

This indicator allows you to analyze the hidden trends and correlations between the 8 most traded currencies via unique strength meter which creates multiple charts in a single window based on the price action of each currency in relation to all other currencies. The indicator also includes interactive panel where you can see the trends for all 28 pairs as well as the distance to the highest and the lowest price for the selected period. With this panel you can switch between currency pairs with

Scalping Binary option Pro является стрелочным индикатором . ----------- полное отсутствие перерисовки----------- . В тестери стратегий индикатор работает не корректно. Красная стрелка вниз указывает, что нужно рассматривать продажи, а зелёная – вверх (покупки). Всё, что нужно настроить, это цвета сигнальных стрелочек, а также включение или отключение звукового сигнала, когда появится сигнал в ту или иную сторону. Лучше всего использовать в трейдинге высоковалатильные пары с небольшим спредом .

The intention of the dashboard is to provide a quick overview of the daily, weekly and monthly range of configured assets. In "single asset mode" the dashboard shows you possible reversal points directly in the chart, thus making statistics directly tradable. If a configured threshold is exceeded, the dashboard can send a screen alert, a notification (to the mobile MT4) or an email. There are various ways of using this information. One approach is that an asset that has completed nearly 100% o
FREE

Данный индикатор помогает трейдеру принять окончательное решение. Когда уже определились, в какую сторону будет разворачиваться цена, остаётся как можно точнее определить сам разворот. Именно эту задачу и выполняет индикатор "Konkov". Индикатор устанавливается на графики М1 и М5. Параметры индикатора: для графика М1 time_frame1 5 time_frame2 5 time_fra
FREE

The dashboard should help to get a quick overview of the correlations of different assets to each other. For this, the value series are compared according to the Pearson method. The result is the value of the correlation (in percent). With the new single asset mode, you can immediately see which symbols have the highest positive or negative correlation. This prevents you from accidentally taking a risk on your trades with highly correlated symbols. Usage There are different methods for the corre
FREE
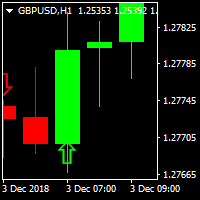
PIPs Forecast Indicator A traders perfect tool to catch big pips in the market One of its kind indcator that gets you in the game early enough
Supporting Multi-Currencies Works on all time-frames but if you're not a scalper stick to H1,H4,D1, W1 and MN for good results. Comes Pre-configured to ensure consitency Can be used alongside other indicators to avoid accumulation regions and Asian session ranges. For details, MT5 and EA questions feel free to contact me on elllykamau@gmail.com
Now wi

BeST_Trend Scanner is an MT4 Indicator that uses a proprietary algorithm in order to identify the most likely levels and probable moment for an upside or a downside trending price move.
BeST_Trend Scanner is a very useful tool that defines in advance and with a high statistical percentage of accuracy the subsequent Resistance & Support Levels of the anticipated upside or downside trending move of price and so
When used at its Reverse Entries Mode :
It generates Buy or Sell arrows at the

This indicator is based on the ADX indicator and indicates the trend very easily.
You can customize the indicator to your needs: ADXPeriod ADXSignal_Level BarWidth CandleWith HeikenAshi
The Adx color candles indicator is fully FREE and compatible with the other part of the system; the Acc arrow >>>> https://www.mql5.com/en/market/product/33770 ENJOY and check out my other indicator: https://www.mql5.com/en/market/product/32111
FREE

The ' Average OHLC ZigZag ' indicator was designed for entry confirmations as well as scalping with a larger trend. A custom formula to average the last two bars to generate arrows following market trends with bar 1 confirmation.
Key Features An extreme scalper calculating the averages between the last two market periods to generate a buy or sell arrow. No settings are available due to it's simplicity of custom price action pattern and using repainting four OHLC prices.
Input Parameters Zig
FREE

EZT_Ichimoku_MTF
Multitimeframe Ichimoku indicator. Display up to 4 different Ichimoku on the chart. Every line of every ichimoku is customizable, you can turn off/on or choose different thickness or color. You can choose to see only the cloud in multiple ichimokus.
Optional info panel to identify the different Ichimokus. Works the same way like the original Ichimoku indicator.

This indicator is based on the ADX indicator and gives you safe entry points.
You can customize the indicator to your needs: RISK SSP COUNTBARS
The only condition that has to be met when entering a trade is, that the arrow faces in the same direction as the Adx color candles.
Download the FREE DEMO and test it!
The Acc arrow indicator is compatible with the other part of the system; the fully FREE Adx color candles
>>>> https://www.mql5.com/en/market/product/33768
ENJOY and ch

MARKET PREDATOR 1 --------------------------------------------------- This powerful and reliable indicator is based on a custom trend following strategy. It does not signal against the obvious trend. No fancy and clouded charts. It is a simple but powerful BUY and SELL signals indicator. It is great for Day Traders and Scalpers too. Each currency pair works better with a specific timeframe so use the recommended timeframes with their respective pairs as below:
PAIR || TIMEFRAME =
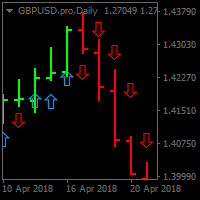
BUY SELL SIG. Utilizing unique price calculations BUY SELL SIG . generates high quality signals Now Features easy to use and Buy and Sell signals for Pro and Novice traders Supports Multi-currency Best results viewed on H1,H4 ,D1 and W1 Timeframes Supports audio alerts and notifications. No complex input parameters just notifications and the indicator style properties

In statistics, Regression Channel is a approach for modelling the relationship between a scalar response (or dependent variable) and one or more explanatory variables (or independent variables).We Applied relative strength index(rsi) values to develop regression models of various degrees in order to understand relationship between Rsi and price movement. Our goal is range prediction and error reduction of Price divergence , thus we use Rsi Regression
Индикатор RSI magic kjuta trial это демонстрационная версия RSI magic kjuta .
Пользовательский Индикатор ( RSI magic kjuta ) на основе стандартного Индикатора Силы ( Relative Strength Index, RSI ) с дополнительными настройками и функциями. К стандартной линии RSI добавлены линии максимального и минимального значения RSI на графике. Теперь можно визуально наблюдать прошедшие максимумы и минимумы RSI , а не только значения по закрытию баров, что позволяет избежать путаницы при анализе торгов
FREE

Pivots Channels Breakouts presents 16 different formulas for Pivots Levels. It draws each one of them and also draws specific channels, trend histograms, and SL/TP levels derived from them . It includes commonly used formulas as Classic, Woodie, ATR, Fibonacci, Camarilla and Demark Pivots, and also presents never seen before formulas based on the Padovan mathematical sequence. Price often reacts at Pivots levels, and at Resistances (R) and Supports (S) of these formulas. That is why a lot of tra
Узнайте, как легко и просто купить торгового робота в MetaTrader AppStore - магазине приложений для платформы MetaTrader.
Платежная система MQL5.community позволяет проводить оплату с помощью PayPal, банковских карт и популярных платежных систем. Кроме того, настоятельно рекомендуем протестировать торгового робота перед покупкой, чтобы получить более полное представление о нем.
Вы упускаете торговые возможности:
- Бесплатные приложения для трейдинга
- 8 000+ сигналов для копирования
- Экономические новости для анализа финансовых рынков
Регистрация
Вход
Если у вас нет учетной записи, зарегистрируйтесь
Для авторизации и пользования сайтом MQL5.com необходимо разрешить использование файлов Сookie.
Пожалуйста, включите в вашем браузере данную настройку, иначе вы не сможете авторизоваться.