Смотри обучающее видео по маркету на YouTube
Как купить торгового робота или индикатор
Запусти робота на
виртуальном хостинге
виртуальном хостинге
Протестируй индикатор/робота перед покупкой
Хочешь зарабатывать в Маркете?
Как подать продукт, чтобы его покупали
Новые технические индикаторы для MetaTrader 4 - 80

Основываясь на сочетании показателей, PS Acid Fulx является отличным индикатором для зная, когда покупать или продавать на любой актив и временность. Индикатор сам я использовал его в качестве инструмента для моего анализа при торговле Forex. Это полезный и простой для понимания индикатор тренда. Если вы объедините его с вашим собственным анализом вы, безусловно, получите хороший результат в вашей операции.
FREE
The principle of this indicator is very simple: detecting the trend with Moving Average, then monitoring the return point of graph by using the crossing of Stochastic Oscillator and finally predicting BUY and SELL signal with arrows, alerts and notifications. The parameters are fixed and automatically calculated on each time frame. Example: If you install indicator on EURUSD, timeframe M5: the indicator will detect the main trend with the Moving Average on this timeframe (for example the Moving

Кластерный индикатор работающий в ценовом канале. Для работы индикатор строит канальную линию - (пунктирная линия).
Внутри канала строятся кластерные участки определяющие направление движения цены - (гистограммы в двух направлениях),
начинаются с крупных стрелок. Над/под каждой гистограммой строятся маленькие стрелки - показатель повышения волатильности.
Индикатор не перерисовывает значений. работает на любых инструментах и таймфреймах.
Входы осуществляются при появлении крупных стрелок, вн

Индикатор Reaction формирует стрелки (по умолчанию красного цвета и синего цвета). Индикатор устанавливается обычным образом на любой торговый символ с любым временным интервалом.
Это индикатор тренда и торговых сигналов, основанный на принципе совмещенного анализа расчетных опорных точек внутри канала а также уровней перекупленности и перепроданности.
Входные параметры Period - период индикатора; LevelUp - уровень перекупленности; LevelMid - уровень баланса; LevelDown - уровень перепроданн

Индикатор предназначен для торговли бинарными опционами на малых таймфреймах до м 30 Сигналы Синяя стрелка вверх это сигнал на покупку Красная стрелка вниз это сигнал на продажу Сигнал появится вместе появлением новой свечи и во время формирования Сигналит на текущую свечу Время экспирации одна свеча от таймфрейма на котором торгуете Для фильтрации ложных сигналов можно использовать moving average Или уровни поддержки сопровождения Надежный и верный помощник в торговле.
Fast trend - профессиональная версия индикатора определения направления тренда и точек входа. Индикатор с высокой вероятностью определяет направление тренда на любых валютных парах, акциях, криптовалюте без перерисовки результата. Для определения тренда использует Price action и авторский уникальный алгоритм фильтрации. Подходит для всех видов торговли, как для скальпинга так и для долгосрочной торговли. Данная версия индикатора это другая ветка эволюции алгоритма индикатора Simple Trend! Ос

Индикатор Fixed Event показывает точки для входа в рынок, точки потенциального разворота рынка.
Индикатор сочетает в себе несколько прогрессивных алгоритмов. Объединенные системы анализа исторических данных проецируются на линии в виде прямых соединяющие экстремумы. То есть точки разворота рынка. Данные экстремумы или точки разворота рынка можно использовать как линии уровней! Что очень удобно для поиска линий поддержки и сопротивления. Готовая торговая система.
Использует один параметр д

Ключевое отличие индикатора Trend Canal от других канальных индикаторов (например, от того же Боллинджера) состоит в том, что Trend Canal берет в расчет не простые скользящие средние, а дважды сглаженные, что с одной стороны позволяет более четко определять движение рынка, а с другой стороны делает индикатор менее чувствительным. Trend Canal – это индикатор канала без перерисовки, строящийся на основании скользящих средних.
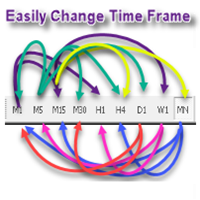
Hello this Indicator can Change TimeFrame easily and faster for current chart only or for all charts in same time (very fast) you can change it by press any number from 1 to 9 please watch our video https://www.youtube.com/watch?v=f6jWz_Y7dMs good luck -------------------------------------------------------------- السلام عليكم هذا مؤشر لتغيير الفريم للشارت الحالي او لجميع الشارتات بشكل اسرع وأسهل يمكنك تغيير الفريم بالضغط على اي رقم من 1 الى 9 بحيث يتمت غيير فريم الشارت الحالي فقط او جميع الشار
Check out other great products from https://www.mql5.com/en/users/augustinekamatu/seller
This indicator is the best so far at estimating reversal points especially on high time frames. It does not repaint and is based on a combination of moving averages computed using custom functions. No inputs required, it is simple plug and play. The principles used ensure that it can be used on CFDs, Commodities and Stock with incredibly great results. With proper money management and portfolio balancin
FREE
Индикатор информирует о том, когда закроется текущий бар и откроется новый бар. ВРЕМЯ является важным элементом торговых стратегий. Индикатор BarTimerPro поможет вам КОНТРОЛИРОВАТЬ ВРЕМЯ . Простой в использовании: поместите на график и если нужно задайте “будильники”. В тестере индикатор не работает
Основные Возможности
4 режима работы: Показывает время прошедшее с момента открытия текущего бара (11) Показывает время оставшееся до закрытия текущего бара (11) Обновление индикатора каждый
FREE

Индикатор информирует о том, когда закроется текущий бар и откроется новый бар. ВРЕМЯ является важным элементом торговых стратегий. Индикатор BarTimerLite поможет вам КОНТРОЛИРОВАТЬ ВРЕМЯ . Простой в использовании: поместите на график и если нужно задайте “будильники”. В тестере индикатор не работает. Основные Возможности
Показывает время прошедшее с момента открытия текущего бара. Обновления индикатора каждую секунду. Настройка внешнего вида (31-36) и расположения (21-24) индикатора, изме
FREE
Machine translation of the following: This indicator is used to close or open the price and time scales.Select true to display scale and false to close scale.After the price scale is closed and then opened, it may show that it is not at all. But it can be solved by switching time cycle.This indicator has two tags, D and P, which can be opened or closed in real time by clicking.The related parameters can be modified by user, such as the name, position and coordinates of the label.
FREE
Fully automated Forex Expert advisor that trades with accuracy. With volatility it executes pending orders and secures the safe entry .
No special indicator is used.
Just catch the market movement with special algorithms Recommended pair is Eur/Usd
Can be started with only $50 1% to 2% Draw Down only 20% to 25% monthly return Tight SL with good TP Developed for Metatrader 4
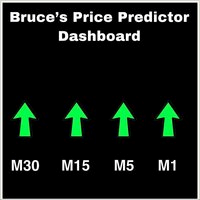
This is a Dashboard Indicator based on Bruce's Price Predictor Indicator . This Dashboard will Give you a visual to see the trend direction without having to flip through timeframes, so you can always be trading in direction of the trend, with little effort. I Recommend www.CoinexxBroker.com as a great broker and the one I personally use
*Non-Repainting Dashboard Arrows *For Desktop MT4 Only *Great For Scalping *Great For Swing Trading *Dashboard Arrow Entry Alerts *Dashboard Arrow Signals

Please check the " What's new " tab regularly for a complete and up-to-date list of all improvements + parameters. FREE indicator for my trading utility Take a Break . This indicator allows you to manage multiple other EAs with just one Take a Break EA instance. Simply specify the corresponding Chart Group in the indicator(s) and Take a Break EA settings and you are good to go.
Setup example (Indicator + EA)
You want Take a Break to manage 3 other EAs: EA1 on EURUSD, EA2 on EURGBP, EA3 on G
FREE

The Currency Strength Breakout indicator monitors eight currencies across M1, M5, M15, M30 & H1 time frames all in the same window.
Trade the strongest currency against the weakest with alerts for pullbacks giving you the opertunity to enter the trend. Please note: I have made the decision to give this Indicator away and many more for free with limited support so that I can concentrate on Custom EA.
View More Products - https://www.mql5.com/en/users/robots4forex/seller#!category=1
Monitoring
FREE
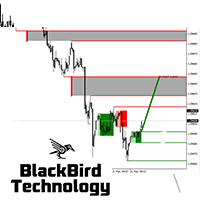
Multi Signal Indicator contains a whole series of intersting buy,sell and exit signals that can be separately turned on/off. Signals : Liquidity Pools Liquidity Pools Forecast Projection Reversal Blocks Pinbar groups Overbought/Oversold with Moving Average Band (5 MA bands) Moving Average Difference Liquidity is an important aspect in the market, especially for institutional investors, as they need lots of liquidity to enter or exit the market. Therefore, institutional traders focus more on dema
指标功能:完成十字光标跟随,多个窗口鼠标位置的同步显示。 功能 开启 :点击"H"标签,标签变成"S",开启十字光标,通过鼠标点击,完成第二个以上窗口的位置同步。 可以大周期同步小周期 (注意:在大周期同步小周期时,要注意小周期中的数据是否足够多) , 也可以小周期同步大周期。 功能关闭:点击 "S"标签,会变成"H"。或者通过键盘的"ESC"键,关闭。
指标可以多个窗口加载,也可以单窗口加载。
参数设置: LabWindow:标签显示的窗口 LabConer :标签显示的角落位置 LabX :标签位置横坐标 LabY :标签位置竖坐标 LabShowBackup :标签背景显示于背景 LabFontName :标签的字体名称 LabFontSize :标签的字体大小
FREE

Este indicador Tick Bid Transaction identifica las ventas que ofrece tu Broker. Relaciona el volumen “no real” y los Ticks de la demanda de un cierto modo, luego el algoritmo marca con un punto donde se realiza una transacción, según el tamaño del punto significa que la venta es mayor o menor o, hubo muchas ventas al mismo tiempo lo que nos dice que si el punto es muy grande es muy probable que el Activo baje como así también si hay una cierta acumulación de puntos de diferentes tamaños. Este in

Este indicador Tick Ask Transaction es representado en una ventana separada tick a tick del Ask e identifica las compras que ofrece tu Broker. Relaciona el volumen “no real” y los Ticks de la oferta de un cierto modo, luego el algoritmo marca con un punto donde se realiza una transacción, según el tamaño del punto significa que la compra es mayor o menor o, hubo muchas compras al mismo tiempo lo que nos dice que si el punto es muy grande es muy probable que el Activo suba como así también si hay
DPPD (динамическое отклонение цены в процентах) - это простой, но эффективный индикатор, который следует правилу «покупай дешево, продавай дорого». Индикатор может отправлять электронную почту, оповещения и push-уведомления MQL ID. Также есть возможность установить индивидуальное персональное уведомление на любом уровне отклонения. Индивидуальное уведомление может иметь и добавить индивидуальный комментарий. Почему DPPD динамический? Потому что отклонение не измеряется от статической точки. Откл

The principle of this indicator is very simple: detecting the trend with Moving Average, then monitoring the return point of graph by using the crossing of Stochastic Oscillator and finally predicting BUY and SELL signal with arrows, alerts and notifications. The parameters are fixed and automatically calculated on each time frame. Example: If you install indicator on EURUSD, timeframe M5: the indicator will detect the main trend with the Moving Average on this timeframe (for example the Moving
The principle of this indicator is very simple: detecting the trend with Moving Average, then monitoring the return point of graph by using the crossing of Stochastic Oscillator and finally predicting BUY and SELL signal with arrows, alerts and notifications. The parameters are fixed and automatically calculated on each time frame. Example: If you install indicator on EURUSD, timeframe M5: the indicator will detect the main trend with the Moving Average on this timeframe (for example the Moving

TRADE EXTRACTOR is the fastest self-learning AI Algorithm, which will learn any market situation with ease.As a Manual trader, I came across the difficulty of finding the right parameter and the right condition to trade. There are infinite combinations of indicators and objects(trendlines, gann grid, fibo levels etc) which as an human, I can’t decide their winning rate or performance. Many claim to have a winning strategy but won’t have enough statistical support to prove their claims. Due to

The indicator plots the trend from an EMA of "n" periods and the cycle from another EMA of "k" periods from the previous EMA. This allows the crosses to be much more effective and the amplitude of the cycle allows to verify the strength of the trend. This indicator should be used as a complementary tool to confirm market entry signals. It is possible to add three times the indicator applied to maximum price, minimum price and median price in TimeFrame of one hour for example, in order to identif
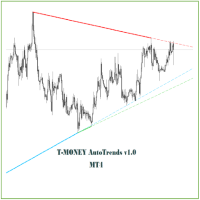
The indicator identifies and graphs the relevant trends (UpTrend and DownTrend) taking the relevant minimum and / or maximum in the market. Likewise, it projects the corresponding direction of the trend that constitutes levels of support for operational decision-making.
A good practice using these trends is to trade on breaks, whether they are confirmed and a counter trend is generated or if the price rejoins the original trend after a false break. You can add more than one trend by modifying
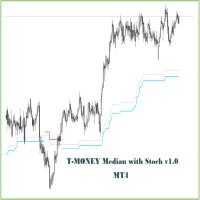
This indicator plots the Median of "n" periods and confirms the crossings with the Stochastic Oscillator. It is an indicator that combines the Median as a determining level of the price cycle and the Stochastic Oscillator for the confirmation of crosses.
It should be used as a complementary or supporting indicator with Price Action or other strategies to validate market entries.
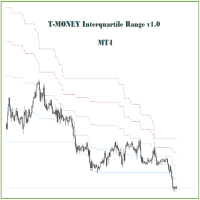
This indicator graphs channels formed by the Local Maximum and Local Minimum of "n" periods and from this channel adds the Median and Interquartile Range. It is important to note that when the price enters the range, the interquartile range is reduced considerably with respect to its historical level, which can be visually warned with this indicator and the operator will have the possibility of deciding to stay out of operations in these conditions of market.
The Q Factor (by default at 0.25
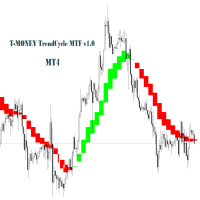
The present indicator is similar to TrendCycle but it allows to graph in any TimeFrame the cycle-trend of a Superior TimeFrame. For example, you can include in the TimeFrame H1, the cycle-trend corresponding to H4 or D1. This is of particular importance for Swing traders or looking for medium-term trends.
It can be used as a support indicator to confirm trends or medium-term trend changes and avoid false breaks.
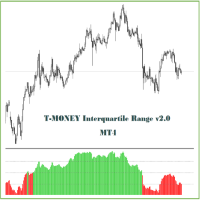
This indicator is similar to "T-MONEY Interquartile I" but it is normalized (on a scale of 0 to 100) and is plotted in a separate window. The normalized interquartile range, the median, and the maximum and minimum zones can be observed. As a visual aid, the green color has been considered in the histogram when the asset is trading above the configured median of "n" periods, and red when the asset is trading below it.
Like its similar, this indicator should be used as a support tool for making

It's a simple but useful tool for creating a grid based on Envelopes.
Only 2 parameters can be set: 1) "Period" - the period of all visible Envelopes (i.e. 4) and 1 Moving Average (Envelopes axis), 2) "Deviations Distance" - the distance between Envelopes.
Naturally, the colors of all 9 lines can be changed as desired. It works with everything that is available in your Market Watch.
Good luck!
FREE

Индикатор Price Action Finder это индикатор точек входа, который предназначен для поиска и отображения паттернов системы Price Action на графике цены. Индикатор оснащён системой трендовых фильтров, а также системой алертов и пуш уведомлений. Инструкция/Мануал ( Обязательно читайте перед приобретением ) | Версия для МТ5 Преимущества
1. Паттерны: Пин бар, Внешний бар, Внутренний бар, PPR, Бар силы, Повешенный, Перевёрнутый молот
2. Система фильтрации паттернов. Убирает с графика контртрендовые п

It's a simple but useful tool for creating a grid based on Bollinger Bands .
Only 2 parameters can be set: 1) "Period" - the period of all visible Bollinger Bands (i.e. 4) and 1 Moving Average (axis of all Bollinger Bands), 2) "Deviations Distance" - the distance between Bollinger Bands.
Naturally, the colors of all 9 lines can be changed as desired. It works with everything that is available in your Market Watch.
Good luck!
FREE

This indicator uses binary codes to predict price movement within the "multiverse and mini-verse" of price. (Due to the coding instruction to capture every momentum, it leaves static lines in DEMO TESTING mode. At the end of testing click on the indicator to open and click OK. It will adjust and remove broken and static lines) It also draws lines at entry price levels on the chart. Just open your positions accordingly at these price levels. You will get many trading opportunities each day with
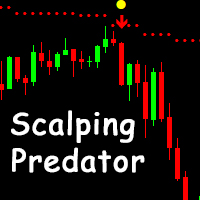
Plug and play Scalpers, medium term and binary traders this one is perfect for you. This is great tool to integrate into your system. Your Pc must be very fast and contain good specs to handle these arrows. It does not repaint and paints on closed bars. It contains alerts which will post all alerts found on the chart from left to right. Can be great for binary traders and Forex scalpers. Send me a message when you purchase, will send you additional filters if needed. Timeframe Best time frame t
ZO SIGNAL analysis on multiple time frames with ZO check setup.
Combining other products of ZO SYSTEM : https://www.mql5.com/en/users/lht2341990/seller These are indicators of thinking and require you to understand ZO System. For more details please see the wiki or contact the Zo Trader team. Wiki : http://zoindicator.com/ /*-------------------------------------------------------------------------------------------------------------------------------------------------------------------------

MA Multi-Currencies Multi-Timeframes Histogram BUY/SELL Indicator up to 6 currencies on time calculations based on 6 time frames : M5, M15, M30, H1, H4, D1 Trading Strategies: **TREND shifts to UP trend when Green point appears after Red and Gray points -> Close SELL positions then add new BUY positions on new Green points **TREND shifts to DOWN trend when Red point appears after Green and Gray points -> Close BUY positions then add new SELL positions on new Red points ** Close BUY position

Индикатор. "Индикаторные Волны ".
Используя 23-и стандартных индикатора и авторский алгоритм, рассчитываются уровни покупок (от 0 до +100) и продаж (от 0 до -100).
Далее используя рассчитанные уровни, "Индикатор Волны" рисует волну с 21 средними скользящими.
Номер волны равен периоду усреднения, рассчитанных уровней.
Волны 1 - 7 быстрые скользящие средние
Волны с 8 -14 средние скользящие средние
Волны с 15-21 медленные скользящие средние
Глядя на фигуры, которые

Метр точности Введение:
Accuracy Meter - это мощный инструмент для определения% выигрышных стратегий, чтобы показать вам все точки входа и выхода из сделок, такие как этот мета-тестер стратегий, вы можете иметь простой тестер стратегий в качестве индикатора на графике, прикрепить его к разным парам и таймфреймам и выяснить процент точности вашей стратегии, измените стоп-лосс и риск на коэффициент вознаграждения и посмотрите, как он может повлиять на вашу идею торговли Accuracy Meter - это ваш
FREE

Индикатор работает на обсчитывание ценовой дельты. Максимально вероятно определяет направление рынка. Работает в двух режимах, расчёт по каждой свече и суммарный расчёт группы свечей. Применяется для МТ4 , работает на всех инструментах. Не требует ни каких настроек. Прост в использовании для всех даже новичков. Оценку рынка можно производить на всех таймфреймах от 1 минуты и выше. Инструкция по использованию в видео. Текущие вопросы можно обсудить в телеграмм чате, ссылка под видео. Всем удачи и
Описание
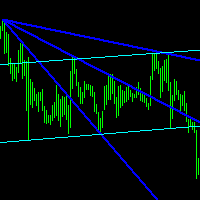
Reverse Rayer - индикатор, который рисует лучи по наклонным трендовым уровням
Рекомендации
Вы можете использовать данный индикатор для определения тренда и соответственно для определения направления открытия позиции или закрытия противоположной позиции.
Параметры
===== _INDICATOR_SETTINGS_ ===== - настройки расчета индикатора Maximum History Bars - максимальное количество баров истории для расчета индикатора. Average True Range Period - период индикатора ATR (используется
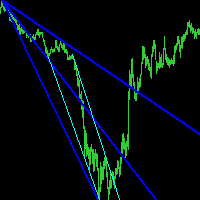
Описание
Reverse Rayer Pro - индикатор, который рисует лучи по наклонным трендовым уровням
Рекомендации
Вы можете использовать данный индикатор для определения тренда и соответственно для определения направления открытия позиции или закрытия противоположной позиции.
Параметры
===== _INDICATOR_SETTINGS_ ===== - настройки расчета индикатора Maximum History Bars - максимальное количество баров истории для расчета индикатора. Average True Range Period - период индикатора ATR (используе

The principle of this indicator is very simple: detecting the trend with Moving Average, then monitoring the return point of graph by using the crossing of Stochastic Oscillator and finally predicting BUY and SELL signal with arrows, alerts and notifications. The parameters are fixed and automatically calculated on each time frame. Example: If you install indicator on EURUSD, timeframe M5: the indicator will detect the main trend with the Moving Average on this timeframe (for example the Moving

EnkiSoft TrendWatch Indicator with Pips counter New version 1.62 (2020.10.16)
Product blog page With TrendWatch Indicator you will be able to identify trends on any symbol and any timeframe. Choose the easy way, use TrendWatch indicator, and find your settings on your favourite chart. The embedded pips counter helps you to find the best settings, that differ almost on every pair and timeframe. I will provide you some settings, so you can begin profitable trading. With many setting, you can

BeST_ Elliot Wave Oscillator Strategies is an MT4 indicator which by default is the difference of two SMAs displayed as a histogram fluctuating around zero while a Signal Line generates Entry Signals either in a Reverse or in a Normal Mode and it is a very powerful tool that very often exploits huge market movements. Signal Line comes in 2 types: Advanced Get Type – like the corresponding one used in the homonym analysis package Mov. Average Type – as a Moving Average of the Elliot Oscillator I

Most accurate Pattern indicator on this market. It search triangles, wedges, channels (next patterns and autoscanner in plan) Works on Forex, Commodities, Indicies, Stocks, Crypto, ... on all timeframes and on every brooker.
If you want this and all my other products for FREE , create account here and then write me and I will send you all my actual and future product for FREE + VIP on my http://discord.io/reitakfx
For more info join to http://discord.io/reitakfx where you can get

Profit Percent Series 2 The scanner dashboard available here (for Free) : https://abiroid.com/product/profitpercent-arrows-ma-confluence
Read detailed information about MA Confluence here: https://www.mql5.com/en/blogs/post/747474
Here's a post about Common Settings for all Profit Percent Series Indicators: https://www.mql5.com/en/blogs/post/747456
Strategy: Main Signal Indicators (Any One): MA Cross (In-built) or Hull, OBV Cross, Heiken Ashi Cross Validation Indicators (Preferably l

Индикатор Blue Eagle подает сигналы о смене тренда, показывая сигналы. Высокая вероятность успешного тренда, его можно использовать с оптимальным коэффициентом риска к прибыли. Индикатор не перерисовывается и не запаздывает, можно использовать как для пипсовки на мелких периодах, так и для долгосрочной торговли.
Индикатор Blue Eagle предназначен для анализа движений цен с заданной амплитудой, отображая только самые важные развороты, что значительно облегчает оценку графиков. Стрелки показыва

Стрелочный индикатор Alive Trend показывает потенциальные точки входа в рынок в виде стрелок соответствующего цвета: стрелки вверх (синие) предлагают открыть покупку, стрелки вниз (красные) – продажу. Alive Trend визуально «разгружает» ценовой график и экономит время анализа: нет сигнала – нет сделки, если появился обратный сигнал, то текущую сделку стоит закрыть. Предполагается вход на следующем баре после указателя, но могут быть и нестандартные рекомендации для каждой стратегии свои.
Именн

Принцип построения линий индикатора и их смысл . Индикатор Signal Channel использует робастный метод фильтрации основанный на двух скользящих медианах применимых к ценам High и Low, т.е. линиях и , где <..> - знак линейного усреднения, которые сдвигаются на определенные величины при восходящем тренде и на противоположны величины при нисходящем тренде, что позволяет получить узкий канал, приблизительно очерчивающий каждый бар. Острые изломы линий такого канала по

Kumo Breakout Indicator is a trading system based on Ichimoku Kumo levels.
Parameters
Trader can set Ichimoku parameters like: Tenkan-Sen (tk) Kijun-Sen (kj) Sekou-Span-A (ku) that are the classic parameters allowed on Ichimoku indicator on Metatrader.
Other interesting parameters: "Configure Alerts" PopUpAlert= true or false PushAlert=true or false Mail= true or false and personalized texts for eMails: TextMailUp1="WP Buy "; TextMailUp2="WP Buy write here your text"; TextMailUp3=""; Te

Индикатор ищет уровни поддержки и сопротивления, определяя важные ценовые уровни. Параметры индикатора: Mode - метод определения уровней: 1) High_Low - по теням, 2) Open_Close - по цене открытия и закрытия;
Period_ - период индикатора, внутри которого ищется важный ценовой уровень (например, если стоит 12 - ищет уровень внутри 12 баров, сдвигаясь каждый раз на бар вперёд); Touches - количество касаний цены; BreakAlert - выдавать алерт при обнаружении уровня;
NewLevelAlert - выдавать алерт при

The principle of this indicator is very simple: detecting the trend with Moving Average, then monitoring the return point of graph by using the crossing of Stochastic Oscillator and finally predicting BUY and SELL signal with arrows, alerts and notifications. The parameters are fixed and automatically calculated on each time frame. Example: If you install indicator on EURUSD, timeframe M5: the indicator will detect the main trend with the Moving Average on this timeframe (for example the Moving

This indicator includes: Currency Strength Meter My currency strength meter gives you a quick visual guide to which currencies are currently strong, and which ones are weak. The meter measures the strength of all forex cross pairs and applies calculations on them to determine the overall strength for each individual currency. Live Heat Map — Multiple time frame Heat Map makes it easy to spot strong and weak currencies in real-time. Get an overview of how world currencies are traded against each
Hi Friends, This free indicator displays Tick chart on MetaTrader4 platform. Feel free to use it for Day trading or Scalping. Please give generous reviews and feedbacks for the product. All The Best!
Note: When this indicator is initially applied to a chart, it will not show any output. Once price starts moving then Ticks will start getting displayed. Thus when markets are closed, it won't have fresh ticks to display.
About us We are a small team of professional traders with experience in fo
FREE

Heikin-Ashi charts , developed by Munehisa Homma in the 1700s. Munehisa Honma was a rice merchant from Sakata, Japan who traded in the Dojima Rice market in Osaka during the Tokugawa Shogunate. He is considered to be the father of the candlestick chart. Th e man who invented the use of candlestick charts for finding and profiting from chart patterns.He was a billionaire trader on those days if we compared his net-worth with todays dollar . Heikin Ashi Scanner is an Multi-Currency and Multi
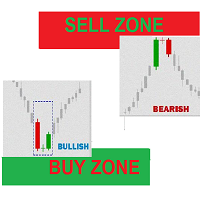
Buy Sell Zones Simple indicator for moving BUY / Sell Zones and Buy / Sell Signals generated with indicator moving Buy and Sell zones : Closest zone is wide and clear : Red for Sell zone , Green for Buy zone >>> old far zones are in bold lines :::BUY Zones (GREEN) appear only in UP Trend and disappear in DOWN Trend :::SELL Zones (RED) appear only in DOWN Trend and disappear in UP Trend input parameters ::: index bars : bars range for zone calculation levels : number of zones Up move/Down mov
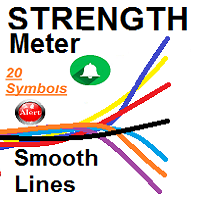
Currencies Strongest Weakest SMOOTH STRENGTH METER INDICATOR (SMOOTH LINE) it draws Currencies TREND Volatility Power / Strength lines : - Detects the 2 highly TRENDED Volatile pairs ( will be the Bold Lines ) - A very Helpful Indicator - It draws smooth lines for up to 20 currencies pairs representing Volatility strength and power - First it indicates the most powerful trended direction pairs : Strongest / Weaker - MAIN FUNCTION :it gives indication of the UP trend mos

Moving Averages Of Rsi This indicator shows you Average of Relative Strenght Index. You can use this indicator for your own experts with iCustom() RSI is in the buffer ( 0 ) and moving average is in the buffer ( 1 ) there are afew parameters for using this indicator on different currencies and different time frames. you can test it and optimize it . Input Parameters: RsiPeriod: default is 14 SignalMaPeriod : default is 28 SignalMAMode : default is SSMA

Moving Averages Of Cci This indicator shows you Average of Commodity Channel Index. You can use this indicator for your own experts with iCustom() CCI is in the buffer ( 0 ) and moving average is in the buffer ( 1 ) there are afew parameters for using this indicator on different currencies and different time frames. you can test it and optimize it . Input Parameters: CciPeriod: default is 14 SignalMaPeriod : default is 28 SignalMAMode : default is SSMA
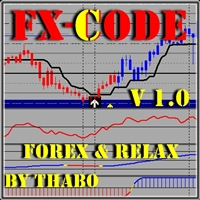
Please contact me or send me a message after you have purchased the FX-CODE This systems supports technical traders fundamental traders sentimental traders NON repaint entry with trend entry confirmations. this is a build up system so please contact me for more indicators to add THE FX-CODE V1.0 is one of the Forex & Relax Strategy systems, and it’s made to fit any kind of trader from newbie to professional. This system can suet any style of trading fundamental or technical all you have t

Permite ver el horario comprendido entre la hora inicial que indique el usuario y la hora final, de esa manera, si el usuario desea ver sobre el grafico una sesion de trabajo, solo tiene que indicar la hora incial y la hora final de la sesion que desee.
Esto permite que el usuario identifique con mayor facilidad el horario que comprenda la sesion de trabajo que el usuario desee vigilar, o trabajar, o simplemente tener como referencia.

El Fibonacci automatico de Grupo Bazan Inversores, permite al usuario que lo utiliza, ver desplegado de manera automatica los niveles Fibonacci de los periodos que el mismo usuario haya seleccionado.
Esto permimte que el usuario no tenga que seleccionar el Fibonacci de la plataforma de metatrader 4 para colocar manualmente la figura, pudiendose concentrar exclusivamente en su analisis u operativa.

Trend Flasher
Trend is your friend is the age old saying quote in trading arena, there are though many ways to gauge the trend and its direction, more scientific measure and logically meaningful will be an ATR break outs to identify and spot the trend and its acceleration, so we created this easy to use trend identification panel and optimized super trend based multi time frame panel entry system to aid and help the traders to make their trading decision.
Unique Features of Trend Flasher
1
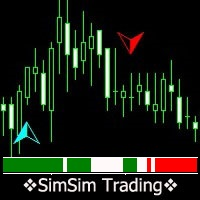
Индикатор просчитывает и суммирует данные от 25-и стандартных индикаторов. В результате расчета получаем текущий уровень сигнала. Во входных параметрах указываем минимальный уровень сигнала. Этот уровень отображается в виде гистограммы (основной индикатор ) и стрелки индикатора (второй индикатор). Положительные значения сигнала говорят о возможной покупке, отрицательные о продаже. В индикаторе реализована система тестирования, которую можно опробовать, скачав демонстрационную версию. И основно

This indicators automatically draws the Trend Channels for you once you've dropped it on a chart. It reduces the hustle of drawing and redrawing these levels every time you analysis prices on a chart. With it, all you have to do is dropped it on a chart, adjust the settings to your liking and let the indicator do the rest. Get an alternative version of this indicator here: https://youtu.be/lt7Wn_bfjPE For more free stuff visit: https://abctrading.xyz
Parameters 1) Which trend do you want
FREE
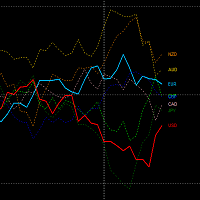
Этот индикатор позволит вам отслеживать относительную силу отдельных валют во всей денежной корзине.
Получение информации о силе валют будет простым и немедленным, равно как и выявление любых различий.
Можно иметь три разных режима отображения. Фактически, можно выбрать отображение всех валют, валют текущего символа в качестве доказательства по сравнению с остальной частью корзины, или выделить и отобразить только валюты символа, на котором мы находимся.
Он работает на всех таймфреймах, н

Мультивалютный и мультитаймфреймовый индикатор Bollinger Bands. На панели вы можете видеть прорывы и касания (ценой) линий Боллинджера. В параметрах можете указать любые желаемые валюты и таймфреймы. Также индикатор может отправлять уведомления при касании Полос Боллинджера. По клику на ячейке будет открыт данный символ и период.
Параметры Настройки Bollinger Bands Averaging period — период усреднения для вычисления индикатора. Standard deviations — количество стандартных отклонений от основ
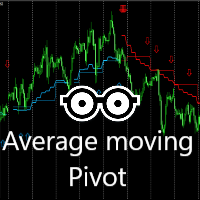
Этот индикатор очень эффективен для повседневной торговли.
Комбинация скользящих средних и расчета 2X Pivots для получения очень убедительного сигнала каждый день.
Синий цвет сигнализирует о возможности покупки. Следуйте стрелкам для возможных точек покупки. Синие опорные точки и средняя линия, служит возможной поддержкой. Красный цвет сигнализирует о возможности продажи. Следуйте стрелкам для возможных точек продажи. Красные точки разворота и средняя линия, служит возможным сопротивлением.
FREE
MetaTrader Маркет - единственный магазин, где можно скачать демоверсию торгового робота и подвергнуть его проверке и даже оптимизации на исторических данных.
Прочитайте описание и отзывы других покупателей на заинтересовавший вас продукт, скачайте его прямо в терминал и узнайте, как протестировать торгового робота перед покупкой. Только у нас вы можете получить представление о программе, не заплатив за неё.
Вы упускаете торговые возможности:
- Бесплатные приложения для трейдинга
- 8 000+ сигналов для копирования
- Экономические новости для анализа финансовых рынков
Регистрация
Вход
Если у вас нет учетной записи, зарегистрируйтесь
Для авторизации и пользования сайтом MQL5.com необходимо разрешить использование файлов Сookie.
Пожалуйста, включите в вашем браузере данную настройку, иначе вы не сможете авторизоваться.