Смотри обучающее видео по маркету на YouTube
Как купить торгового робота или индикатор
Запусти робота на
виртуальном хостинге
виртуальном хостинге
Протестируй индикатор/робота перед покупкой
Хочешь зарабатывать в Маркете?
Как подать продукт, чтобы его покупали
Новые технические индикаторы для MetaTrader 4 - 43
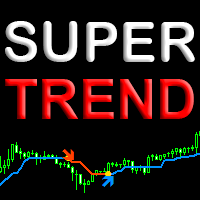
В Super Trend Line реализован один из лучших "price action" алгоритмов трендового индикатора. В связке с авторской фильтрацией это дает максимально точное определения тренда на любых трендовых валютных парах, акциях, криптовалюте без перерисовки результата. Индикатор легко настраивается и станет дополнительным помошником в вашей торговой системе. Подходит как новичкам так и профессионалам для всех видов трендовой торговли.
Как выбрать прибыльный таймфрейм и оптимизировать индикатор под валютну
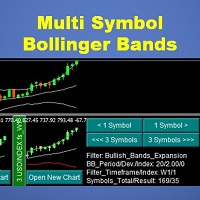
This indicator will display mini candlestick chart with Bollinger Bands indicator of the symbols that pass a filter criteria in the indicator subwindow from 1 to 10 symbols per subwindow. Feature:
Button to scroll 1 symbol, click to scroll the displaying symbols back and forth 1 symbol per click Button to scroll 1 page , click to scroll the displaying symbols back and forth 1 page(number of symbols per subwindow) per click Button to open new chart, click to force mt4 terminal to open a new cha
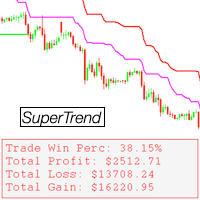
Super Trend Double Pro
- Includes the classic SuperTrend indicator x2 - Includes two indicators for much better market analysis - Comes with various settings - Comes with a display - Displays statistical win/loss information
The "Super Trend Double Pro" indicator provides the ability to combine two of the classic SuperTrend indicators into one, displaying two indicators with different settings on the same chart. The indicator comes with many customizable settings as well as a display which

This is a Manual Indicator to help Manual traders see the Trend Visually it allows you to fully control how the candle closes with many different options, and you can plot the path with many different options. This Indicator is best used in Timeframe: H1 or higher
Close Candle Methods
Close Open High Low Median Typical Weighted Close Median Body (Open+Close)/2 Average (High+Low+Open+Close)/4 Trend Biased Heiken Ashi Close Heiken Ashi Open Heiken Ashi High Heiken Ashi Low Heiken Ashi Media
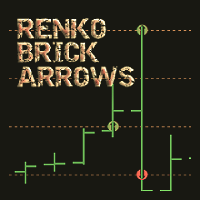
The ' Renko Brick Arrows ' indicator was developed to showcase the traditional renko brick grid pricing on chart. An alternative to using an offline chart generator for renko grid prices, and a unique charting style to strategize.
Key Features Renko bricks are drawn over the chart without having to generate a new chart. Optional horizontal lines shows where the next arrows are supposed to appear. Both one and two step reversals are available to draw arrows for buy and sell.
Input Parameters

IMPORTANT; Price is subject to rise at any time from now! Do not miss this offer! Dear trader I am glad to introduce my new tool called Trend Analyser Dashboard to you. The design, style, and settings of this indicator have been made simple to make its users not take too much time in understanding the indicator itself. The purpose is to help traders in analysing the direction of the major trend and the status of the trend whether in weak trend or its strong trend. The indicator will also prov

Этот индикатор сделан на основе дискретного преобразования Хартли. Использование этого преобразования позволяет применять разные подходы при обработке финансовых временных рядов. Отличительная особенность этого индикатора - его показания относятся не к одной точке на графике, а ко всем точкам периода индикатора. При обработке временного ряда индикатор позволяет выделять различные элементы временного ряда. На этом подходе построен первая возможность фильтрации - просто отбрасываются все ненужные
Этот фильтр построен на основе полиномов Бесселя. Его основное достоинство – маленькая временная задержка. Другая особенность этого фильтра - высокая чувствительность к последним значениям финансового временного ряда. Из-за чего индикатор выделяет активные движения цены, сглаживая при этом шумовые отклонения. Кроме классического варианта в индикатор, в качестве весовой функции, добавлены логарифмы коэффициентов Бесселя. В этом случае индикатор получается более сглаженным, но при этом он может

Осциллятор MACD с расширенной фильтрацией тренда и индикацией предупреждений. Он определяет тренд, отфильтровываются слабые тренды и указывается новая сила тренда. Осциллятор MACD работает на любых таймфреймах и на всех инструментах (валюты, индексы, нефть, металлы, акции, опционы, офлайн-графики ренко) 1. Пользователь может изменить значение MACD, 2. Фильтр минимального уровня MACD, 3. Значение деления отфильтрует соотношение мощностей, при котором требуется индикация изменения тренда на любом

Индикатор помогает определить потенциал движения цены внутри дня и на тренде. Для расчётов используется среднее ценовое движение на инструменте. Если у вас проблема выставления TP, индикатор позволяет не завышать ожидания. Для волатильных инструментов также можно учитывать и положение SL. Если вход был в правильном месте соотношения риск/прибыль подскажут выгодный уровень для фиксирования прибыли.
В нижней части экрана присутствует кнопка сброса. Если индикатор потерялся на графике при смене и
FREE
!! FLASH SALE !! Over 80% off !! For ONE week only. Now only $47 - normally $297!
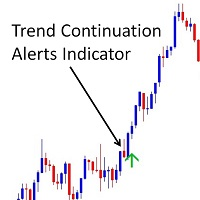
Buy and sell arrows on the chart when the trend is about to continue. Aslo Sends Alerts – On MT4 To Your Phone To Your Email.
Does not repaint.
Works on any pair, any timeframe. (Just ajust the settings for your pair and timeframe.)
10 Activations allowed so you are free from limitations
See an example of alerts from today (23 May 2020) using this and 2 other indicators here . MT5 version h
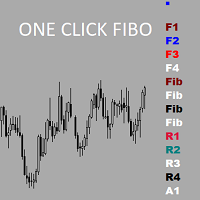
Утилита предназначена для упрощения графического анализа.Настроив один раз , можно сохранить в шаблон,все настройки сохранятся.В настройках меняются уровни фибоначчи , цвета,стили и толщина линий также текстовые метки на кнопках.Есть возможность расширить функционал , добавить временные зоны Фибоначчи ,Фибо арки ,линии по углу ,продление прямоугольных зон до текущей цены.Присылайте рекомендации,все можно осуществить в рамках бесплатной утилиты.
FREE

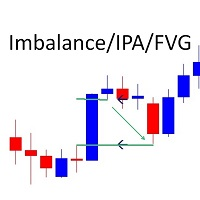
Imbalance / Fair Value Gap (FVG), this is a zone / gap created when the price move with force in a given direction. It identify a zone where the price could potentially go back. This gives perfect targets for your trades.
Imbalance is created from the high and low of 3 candles. When the wicks the of 1st and 3rd candle does not fully overlap the middle one.
This indicator will help you to easily spot mitigated/unmitigated imbalances in your chart.
NEW FEATURE Update: Multi-TimeFrame Feat
!! FLASH SALE !! Over 80% off !! For ONE week only. Now only $47 - normally $297! >>> Ends on 30 June 2023 - Don't miss it!
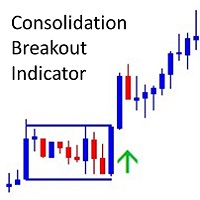
The Consolidation Breakout Alerts Indicator will revolutionize your trading strategy. Our innovative indicator offers unique buy and sell arrows when price breaks out from consolidation, allowing you to get in at the most optimal entry with minimal risk and maximum reward potential. Never again will you miss out on the lucrative trading opportunities available
MT4に表示している同一通貨ペアのチャート上で、水平線や垂直線、トレンドラインなどのオブジェクトを同期します。 このインジケーターを使うと、1つの時間足で作成した水平線などのオブジェクトが、同一通貨ペアの他のチャートにも同じオブジェクトが作成されるようになります。また、作成後の移動、プロパティ変更、削除なども同期することができます。
チャートオブジェクトが同期されるケース
・チャートオブジェクトの作成 ・チャートオブジェクトのスタイル変更(色、太さなど) ・チャートオブジェクトの移動 ・チャートオブジェクトの削除
対応しているチャートオブジェクト
以下24のオブジェクトに対応しています。 ・水平線
・垂直線
・トレンドライン
・平行チャネル
・フィボナッチリトレースメント
・フィボナッチ・エクスパンション
・フィボナッチ・チャネル
・フィボナッチ・タイムゾーン
・フィボナッチ・ファン
・フィボナッチ・アーク
・角度によるトレンドライン
・アンドリューズ・ピットフォーク
・標準偏差チャネル
・線形回帰チャネル
・サイクルライン
・三角
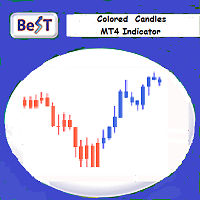
BeST_Colored Candles is an MT4 FREE indicator that can change the color of the Candlesticks based on the MACD, SAR or RSI values and levels. It is a Composite indicator that by selection uses the values each one of these 3 indicators and their critical levels in order to create numerical relationships that when satisfied cause their corresponding candlesticks coloration.
Input parameters
== Basic Settings
-- Please Select Indicator - for selecting which one of the above 3 indicator
FREE
[ MT5 Version ] Ultimate Alpha Trend MT4
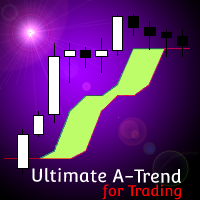
Ultimate Alpha Trend is the first trend indicator, which combines volatility, volume, average price and momentum. The results is a highly versatile representation of trendy and sideways market conditions, highlighting, at the same time, significant supply and demand levels. The Ultimate Alpha Trend indicator can be used to find entry oportunities and to set SLs taking into consideration current market volatility, volume and momentum. Besides that, the in
!! FLASH SALE !! Over 80% off !! For ONE week only. Now only $47 - normally $297! >>> Ends on 30 June 2023 - Don't miss it!
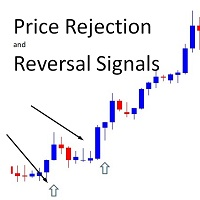
Buy And Sell Signal Arrows On The Chart When The Price Is About To Reverse. Also Sends Alerts – On MT4 To Your Phone To Your Email.
Does not repaint.
Works on any pair, any timeframe. (Just ajust the settings for your pair and timeframe.)
10 Activations allowed so you are free from limitations
MT5 version here . Spreads from 0.1pip RAW/ECN Acco

This indicator is excellent for scalping on the M1 or M5 chart. Uses a special algorithm for the lines. No need to set up the indicator. Does not feature any alerts and is best used manually after visually confirming the line displays. NB: Make sure to download M1 history before testing and use.
How to use: Simply attach to M1 or M5 chart. Zoom chart out completely. Sell when all lines above the white line (PriceLine). Sniper line crosses above white line. Buy when all lines below the white li
According to the law of nature which states that everything is a vibration, I have built this measurement model and which detects the best frequencies in the movement of the price, so just adjust the frequency in the input parameter of the candlestick watcher how are they arranged on the level lines (support/resistance). Lists of good frequencies : 236, 369,417,528, 618,741,963,1236,1484.
You can also search for the frequency that suits your asset! just use the parameter: frequency
Данный помощник в торговле основан на индикаторе Force Index, хороший осцилятор для скальпинга в периоде H1, входы в сделки указаны стрелками, выходы соответственно можете определять самостоятельно, к примеру можете воспользоваться стандартным индикатором Stochastic. Данный индикатор работает только в периоде H1! В настройках при желании можете изменить цвета и период. На основе этого индикатора пишется робот, желающему пишите в лс.

Highly accurate supply and Demand indicator that gives you the exact value of where the Demand or supply ends or starts. Has built-in Alerts Has ability to change colors to whatever you want. Has special feature to automatically change when the chart crosses into a new zone or breaks free from a weak zone. Great for any Manual Trader Set your own custom alerts you can have it check the history of the chart to see how other setups of supply and demand where made in the past.

Trade any Forex combine out there. Many prop firms offer challenge or instant funding combines. The biggest problem is controlling the loss. With this indicator you can get a visual system that can limit loss and teach discipline. This uses the MACD and the strategy is scalping. You can determine the risk and reward. Visually follow small trends for scalps. Trade during active sessions. It's just a simple system to instill discipline while limiting loss and scalping pips with the paramet

Holy Grail arrow is for scalping. The period you use will determine the trend. You can try different time frames and periods to see what works best for your strategy. Filters can be applied like a moving average or trendlines. The 1 minute works good for scalps and always trade during active periods and avoid consolidation times. Using other indicators to determine trends is recommended but this can also be a free flowing scalping system alone with tp and sl.
Inputs: Period = trend period
!! FLASH SALE !! Over 80% off !! For ONE week only. Now only $47 - normally $297! >>> Ends on 30 June 2023 - Don't miss it!
Marks Market Imbalance / Fair Value Gaps / Improper Price Action On The Chart. As traders continue to search for the best trading indicators to guide their investments, the I mbalance / I mproper P rice A ction / F air V alue G ap I ndicator has become increasingly popular. This indicator helps to identify opportunities for taking profit . Th

The Colored Volume is a simple, yet useful indicator that paints the color of the volume based on the price direction. If the price has increased, the volume will be shown in green. If the price has decreased, the volume will be shown in red. This indicator will make it super easy for traders to track volume bars based on price movements. (The settings of the volume bars including line width and color can be manually changed by the trader.)

The Forex Master Pattern is an alternative form of technical analysis that provides a framework which will help you to find and follow the hidden price pattern that reveals the true intentions of financial markets. This algorithm here does a good job detecting the Phase 1 of the Forex Master Pattern cycle, which is the contraction point (or Value).
On Phase 2 we get higher timeframe activation (also called Expansion), which is where price oscillates above and below the average price defined
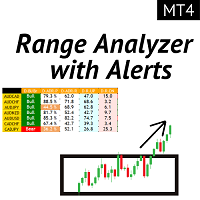
Индикатор Range Analyzer показывает средний диапазон пипсов валютной пары, измеренный за определенное количество периодов. Трейдеры могут использовать ADR для визуализации потенциального движения цены за пределами среднего дневного движения. Когда ADR выше среднего, это означает, что дневная волатильность выше, чем обычно, что означает, что валютная пара может выходить за пределы своей нормы. Наш анализатор ADR состоит из 5 основных функций: Range (ADR) Screener: мультивалютный анализ ADR. Зона

Индикатор работает по моему алгоритму. Алгоритм анализирует 28 основных валютных инструмента. При установке в терминал индикатор автоматически анализирует имеющиеся инструменты для анализа. С этим связана неторопливость при переключении между таймфремами. Есть возможность использовать индикатор как дополнительный инструмент для торговли, так и как основной. Для этого есть торговые сигналы. Уровень допуска для входа есть возможность редактировать. Так же есть автоматическая настройка индикатора

Market Heartbeat in your hand! Introduction The Market Heartbeat indicator with a special enhanced algorithm (volume, money flow, cycle of market and a secret value) is a very repetitive trend finder with a high success rate . Interestingly, this Winner indicator indicates that the trend has changed its direction or the end of a trend retracement or even appears at the range market. The Market Heartbeat can use in scalping trading or trend trading. It finds immediately with alarm, notification a

A trend indicator showing the strength of bulls and bears in a trading range.
Consists of two lines:
The green line is a balanced overbought/oversold condition. The red line is the direction of trading activity. Does not redraw calculations.
Can be used on all Symbols/Instruments/Time Frames.
Easy to use and set up.
How to use the indicator and what it determines.
The basic rule is to follow the direction of the red line:
if it crosses the green line from the bottom up, the market i
FREE

PullbackMatrix provides the key information of the trading transactions when it finds the right market moment based on its built-in logic algorithm. The high accuracy signals including Trading Symbol, Entry Price, Entry Time, TakeProfit, Stoploss, and more. And that's all will be available instantly in your chart panel, drawing the position lines and also sending signal notification to email, mobile phone, and screen popup. More important is that also saves signals into a .csv file which is usef

Индикатор рисует уровни Фибоначчи с выделенными Ценовыми метками.При установке индикатора на график необходимо создать трендовую линию с именем указанным в поле" Unique name of trend line to place fib on ". По умолчанию имя=" Unique name of trend line to place fib on" = "+" .В индикаторе можно заменить уровни фибоначчи по своему усмотрению.Также меняются цвет,стиль,толщина линий и т. д.
FREE

RaysFX Supertrend + Alert RaysFX Supertrend è un indicatore di tendenza superiore progettato per i trader che desiderano avere un vantaggio nel mercato. Questo indicatore utilizza una combinazione di CCI (Commodity Channel Index) e ATR (Average True Range) per identificare le tendenze del mercato e fornire segnali di trading accurati. Caratteristiche principali Indicatori CCI e ATR : Utilizza due degli indicatori più popolari e affidabili per identificare le tendenze del mercato e generare se
FREE
Представляем Вашему вниманию индикатор, создающий сигналы!
Triple Signal Finder отображает на графике сигналы по показаниям индикаторов : от одного до трех одновременно. Вы можете использовать сразу 3 индикатора и сигналы будут отображаться при совпадении сигналов Ваших индикаторов!
Предусмотрена возможность включения 3 индикаторов , которые могут быть как стандартными, так и самостоятельно написанными .
Вы будете видеть сигналы своей стратегии на графике и в виде статистик и. В левом ве
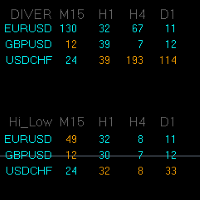
Логическим продолжнием индикатора дивергенций является индикатор Divergence HiLo Dashboard - сканер дивергенций сразу по трех валютных парах. В меню индикатора выбираем какие валютные пары будем анализировать. Анализ проводится на таймфреймах М15, Н1, Н4, D1. Кроме дивергенций проводится анализ вершын и впадин. Все данные вносятся в таблицы В индикаторе предусмотрены алерты. Согласно логики индикатора сигнал появляется после окончания 3 бара. Индикатор не перерисовывает свои значения

Supertrend indicator uses a combination of a moving average and average true range to detect the trend of a trading instrument.
Supertrend indicator for MetaTrader 5 easily shows the trend as a line following the price.
USAGE THIS INDICATOR If the closing prices are above Supertrend Line, there is a Bullish sentiment at that moment. The opposite is a Bearish sentiment. Three green lines - Strong Bullish sentiment. Three red lines - Bearish sentiment.
For BUY : - Three green lines and pr

[ MT5 Version ] Bulls and Bears Power Bulls and Bears Power is an indicator that clearly highlights if bulls or bears are currently in control of the market. A price movement started with high Bulls control in the market can indicate the beginning of a new trend movement. The relative indicator power between price peaks also indicates if the movement is losing strength and might foresee a significant correction or a trend reversal. Bulls and Bears Power indicator offers a clear and simplified vi

Non-repaint indicator to identify trade opportunities in swing action as prices move within an upper and lower band. Inspired by the Keltner Channel, the most popular channel Indicator introduced by Chester Keltner. It is different with a Bollinger Bands. It represents volatility using the high and low prices, while Bollinger's studies rely on the standard deviation. Customized by adding the trends exactly in the middle line, arrows when price cross over the outer lines and Fibonacci Levels L

KF Trix V1.00 The triple exponential average (TRIX) indicator is an oscillator used to identify oversold and overbought markets and is also a momentum indicator. The triple smoothing of moving averages is designed to filter out price movements that are considered insignificant or unimportant. About Software details and MQL login link Copyright 2022, Forex KRAL
FREE

Trade Assistant MetaTrader indicator — a multi-timeframe indicator that is based on three standard indicators: Stochastic oscillator , RSI (Relative Strength Index), and CCI (Commodity Channel Index). It displays current trend directions for M1, M5, M15, M30, H1, H4, D1, W1, and MN1 timeframes. When you follow such an indicator you have a clear picture of the trends across all important timeframes. It doesn't matter which timeframe you attach this indicator to. The indicator can be d

Watch how indicator works here; https://www.youtube.com/watch?v=3rfwzWgU6Rk CURRENTLY 50% OFF !! will only be available for first 10 DROP A COMMENT WHEN YOU PURCHASE THE INDICATOR SO I CAN ADD YOU TO THE TELGRAM GROUP Best Solution for any Newbie or Expert Trader! This indicator have been made affordable and easy to interact with, it is precise and direct to use. IT IS NONE REPAINT INDICATOR THAT CAN SEND NOTIFICATION TO YOUR PHONE
PLEASE IF YOU PURCHASE THIS INDICATOR YOU WILL BE ADDED TO A T

Trend Divergence Finder – индикатор, позволяющий выявлять дивергенции цены и графика выбранного индикатора. С помощью Trend Divergence Finder вы сможете подобрать тот индикатор, который наиболее эффективен для Вас, и использовать его с наглядным отображением на графике.
В индикатор включены 9 базовых индикаторов : 1. RSI 2. MACD 3. MOMENTUM 4. RVI 5. STOCHASTIC 6. CCI 7. Standard Deviation 8. Derivative 9. William Blau
Присутст
This is an advanced order block indicator with multi timeframe support. It can auto draw the higher highs, lower lows, breakers along with many other features that can be adjusted to the requirement of the trader. The breakers are also added to the indicator buffers with arrows. If you are an order block trader, then this is probably the best indicator you can find to minimize manual efforts. Features: Respected bullish and bearish order blocks Broken order blocks (breakers) Source order bloc

Внутридневная стратегия, основанная на двух фундаментальных принципах рынка. В основе алгоритма лежит анализ объемов и ценовых волн с применением дополнительных фильтров. Интеллектуальный алгоритм индикатора дает сигнал только тогда, когда два рыночных фактора объединяются в одно целое. Индикатор рассчитывает волны определенного диапазона, а уже для подтверждения волны индикатор использует анализ по объемам. Данный индикатор - это готовая торговая система. Все что нужно от трейдера - следовать с

ПОКАЗАТЕЛЬ ДЛЯ КАЖДОГО Pip Scalper предназначен для скальпинга трендов. Оставайтесь в тренде дольше с этим индикатором. Работает на всех таймфреймах и активах. Собирайте ежедневные пипсы с помощью этого инструмента. Используйте скользящую среднюю 200 для фильтрации сделок. Рекомендуется использовать меньшие таймфреймы. Используйте для дневной торговли.
О и как использовать:
Pips Scalper основан на долгосрочной торговле по тренду. Купить на синем Продать на красном Используйте скользящую

Def ault settings are just for visu alis ation, it c an not be profit able with it.
Get a Free EA as a Bonus when you Purchase the Indicator! Plus, Receive 4 Interesting Additional Indicators. Recommended set files for backtesting the indicator on recommended pairs are available in the comments section (last page). Please note that this product is exclusively sold on the MQL5 market. Any other sources offering it are scams, and the author bears no responsibility. To receive the bonus gifts,
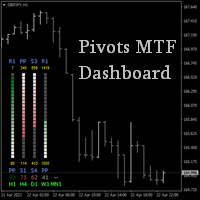
Если Вы торгуете по уровням, то этот индикатор для Вас.
Индикатор отображает уровни поддержки и сопротивления для выбранных таймфремов, дополнительно показывая сколько пунктов до ближайших уровней, а также между какими уровнями находится текущая цена в виде цветной шкалы и процентов.
Расположение в любом месте на чарте, возможность масштабирования, смещение расчёта с учётом часовой разницы Вашего брокера, выбор цветовой гаммы и прочие параметры позволят настроить индикатор на Ваше усмотрени

Полный автомат. Не требует настроек технических параметров. Работет на всех валютных парах. В индикаторе встроен зигзагообразный фильтр, который ограничивает повторы однонаправленных сигналов (т.е. после сигнала на покупку следующий будет сигнал на продажу, и наоборот). Для удобства отображения в индикаторе предусмотрена настройка вида значков, их цвет и размер: Size Arrow - размер значков Code Arrow Buy - код значка на покупку Color Arrow Buy цвет значка на покупку Code Arrow Sell - код значка

Reversal Point Detector (RPD) is an advanced indicator that is obtained from a combination of advanced mathematical functions, especially price action, which is able to detect price reversal points, or in other words, invisible market supports or resistances without the use of any tools.
This indicator can identify the appropriate trading opportunities on its own and each person can trade by setting the appropriate SL and TP according to their trading strategy and risk management.
This advan
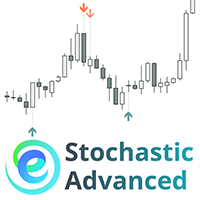
Индикатор " Stochastic Advanced " отображает сигналы индикатора ' Stochastic " прямо на графике без наличия самой кривой индикатора в нижней части экрана. Сигналы индикатора могут отображаться не только по текущему таймфрейму, но и по таймфрейму на уровень старше. Кроме этого мы реализовали систему фильтров по средней скользящей Инструкция/Мануал ( Обязательно читайте перед приобретением ) | Версия для МТ5 Преимущества
1. Отображение сигналов индикатора "Stochastic" прямо на графике без наличи

CFF Trend Way
Entry signals without repainting or delays Error-free opening of trades Provides signals for any direction
How does the CFF Trading System Works?
Our CFF Trend Way trading system based on a very accurate "Break-out" Trading Strategy. Here's how to Start using our System 1. Buy and install the indicator in your terminal. Ask the guide. 2. Start trading by receiving signals from the indicator telling you about the ideal moment to enter a trade. 3.
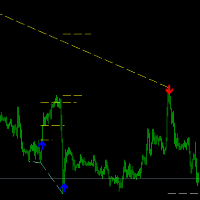
Акция! Сейчас действует специальная цена для первых 10 покупателей. Спешите.
Divergence HiLo представляет собой индикатор который определяет вершины и низины цены (Hihg end Low) . На основе специального алгоритма индикатор определяет значение дивергенции или конвергенции. Кроме значений дивергенции или конвергенции индикатор определяет предположительные уровни тейк профита. На графике цены изображаются линии дивергенции, уровни возможного профита и стрелки которые указывают на сформированн

Ease of movement is a momentum indicator that demonstrates the relationship between the rate of change in an asset’s price and its volume. It is intended for the daily chart and larger timeframes. As its name implies, the larger the magnitude of the indicator – the “easier” the movement in price – the more robust the trend is believed to be. A larger positive value indicates price moving upward on disproportionately low volume. Conversely, a larger negative value indicates price moving downward

Описание ZiqScalping
Индикатор ZiqScalping предназначен для торговли как валютами с большой волатильностью , так и трендо-направленных валют. Рекомендуемый тайм фрейм для скальпинга : М5 , М15, М30. Рекомендуемый таймфрейм для торговли внутри дня и выше: Н1, D1. Работает на всех парах! Настройки :Смотрите на скриншотах. Принцип принятия решения! Индикатор построен на базе 2 МА, MACDI,OSMA. Графически показаны стрелки с направлениями тренда и 2 линии МА. В формулу вписаны расчёты объёмов по
Trade with super Support and Resistance Breakout system.
are you looking for the most sophisticated tools for your daily trading ? this tools are perfect for you, it has a most comprehensive breakout identification spot on all market (Forex, CFD, indice, etc)
Limited offer : 10 copy for 30$
Indicator parameter: Depth: to arrange how deep to calculates the support and resistance zone Deviation Back-step
the demonstration result you can see on the media file below.

KT Higher High Lower Low marks the following swing points with their respective S/R levels: Higher High: The swing high made by the price that is higher than the previous high. Lower High: The swing high made by the price that is lower than the previous high. Lower Low: The swing low made by the price that is lower than the previous low. Higher Low: The swing low made by the price that is higher than the previous low.
Features The intensity of swing high and swing low can be adjusted by cha

its not just an Indicator. its a trading system I'm working on for 3 years and also would be updated you don't need any thing else to trade because its a price action indicator that shows all static and dynamic support and resistance this indicator contains 7 lines that gives us dynamic static support and resistance also when main lines (white ones) become flat for 26-52 periods they show strong levels. you can find consolidating areas, strong downtrend(in Green channel) and strong uptrend(in
Highly configurable Volume indicator.
Features: Highly customizable alert functions (at levels, crosses, direction changes via email, push, sound, popup) Multi timeframe ability Color customization (at levels, crosses, direction changes) Linear interpolation and histogram mode options Works on strategy tester in multi timeframe mode (at weekend without ticks also) Parameters:
Volume Timeframe: You can set the lower/higher timeframes for Volume. Volume Bar Shift: you can set the offset of th
FREE
Your attention is invited to the indicator Price Action Indicators. It doesn't need settings. And also it is not tied to more than one indicator, which makes it not vulnerable to different accounts or brokers.
Add one setting PERIOD
Regards, Mikhail
Вашему вниманию предлагается индикатор Price Action Indicators. Ему не нужны настройки. А также он не привязан не к одному индикатору, что делает его не уязвимым перед разными счетами или брокерами.
С Уважением Михаил
FREE
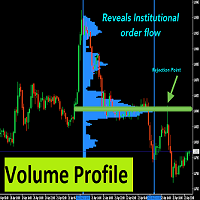
With Fixed Range Volume Profile,The traces left by the big players will not go unnoticed by you.
Professional Volume Profile Indicator reveals Institutional order flow. This advanced market indicator will teach you to spot the buying and selling. Dont want to say more because its well known by most professionals trader. This Indicator : - Quickly Identify the Strongest Institutional S/R Zones. - W orks with all Trading Instruments (Forex, Futures, Indexes, Commodities, Stocks, Cryptoc
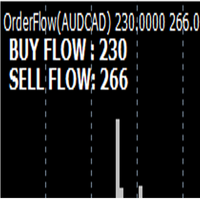
Just a simplified way of observing the volume. It shows the buy flow against the sell flow. See the volume coming in and trade with the money. Visualize the trend rising or falling and trade according to the imbalance in volume. Use for scalping and trend trading. Trade by volume coming in. FOOTPRINT CHART: https://www.mql5.com/en/market/product/94153 Order Book: https://www.mql5.com/en/market/product/102247 EA Based: https://www.mql5.com/en/market/product/82585
Note: Works in real
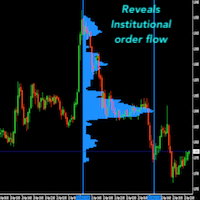
This is a key indicator and guideline for institutions and pension plans that look to take large positions and need to know whether they are getting in at a good price or not. It also allows them to get into positions without disrupting the market or elevating prices unnaturally with their large orders, resulting in unfavorable entry prices for them. The VWAP is a major level of importance that a lot of big traders and institutions monitor and is why you should be paying attention to it too. Ba
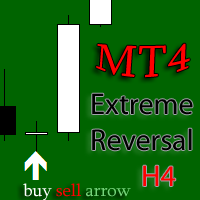
Версия индикатора под Meta Trader 4 ! Этот стрелочный индикатор ищет возможные развороты рынка и коррекционные движения на таймфреймах H4 и D1 . Основан на закономерностях рынка FOREX, точных определениях текущего экстремума и нахождения свечных моделей на вершинах/низах рынка. Универсальный алгоритм помогает определить точки разворота указывая стрелками где осуществить вход в рынок. Настройка индикатора очень проста! Переместите на график выбранной валютной пары и следите за появлением сигн
CFF Banks Liquidity
Entry signals without repainting or delays Error-free opening of trades Provides signals for any direction sell & Buy
How does the CFF Banks Liquidity Works?
Our CFF Banks Liquidity trading system based on a very accurate "Trend-Following" Trading Strategy. Here's how to Start using our System 1. Buy and install the indicator in your terminal. Ask the guide. 2. Start trading by receiving signals from the indicator telling you about the ideal mom

Heiken Ashi candle chart is an improved version of The Japanese candle chart, which can effectively filter the market "noise" of the Japanese candle chart. It is favored by many traders for its simplicity and intuition. For trend traders, the HA candle chart is a magic tool. Unlike the traditional Japanese candle chart, Heikenashi does not reflect the opening price, high price, low price and closing price of the market. Instead, Heikenashi calculates the value of a single K line in the dominant
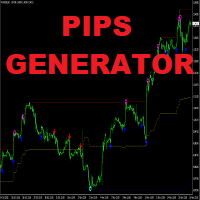
Apollo Pips Generator — это система, которая подает сигналы в направлении тренда. Индикатор предоставляет несколько точек входа, поэтому вы всегда можете найти торговую возможность для получения прибыли. Индикатор также определяет зоны перекупленности и перепроданности, которые можно использовать для закрытия позиции. Рекомендуемый тайм фрейм - H1. После покупки ПОЖАЛУЙСТА, СВЯЖИТЕСЬ СО МНОЙ, чтобы ПОЛУЧИТЬ МОИ РЕКОМЕНДАЦИИ ПО ТОРГОВЛЕ И БОНУС! Желаю вам удачной торговли!

Уникальный индикатор, реализующий профессиональный и количественный подход к торговле на возврате к среднему. Он использует тот факт, что цена отклоняется и возвращается к среднему предсказуемым и измеримым образом, что позволяет использовать четкие правила входа и выхода, которые значительно превосходят неколичественные торговые стратегии. [ Installation Guide | Update Guide | Troubleshooting | FAQ | All Products ]
Четкие торговые сигналы Удивительно легко торговать Настраиваемые цвета и разм

Три основных валютных рынка в мире:
Нью-Йорк (время США), Лондон (время Европы) и Токио (время Азии).
Лучшее время для торговли на рынке Форекс — это когда основные торговые рынки пересекаются. Как правило, большинство трейдеров участвуют в этих торговых сессиях, которые обеспечивают большую ликвидность и меньшие спреды между валютными парами, которыми торгуют инвесторы. , выберите эти периоды времени для торговли, вам будет легче зарабатывать деньги.
Я разработал индикатор, который может

Среднее Лемера можно рассматривать как оконную функцию, весовые коэффициенты которой зависят от значений используемых при расчете переменных. Это среднее является нелинейным, так как при его расчете используется возведение в степень. Характеристики индикатора зависят от двух параметров: iPeriod - период индикатора, допустимое значение больше или равно 2; iPower - показатель степени, который используется прирасчете значений индикатора. Допустимый интервал от -32 768 до 32 767
При iPower = 0 мы
MetaTrader Маркет предлагает каждому разработчику торговых программ простую и удобную площадку для их продажи.
Мы поможем вам с оформлением и подскажем, как подготовить описание продукта для Маркета. Все продаваемые через Маркет программы защищаются дополнительным шифрованием и могут запускаться только на компьютере покупателя. Незаконное копирование исключено.
Вы упускаете торговые возможности:
- Бесплатные приложения для трейдинга
- 8 000+ сигналов для копирования
- Экономические новости для анализа финансовых рынков
Регистрация
Вход
Если у вас нет учетной записи, зарегистрируйтесь
Для авторизации и пользования сайтом MQL5.com необходимо разрешить использование файлов Сookie.
Пожалуйста, включите в вашем браузере данную настройку, иначе вы не сможете авторизоваться.