Смотри обучающее видео по маркету на YouTube
Как купить торгового робота или индикатор
Запусти робота на
виртуальном хостинге
виртуальном хостинге
Протестируй индикатор/робота перед покупкой
Хочешь зарабатывать в Маркете?
Как подать продукт, чтобы его покупали
Новые технические индикаторы для MetaTrader 4 - 70

Grey worm This indicator is a group of indicators combined
Volatility and saturation give us buying and selling and many more things
Use this indicator with your technical analysis or strategy
Do not use it alone and it will give you very good results
It is valid to work on all pairs, metals and instruments
If you have any question, I will be happy to answer it
Please do not forget to rate the good and the positive comment

G-Ca$H IC Breaker (Source and Breaker Order Block Indicator) If you need support you can message via profile please check out the video and description where I try to answer the most common issues and how to use indicator there is also another short video i have made here https://youtu.be/yB9VutPfr-A We want to help you get the most out of the indicator and we like helping our customers . Please also see our other product https://www.mql5.com/en/market/product/58535?source=Unknown%3Ahttps

Indicator function Choose to go long or short when crossing the EMA or crossing the 0 line below It is best to use 1H for testing About update questions In order to be more suitable for market fluctuations, the company regularly updates the indicators Product cycle and trading time applicable to indicators Applicable mainstream currency pair EUR/USD GBP/USD NZD/USD AUD/USD USD/JPY USD/CAD USD/CHF Applicable mainstream cross currency pair EUR/JPY EUR/GBP EUR/CHF EUR/CAD EUR/NZD AUD/CAD AUD/N
TrendRange Indicator works on M1, M5, M15, M30, H1 and H4 timeframes. It indicates real market trend, support and resistance levels. In other words, it confirms trade directions. Scalpers especially, Intraday, swing, intermediate and long term traders will especially find this indicator useful. It uses customized show/hide buttons namely: "DRAW", "HILO", and "LEVEL" lines crossings and histograms ("AWOS" for Awesome Oscillator, "BUBE" for Bull Power and Bear Power & "GATO" for Gator Oscilla

Indicator function Choose buy and sell at horizontal line 0 It is best to use 1H for testing About update questions In order to be more suitable for market fluctuations, the company regularly updates the indicators Product cycle and trading time applicable to indicators Applicable mainstream currency pair EUR/USD GBP/USD NZD/USD AUD/USD USD/JPY USD/CAD USD/CHF Applicable mainstream cross currency pair EUR/JPY EUR/GBP EUR/CHF EUR/CAD EUR/NZD AUD/CAD AUD/NZD AUD/CHF AUD/JPY GBP/JPY GBP/CHF NZ

Indicator function Buy and sell at the 0.19 threshold.Notice that the level number is 0.19! It is best to use 1H for testing About update questions In order to be more suitable for market fluctuations, the company regularly updates the indicators Product cycle and trading time applicable to indicators Applicable mainstream currency pair EUR/USD GBP/USD NZD/USD AUD/USD USD/JPY USD/CAD USD/CHF Applicable mainstream cross currency pair EUR/JPY EUR/GBP EUR/CHF EUR/CAD EUR/NZD AUD/CAD AUD/NZD AU

Indicator function Please set the level line with a value of 0 and buy and sell at the level line of 0 It is best to use 1H for testing About update questions In order to be more suitable for market fluctuations, the company regularly updates the indicators Product cycle and trading time applicable to indicators Applicable mainstream currency pair EUR/USD GBP/USD NZD/USD AUD/USD USD/JPY USD/CAD USD/CHF Applicable mainstream cross currency pair EUR/JPY EUR/GBP EUR/CHF EUR/CAD EUR/NZD AUD/CAD

Indicator function Choose to buy and sell according to the system prompts It is best to use 1H for testing About update questions In order to be more suitable for market fluctuations, the company regularly updates the indicators Product cycle and trading time applicable to indicators Applicable mainstream currency pair EUR/USD GBP/USD NZD/USD AUD/USD USD/JPY USD/CAD USD/CHF Applicable mainstream cross currency pair EUR/JPY EUR/GBP EUR/CHF EUR/CAD EUR/NZD AUD/CAD AUD/NZD AUD/CHF AUD/JPY GBP/

Indicator function Choose to buy and sell where the EMA crosses
It is best to use 1H for testing About update questions In order to be more suitable for market fluctuations, the company regularly updates the indicators Product cycle and trading time applicable to indicators Applicable mainstream currency pair EUR/USD GBP/USD NZD/USD AUD/USD USD/JPY USD/CAD USD/CHF Applicable mainstream cross currency pair EUR/JPY EUR/GBP EUR/CHF EUR/CAD EUR/NZD AUD/CAD AUD/NZD AUD/CHF AUD/JPY GBP/JPY GBP/

Indicator function Choose to buy and sell where the yellow EMA crosses zero It is best to use 1H for testing About update questions In order to be more suitable for market fluctuations, the company regularly updates the indicators Product cycle and trading time applicable to indicators Applicable mainstream currency pair EUR/USD GBP/USD NZD/USD AUD/USD USD/JPY USD/CAD USD/CHF Applicable mainstream cross currency pair EUR/JPY EUR/GBP EUR/CHF EUR/CAD EUR/NZD AUD/CAD AUD/NZD AUD/CHF AUD/JPY GB

Indicator function Choose to buy and sell where the yellow moving average crosses zero. Arrow for overbought oversold reference only The indicator is suitable for the best time period of 1H
About update questions In order to be more suitable for market fluctuations, the company regularly updates the indicators Product cycle and trading time applicable to indicators Applicable mainstream currency pair EUR/USD GBP/USD NZD/USD AUD/USD USD/JPY USD/CAD USD/CHF Applicable mainstream cross currenc
--------------------DEMO VERSION----------------------------- It will only run on GBPUSD and EURUSD currency pairs only Objective: To notify/alert traders if price touched or closed above/below the moving average. Features/Settings: Moving average method supported: Simple, Exponential, Smoothed and Linear Weighted Works on all currency pairs. Set the Moving Average Period/Shift value Timeframe supported: 1m, 5m 15m, 30m, 1H, 4H, 1D, 1WK, 1Mo Set the Applied Price: Close, Open, High, Low, Pric
FREE
This is a Indicator that alert if price closed above/below/touched the line. ---------------------DEMO VERSION----------------------- This will only run on GBPUSD and EURUSD currency pairs only. (Full Version works on all currency pairs ) Features/Settings: Timeframe supported: 1m, 5m 15m, 30m, 1H, 4H, 1D, 1WK, 1Mo Works on all currency pairs.
Candle Size in Pips: Alert based on Candle Full length or Candle Body Select Line style/width/color Alert type: Popup, Send to mobile, Email Input alert
FREE

Indicator function Select a trend based on the Angle above and below the indicator curve, and choose overbought and oversold when an action crosses the trend line It is best to use 1H for testing About update questions In order to be more suitable for market fluctuations, the company regularly updates the indicators Product cycle and trading time applicable to indicators Applicable mainstream currency pair EUR/USD GBP/USD NZD/USD AUD/USD USD/JPY USD/CAD USD/CHF Applicable mainstream cross c
индикатор для торговли на рынках форекс и других Полное отсутствие перерисовки. рекомендацыи с периодом по умолчанию консервативный метод торговли тейкпрофит 50 pips стоплосс 80-100 pips закрытие сделок по тейкпрофит - стоплосс или по противоположному сигналу агресивный метод торговли тейкпрофит 100 pips стоплосс 100 pips закрытие сделок по тейкпрофит - стоплосс или по противоположному сигналу сигнал поступает на текущей свечи в момент ее появления есть звуковой алерт и push увидомления инд

Average Price Plus is an essential indicator for day-to-day operations. With it, you can graphically check the average price between several open orders on your chart. The average price is the breakeven point between your orders. In addition to the average price, the indicator also shows you the number of pips and the financial value resulting from your open orders, the percentage gains, the number of lots in operation and the number of open orders. Negative values in "pips" or in financial val
FREE

This Dashboard is free to download but is dependent on you owning the Gold Pro MT4 indicator. Get the indicator here: https://www.mql5.com/en/market/product/60430
The Dashboard will show you on a single chart all the timeframes (M1 to Monthly) with their own status for the indicator: Gold Pro MT4
all time frame and all symbol: smart algorithm detects the trend, filters out market noise and gives entry signals!!!
How to understand the status: Dashboard Show "Buy" - Buy Signa
FREE

This is an indicator with real-time reminder function, which can realize real-time monitoring of four harmonic patterns of multiple cycles (30 minute chart, 1 hour chart, 4 hour chart, 1 day chart), and help traders to have insight into market reversal opportunities. Gartly Bat Butterfly Cypher Before loading into the chart, you need to manually input the switch parameters, which are the harmonic patterns and time period you want to monitor: M30 / H1 / H4 / D1. It is on when the corresponding
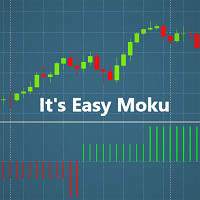
Introduction:
Welcome dear Users, This indicator has been developed in order to help traders who are daily struggling to find a strategy . I have always been acctracted by Ichimoku Strategy, however took me sometime figure out how it does work. Easy Moku makes Ichimoku Simple!
Aspect:
Easy Moku shows 2 principal ICHIMOKU signals: kijun sen/tenken sen sen crossover Span A Span B + Kijun sen/tenken sen Get Rid of all the Ichimoku Lines!
On the Mt4 Chart the Easy Moku paints an Histog
FREE

Are you looking for a powerful tool to analyze currency strength and identify the best trading opportunities? Look no further than the Currency Strength Indicator. Our easy-to-use tool offers a wide range of features that will help you professionally define weak and strong currency pairs, so you can make informed trading decisions with ease. One of the most significant benefits of our indicator is the ability to select up to 10 currencies for monitoring. And the currencies are not limited to fi
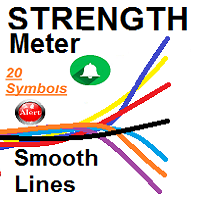
Currencies Strength Meter Smooth Lines Currencies Strongest Weakest SMOOTH STRENGTH METER INDICATOR (SMOOTH LINE) it draws Currencies TREND Volatility Power / Strength lines : - Detects the 2 highly TRENDED Volatile pairs ( will be the Bold Lines ) - A very Helpful Indicator - It draws smooth lines for up to 20 currencies pairs representing Volatility strength and power - First it indicates the most powerful trended direction pairs : Strongest / Weaker - MAIN FUNCTION :i
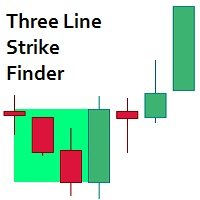
The three line strike pattern, which consists of three bullish or bearish candles, and a fourth candle that is larger than the previous three in the opposite direction, can be traded many ways. This indicator simply highlights those previous trades, and then pushes out targets in the direction of the last candle.
Advantages of three line strike The three line strike can be traded as part of a bullish and bearish engulfing pattern, 2 bar reversal set up and n-Bar rallies and declines.
How it

This indicator watch the Fibonacci retracement for levels and timeframes selected by the trader. In the workload of day trading, having your eyes on all the timeframes to validate some information, for Fibonacci traders, is really time consuming and requires constant focus. With this in mind, this tool allows you to have your attention on other trading details while this one monitors the retracements of each timeframe in real time. In the charts, this indicator data (retracement %, age of the r

TDI Signals generates buy and sell arrows based on a TDI(Traders Dynamic Index) algorithm. It looks for price breakouts, continuations and reversals. By default it runs in the trend mode but user is provided with the option to change that to reversal mode. Trader can use the mode which compliments his/her trading style.
Usage:- TDI Signals can be used as a stand alone indicator with context or even be added to strategies to make confirmations more strong. Volatility based stop loss, take pr
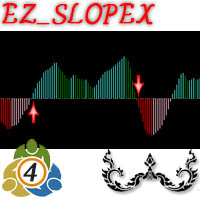
EZ Slope X is an Oscillator Indicator very easy to used just look at the Indicator and the base line (Zero line)
Trade Setup for Trend follow : - when the indicator is above 0 is gone Buy. - when the indicator is below 0 is gone Sell.
Trade Setup for Swing Trade : Bullish Market : - Open Buy when the indicator turn Light Green color. - Close Buy when the indicator turn Dark Green color. Bearish Market : - Open Sell when the indicator turn to Red color. - Close Sell when the indicator turn
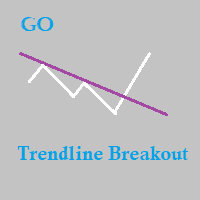
GO Trendline Breakout indicator is designed to find the breakouts of trendlines in the direction of the trend. Feel free to check out my other products here : https://www.mql5.com/en/users/gyila.oliver/seller#products
the indicator implements a unique trend detection algorithm, and finds the trendlines from swing highs/lows/ The indicator implements visual alerts and push notifications.
The indicator can be used on any currency pair / stocks/ indices and on any timeframe.
How to use t

This indicator computes a channel around the price based on highs and lows of the previous bars (whose number is set by user). The indicator provides alerts when upper or lower channel bands are crossed by closing price. User can receive a standard alert on MT4 and/or a push notification on Metatrader app. User can configure the indicator through the following parameters: InpPeriod - number of previous bars UseAlert - if set to True, enables visual alert on the display UsePush - if set to Tr
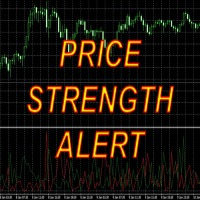
This indicator computes two lines representing the price bar strength. Close, high and low of each bar are compared with the highest high and lowest low of the last N bars, where N is a parameter set by user. Two lines are computed, a red one and a green one, with values between 0 and 100. High values of the red line means that close is very far from the bar high, while high value of the green line means price is very far from the bar low . The indicator provides alerts when red or green line a
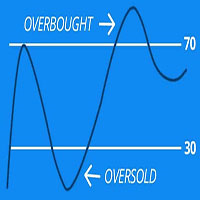
Scan all your favorite pairs with RSI, and get notified on your preferred time frames.
Settings are Customizable
Click to change time frame or open new pairs
Notification: Phone/Popup/Email The relative strength index (RSI) is a technical indicator used in the analysis of financial markets. It is intended to chart the current and historical strength or weakness of a pair/stock based on the closing prices of a recent trading period. The RSI is most typically used on a 14 period, measured o
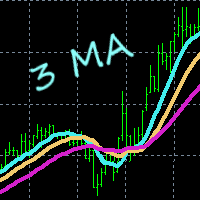
This indicator gives you a modified version of three Moving Averages. Great for scalping. Does not feature any alerts, and is best used manually after confirming multi line displays. Settings: Period1 Period2 Period3 Period4 How to use: Simply attach to any chart with default settings. Buy when the 4 lines converge below the price. Sell when the 4 lines converge above the price. Take note of the slope of Period4. See example pictures below. Best results when looking at three or more time frame
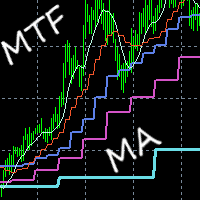
This indicator displays a modified version of Moving Averages for multiple time frames: Current (TF indicator is attached to), M5, M15, M30, H1, H4, Daily, Weekly and Monthly. NB: Make sure to download currency history before testing and use. No need to set up the indicator. Features an audible alert function for the current chart's line. How to use: Simply attach to M5 chart. Hover over the lines to see the line's time frame. Buy when more than two MTF lines cross closely together below the pri
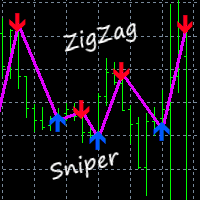
This indicator gives you a modified ZigZag, combined with a special algorithm. Great for scalping. Perfect for channel trading. Parameter TrendPeriod. Features alert functions. How to use: Simply attach to any chart with default settings. Buy when the line crosses below the price, and blue arrow. Sell when the line crosses above the price, and red arrow. It helps to keep the audible alert set to true. Best results when checking two or more timeframes before entering trades. (See comment #1 for
The Average True Range (ATR) is a tool to measure volatility. ATR MTF (Multi Time Frame) indicator provides all timeframe trends helps to identify in which kind of volatility environment the market .This indicator can be used with any Trading Systems for additional confirmation of trading entries or exits. It is a very helpful tool to calculate Targets and Stops according the current market conditions.
The indicator sets two bells at the planned levels. The upper bell is set above Ask price and lower bell is below Bid price. You can set both or one of them. When the level is exceeded, indicator emit a single sounds. Sound is emit with every arriving tick. In fast arrivals of Tick, the sounds is continuously. The bells are initially entered manually in the input window. They can be modified by moving the set of lines in chart. It is good practice top bell set slightly below valid level

DMAX SIGNAL IS VERY POWERFUL TOOL TO HELP YOU ENTRY,ITS CAN DETECT OVERSOLD AND OVERBOUGHT IN FOREX MARKET. ITS CAN TRADE 24 FOREX PAIR IN MARKET, 80% ACCURATE RESULT. MANY TRADER FAIL BECAUSE OF ENTRY POINT AND EXIT POINT , SIGNAL OF DMAX WILL GIVE VERY GOOD SIGNAL TO LET YOU KNOW WHERE TO ENTRY AND EXIT. RISK MANAGEMENT IS VERY IMPORTANT IN TRADING FOREX, PLEASE DONT RISK OVER 5% PER TRADE IS FORE MARKET
Индикатор представляет собой 2 линии разных периодов: одна линия краткосрочная (красная линия), другая долгосрочная (синяя линия). Каждая из линий- это жесткий Moving Average, взвешенный по многим параметрам. Соответственно, торговать нужно по волатильности графика. В индикатор для удобства добавлены скользящие средние периодов High, Low, Median((High-Low)/2). Входные параметры: IndicatorPeriod: несколько периодов (general-общий, вычисление по всем периодам; small-краткосрочный; medium-средний

Description :
VWAP (Volume-Weighted Average Price) is the ratio of the value traded to total volume traded over a particular time horizon. It is a measure of the average price at which pair is traded over the trading horizon. Read More.
All Symbols and All Timeframes are supported.
Indicator Inputs :
VWAP Mode : Mode of VWAP Calculation. Options can be selected : Single,Session,Daily,Weekly,Monthly
Volumes : Real Volumes,Tick Volumes
Price Type : Used price for ca

Trend arrow Indicator is an arrow Indicator used as an assistant tool for your trading strategy. The indicator analyzes the standard deviation of bar close for a given period and generates a buy or sell signals if the deviation increases. It good to combo with Martingale EA to follow Trend and Sellect Buy Only/Sell Only for EA work Semi-Automatic.
You can use this Indicator with any EAs in my Products.
FREE

Индикатор Consequence определяет моменты разворота тренда и направления его движений. Он предоставит вам всё необходимое для того, чтобы преодолеть убытки из-за человеческих эмоций. Consequence оснащен самыми современными, приспосабливаемыми и прибыльными торговыми алгоритмами. Пора перестать бродить в потемках и обрести четкое видение целей во внутридневной торговле, для чего и создан этот индикатор.
Один из секретов краткосрочного трейдинга — это знать когда нужно зайти в сделку. При этом и

Indicator function When the color of the indicator changes, it will send you a long short notice
It is best to use 1H for testing About update questions In order to be more suitable for market fluctuations, the company regularly updates the indicators Product cycle and trading time applicable to indicators Applicable mainstream currency pair EUR/USD GBP/USD NZD/USD AUD/USD USD/JPY USD/CAD USD/CHF Applicable mainstream cross currency pair EUR/JPY EUR/GBP EUR/CHF EUR/CAD EUR/NZD AUD/CAD A

It will be the best tool for you to make a profit! Through unique algorithms You're going to see an amazing amount of right trading signals Make huge profits every day and realize more possibilities! Like the car no money to buy it, the love of the girls dare not to pursue?Or the credit card bill is not paid, the rent does not have the extra money to settle?Or are you fed up with being bossed around by your boss and Hope to get more people's respect?Can't afford to buy the things you want ? wa

Indicator function Choose to buy or sell at the critical point of indicator zero It is best to use 1H for testing About update questions In order to be more suitable for market fluctuations, the company regularly updates the indicators Product cycle and trading time applicable to indicators Applicable mainstream currency pair EUR/USD GBP/USD NZD/USD AUD/USD USD/JPY USD/CAD USD/CHF Applicable mainstream cross currency pair EUR/JPY EUR/GBP EUR/CHF EUR/CAD EUR/NZD AUD/CAD AUD/NZD AUD/CHF AUD

Индикатор Resolved с точностью генерирует входные сигналы и уровни выхода.
Если среднее значение цены синее, вам следует искать точки входа для открытия длинных позиций, когда рынок не перекуплен, а если среднее значение цены красное, вам следует искать точки входа для открытия коротких позиций, когда рынок не перепродан. Правила могут быть сведены к следующим. Следует покупать во время восходящего тренда, когда цена достигает среднего значения или перепроданности, и продавать во время нисхо

Indicator function As shown in the figure, choosing to buy or sell at the dotted line of the indicator, and following the trend with the Angle of the channel up and down, are equally effective in bands and trends It is best to use 1H for testing About update questions In order to be more suitable for market fluctuations, the company regularly updates the indicators Product cycle and trading time applicable to indicators Applicable mainstream currency pair EUR/USD GBP/USD NZD/USD AUD/US

Indicator function This index buys and sells according to the color, using time is one hour,Please run the test on a 30-minute cycle It is best to use 1H for testing About update questions In order to be more suitable for market fluctuations, the company regularly updates the indicators Product cycle and trading time applicable to indicators Applicable mainstream currency pair EUR/USD GBP/USD NZD/USD AUD/USD USD/JPY USD/CAD USD/CHF Applicable mainstream cross currency pair EUR/JPY EUR/GBP E

Indicator function Buy and sell by indicator color It is best to use 1H for testing About update questions In order to be more suitable for market fluctuations, the company regularly updates the indicators Product cycle and trading time applicable to indicators Applicable mainstream currency pair EUR/USD GBP/USD NZD/USD AUD/USD USD/JPY USD/CAD USD/CHF Applicable mainstream cross currency pair EUR/JPY EUR/GBP EUR/CHF EUR/CAD EUR/NZD AUD/CAD AUD/NZD AUD/CHF AUD/JPY GBP/JPY GBP/CHF NZD/JPY App

Indicator function Moving averages cross a short-term buy and sell, moving averages cross a 50 horizontal line a long-term buy and sell It is best to use 1H for testing About update questions In order to be more suitable for market fluctuations, the company regularly updates the indicators Product cycle and trading time applicable to indicators Applicable mainstream currency pair EUR/USD GBP/USD NZD/USD AUD/USD USD/JPY USD/CAD USD/CHF Applicable mainstream cross currency pair EUR/JPY EUR/GB

Индикатор определяет состояние рынка: тренд или флэт.
Состояние рынка определяется с учётом волатильности.
Жёлтым цветом отображается флэт(торговый коридор).
Зелёным цветом отображается тренд вверх.
Красным цветом отображается тренд вниз.
Высота метки соответствует волатильности на рынке.
Индикатор не перерисовывается .
Настройки History_Size - размер рассчитываемой истории.
Period_Candles - количество свечей для расчёта индикатора. Send_Sound - звуковое оповещение. Send_Mail

Особенность Star 4D это наличие сигнала для входа/выхода - линия индикатора определённым цветом обозначает сигналы "buy" или "sell". Точность этого сигнала достаточно приемлима, смотрите и судите сами. Star 4D также подойдет для выхода из позиции. Индикатор захватывает практически полностью тренд, но во время флета необходимо использовать фильтры. При входе в позицию, вы всегда будете работать "по тренду". Это замечательное свойство делает Star 4D более привлекательным.
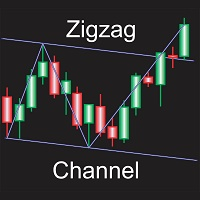
Automatically draws channel base on zigzag, with option to draw zigzag based on candle wicks or close prices. All zigzag parameters can be adjusted in settings, option to display or hide zigzag also available, every other adjustable settings are self explanatory by their name, or at least so I believe. Only download this indicator if you need a program to automatically plot channels for you based on zigzag of any specific settings.
FREE
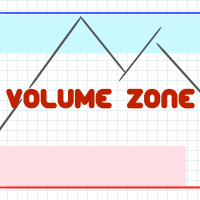
Volume Zone is a unique indicator that uses special algorithm to determine the volumes traded for the period. There are two features of the indicator, the volumes price and and volumes zone. The volume price give the level at the buyers and sells entered the market. The zones also serve a good support/resistance and also site for demand/supply areas. The indicator was mainly designed to trade GBPUSD but also be applied on other pairs. The indicator can used by both beginners and advance trades.

Trend surfer is indicator based on volume calculation in combination with algorithm that recognize trend changes . For aditional filtering, user can choose from 3 different oscillators, or can use their combination. Basic idea of indicator is to give signal when current volume is above value defined as Volume MA period*Volume MA multiplier, and trend change algorithm detects start of new trend wave. When all conditions are met and new trend wave is detected, indicator plot arrow on chart. Arrows

Leave a review for this product, and receive another "Free" product that you choose. You can see my other products here: https://www.mql5.com/en/users/zakri/seller
Trend Detective is an advanced trend detection indicator which shows accurate entry points in direction of trend. It uses smart technology in order to detect entry points, trend changing points, and TP points. It also shows hit rate for current chart using selected parameters. Hit rate for this indicator on different charts can be
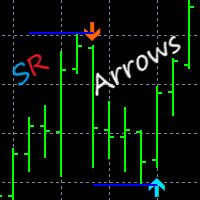
This indicator gives you arrows, two SR lines and a white trend line. Uses a special trend algorithm to plot the arrows, combined with support and resistance inputs. Perfect for channel trading. Features alert functions.
Parameter TrendArrowPeriod. Parameter TrendLinePeriod. (Change to your preference) How to use: Simply attach to any chart with default settings. Zoom in the chart, to see the two blue SR lines and arrows more clearly. It is very important to wait for a new blue SR line to appea

Trend is Friends is an line Indicator used as an assistant tool for your trading strategy. The indicator analyzes the standard deviation of bar close for a given period and generates a buy or sell trend if the deviation increases. It good to combo with Martingale EA to follow Trend and Sellect Buy Only/Sell Only for EA work Semi-Automatic. You can use this Indicator with any EAs in my Products.
FREE
This indicator takes input from Support and Resistance levels, combined with a special trend filter. Easily spot tops and bottoms, and trade with more confidence. Great for scalping or long-term trading. This indicator can be used on all time frames and pairs. Features alert function.
No need to set up the indicator.
How to use: Simply attach to any chart. Red histogram line color = Selling opportunities. Blue histogram line color = Buying opportunities. See pictures below. To spot highs/tops

Wolfe Waves scanner - It scans all the Symbols and identify the movement of price and it gives confidence in trade. It automatically plots fifth wave breaks out of the channel. According to the theory behind the pattern, a line drawn from the point at the beginning of the first wave and passing through the beginning of the fourth wave predicts a target price for the end of the fifth wave. If a trader properly identifies a Wolfe Wave as it forms, the beginning of the fifth wave represents an op

This is the new version of the Algorithmic signals featuring a new algorithm. It is a blend of technical and candlestick analysis. Candlestick analysis are often ignored while creating technical strategies but this version has a feature to include that and make confirmations more strong. Usage:- Traders can use the signals for buying and selling assets or even blend their own favorite indicators with it.

Think of an Experienced Traders’ Brain as a blueprint for a trading algorithm. Then the desire to keep charts as clutter free as possible. What you see below is a blueprint of Paul Bratby’s thought process but even he admits, he is getting too old to focus on all of these! • 9 Decision Points before Paul considers grading the trade a 3* trade
• Then another special Decision Point will make it a 4* trade
• Another for 5* trade
• And Finally, a total of 12 Decision Points being correct before
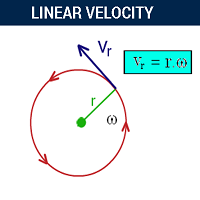
LinearVelocity Indicator
Velocity is Distance/Time where Distance is Close-Open basicly. Linear velocity; calculated with tick volume*Velocity in smoothed way. Red line shows LinearVelocity based of zero level in that way. And Magenta line is Moving avrages of LinearVelocity. Final Indicator helps you detecting trend in different timeframes. Default input parameters for M5 timeframe, and you can change them for different timeframes and different pairs. I wish you good profits.

Смысл этого индикатора состоит в том, чтобы находить уровни Мюррея на всех таймфреймах и объединять их в комбо-уровни , включающие сигнальные уровни, основанные на сильных уровнях Мюррея (+2, +1, 8, 4, 0, -1, -2). Чем меньше таймфрейм, тем больше у вас шансов сразу увидеть уровень комбо. Он будет выделен цветом. При наведении курсора на любое число появится подсказка, к какому таймфрейму относится уровень. Но вы всегда будете видеть текущий таймфрейм крайним левым. Умное оповещение пом

Индикатор синхронизирует восемь видов разметки на нескольких графиках одного торгового инструмента.
Этот индикатор удобно использовать вместе с "Multichart Dashboard" или другим похожим помощником, который позволяет работать сразу с несколькими графиками одновременно.
"Multichart Dashboard" можно найти по ссылке на моём youtube-канале.
Настройки:
включение синхронизации Vertical Line
включение синхронизации Horizontal Line
включение синхронизации Trend Line
включение синхрониз
FREE
SEE THE TREND ON EVERY TIME FRAME. INTELLIGENT INDICATOR READS PRICE ACTION TO SPOT TRUE MARKET CYCLES AND TREND. This advanced multi-currency and multi-time frame indicator, reads trend in real-time so you always know the trends of the markets you want to trade.
Trend-Viewer Pro has been specifically designed to read the trend of every time frame and every market , simultaneously, making it much easier for you to find markets with time frame correlation , so you can focus on the best market
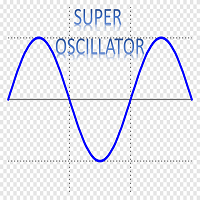
Super Oscillator , is a powerful indicator that vibrates along with the market, resulting in a very useful tool to improve and decide your trading.
You can download the demo and test it yourself.
In a versatile indicator that in a single graph shows us information about four different aspects of the market
1) 4 operational zones. The indicator divides the screen into 4 zones that allows us to properly assess the moment of the market. a) Pullback Buy Trend. If the indicator is above 80,

Smoothing Oscillator , is a powerful indicator that vibrates along with the market, resulting in a very useful tool to improve and decide your trading. This indicator is a smoothed version of the Super Oscillator MT4 that you can download at this link https://www.mql5.com/es/market/product/59070 The idea of this indicator is to smooth and limit the aggressiveness of the previous indicator, it has less power in terms of pullback points but has more power to detect trends and consolidation

Индикатор строит графический анализ на основании теории Фибоначчи.
Фибо-Веер служит для анализа импульсов и коррекций движения.
Разворотные линии (2 линии у основания веера фибоначчи) служат для анализа направления движений.
Индикатор отображает 4 целевых линии в каждом направлении.
Индикатор учитывает волатильность на рынке.
Если цена выше разворотных линий, имеет смысл рассматривать покупки, если ниже, то продажи.
Открывать позиции можно после пробоя, отбоя или тестировани

Multiphase – это индикатор канала без перерисовки, строящийся на основании скользящих средних. Ключевое отличие индикатора Multiphase от других канальных индикаторов (например, от того же Боллинджера) состоит в том, что Multiphase берет в расчет не простые скользящие средние, а дважды сглаженные, что, с одной стороны, позволяет более четко определять движение рынка, но, с другой стороны, делает индикатор менее чувствительным.

Индикатор тренда Trend Logic дает возможность классифицировать направление ценового движения, определив его силу. Решение этой проблемы помогает вовремя войти в рынок и получить хорошую прибыль. Для любого трейдера крайне важно правильно определить направление и силу трендового движения. К сожалению, единственное верное решение этой задачи отсутствует. Множество трейдеров торгуют на различных временных интервалах. По этой причине получаемые сигналы воспринимаются субъективно. Индикатор достаточ

Индикатор строит гибкие уровни поддержки и сопротивления (точками). Для построения используется особая фаза движения. Уровни формируются динамически, то есть, каждая новая свеча может продолжить уровень или завершить.
Уровень может оказывать сопротивление или поддержку цене даже там, где его уже нет. Также уровни поддержки и сопротивление могут меняться ролями.
На значимость уровней влияют: количество времени формирования уровня и количество касаний.
Важность уровней заключается в том, ч

Индикатор Effect показывает точки потенциального разворота рынка. Простое, визуальное и эффективное обнаружение тренда. Готовая торговая система. Интеллектуальный алгоритм индикатора с хорошей вероятностью определяет тренд. Использует всего один параметр для настроек. Индикатор не перерисовывается и не запаздывает. Работает на всех валютных парах и на всех таймфреймах.
Вы должны помнить, что, используя совокупность инструментов прогнозирования, желательно выбрать 2-3 индикатора для трейдинга.
MetaTrader Маркет - лучшее место для продажи торговых роботов и технических индикаторов.
Вам необходимо только написать востребованную программу для платформы MetaTrader, красиво оформить и добавить хорошее описание. Мы поможем вам опубликовать продукт в сервисе Маркет, где его могут купить миллионы пользователей MetaTrader. Так что занимайтесь только непосредственно своим делом - пишите программы для автотрейдинга.
Вы упускаете торговые возможности:
- Бесплатные приложения для трейдинга
- 8 000+ сигналов для копирования
- Экономические новости для анализа финансовых рынков
Регистрация
Вход
Если у вас нет учетной записи, зарегистрируйтесь
Для авторизации и пользования сайтом MQL5.com необходимо разрешить использование файлов Сookie.
Пожалуйста, включите в вашем браузере данную настройку, иначе вы не сможете авторизоваться.