Candlestick Patterns Finder MT4
- Indicadores
- Versão: 1.4
- Atualizado: 13 agosto 2025
- Ativações: 20
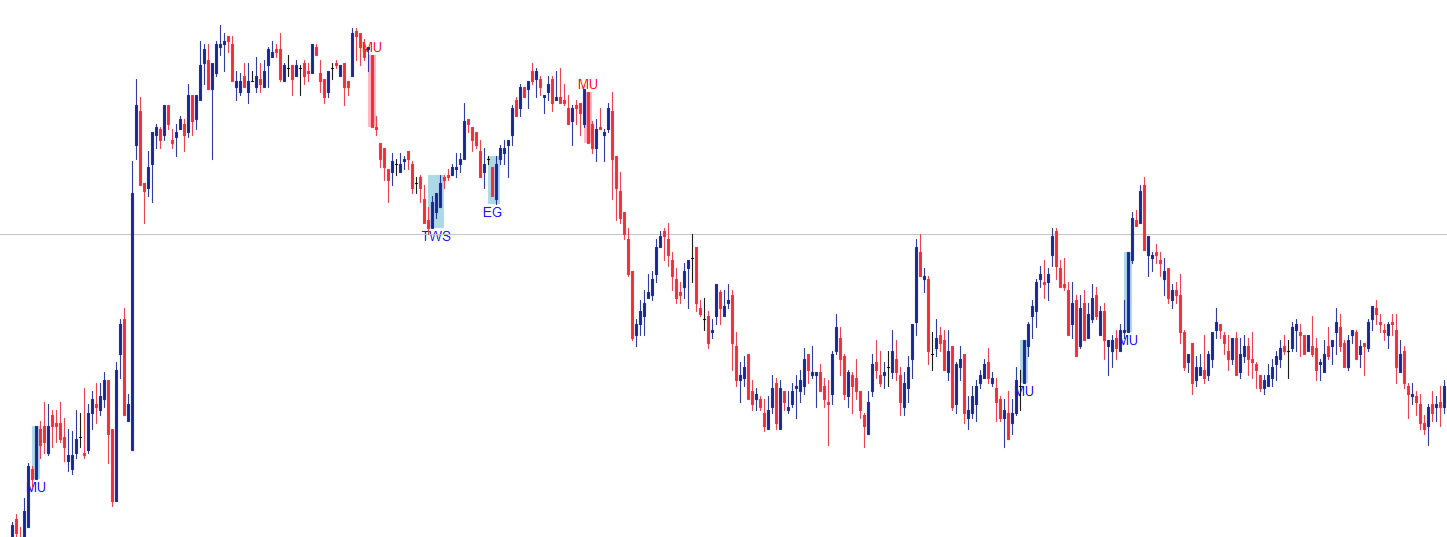
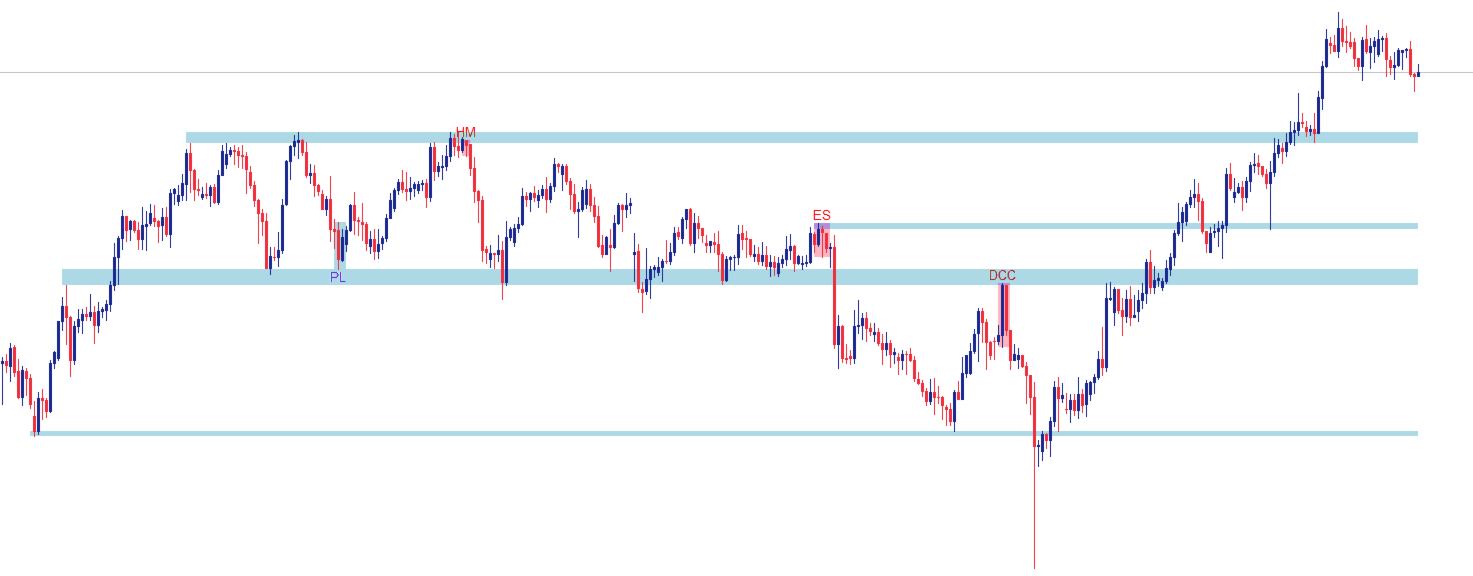
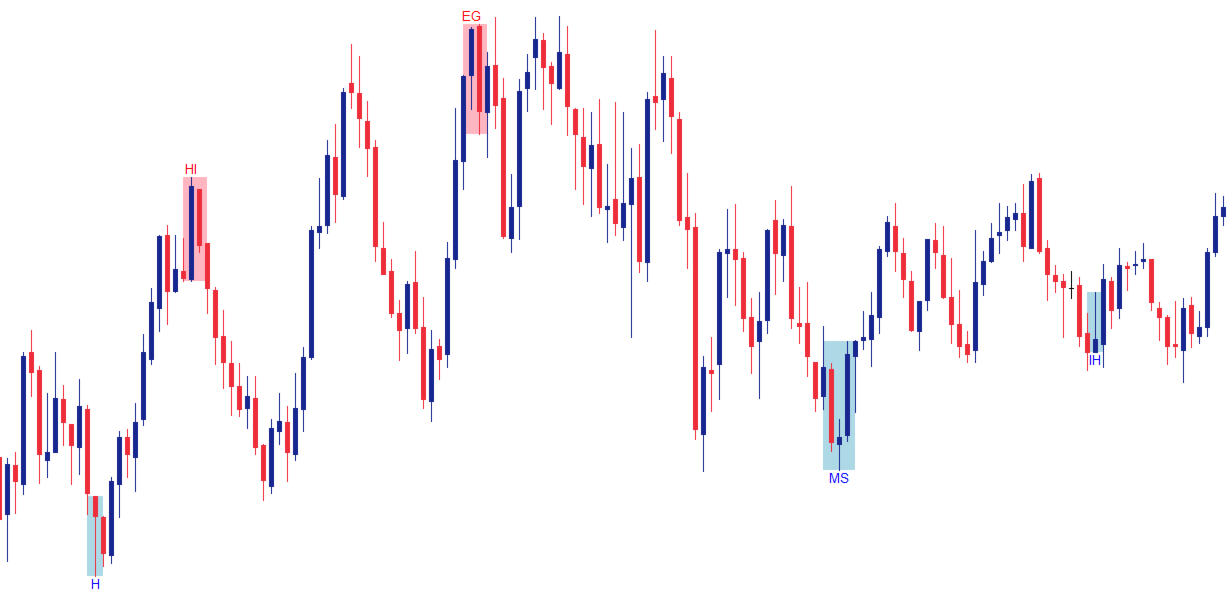
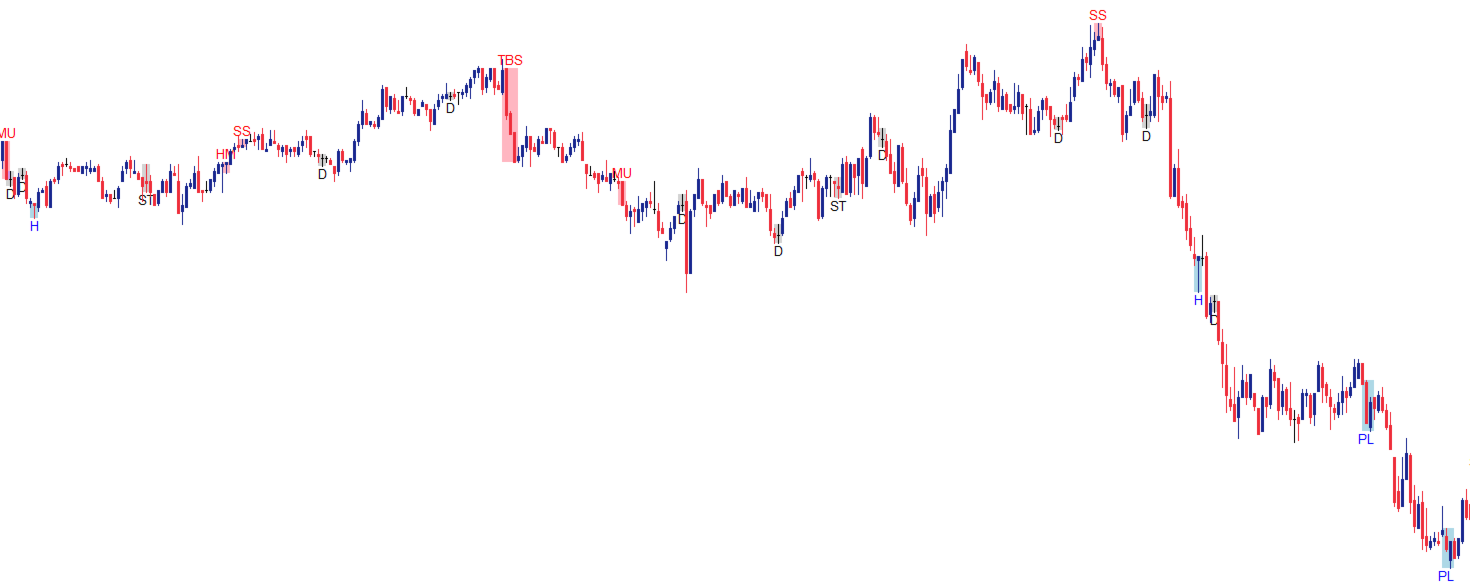
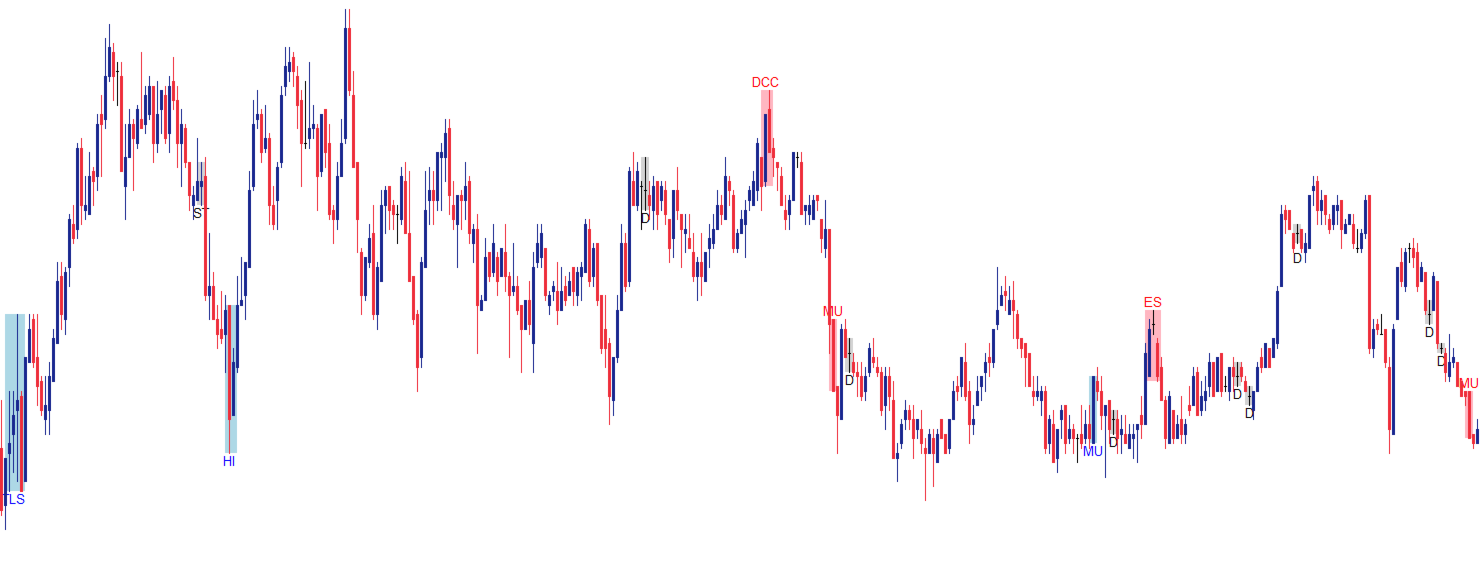
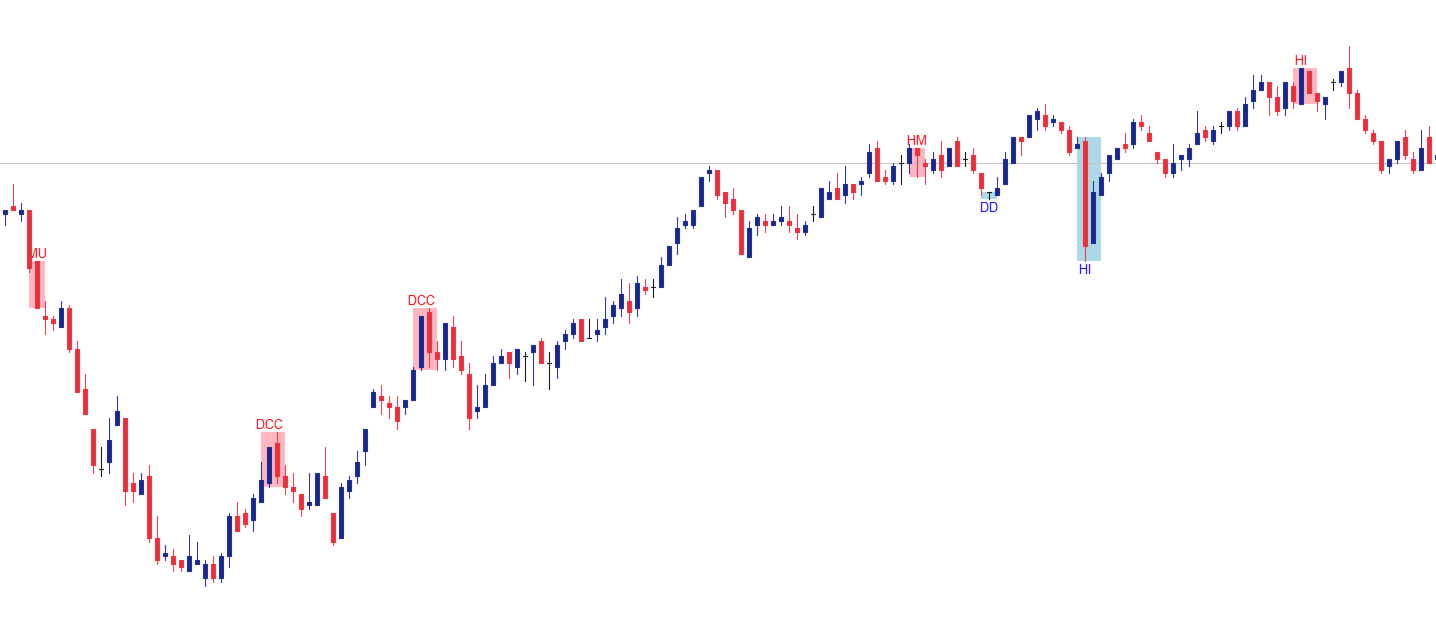
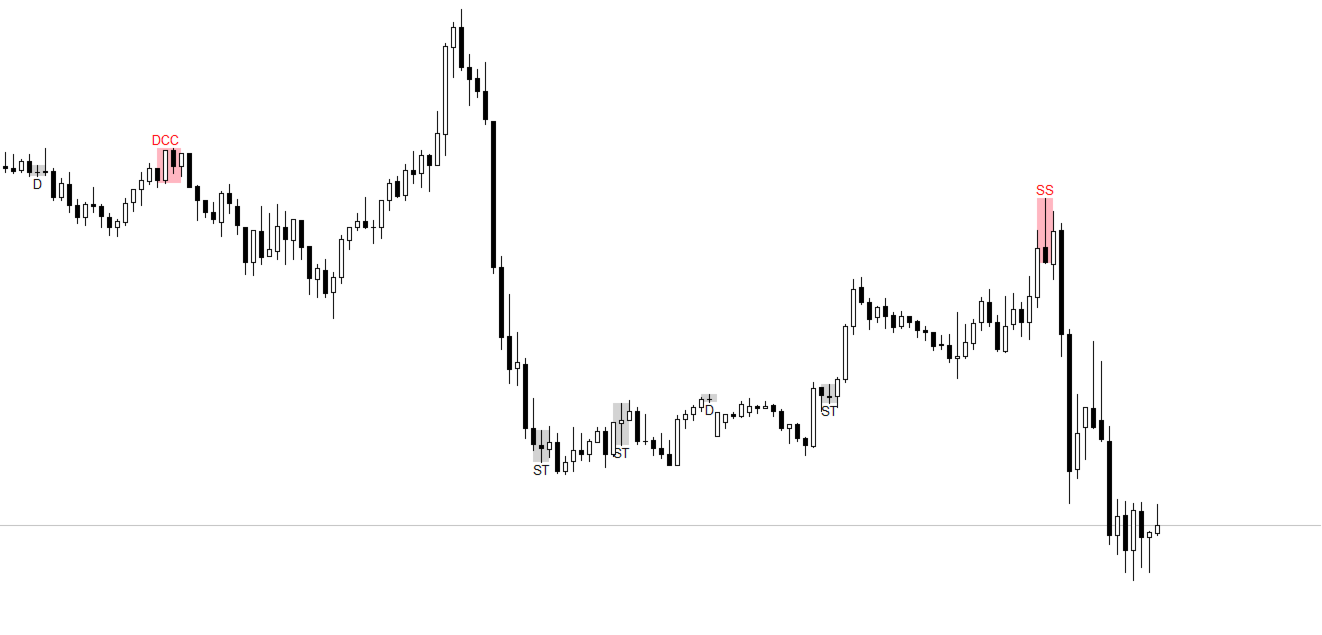
Candlestick Patterns Finder is an indicator designed to automate and simplify chart analysis.
It is perfect for both beginners who want to learn about the market and its mechanics, as well as advanced users who want to automate certain processes.
It searches for both current and past formations, additionally notifying the user about the pattern found through three available methods, e.g. alerts (great for multiple charts running).
Recognizes 24 patterns divided into bullish, bearish and neutral categories.
The indicator can run in GUI mode or in the background, but GUI mode is recommended at first to get familiar with the indicator.
If you have any questions or problems, go ahead and write to us.
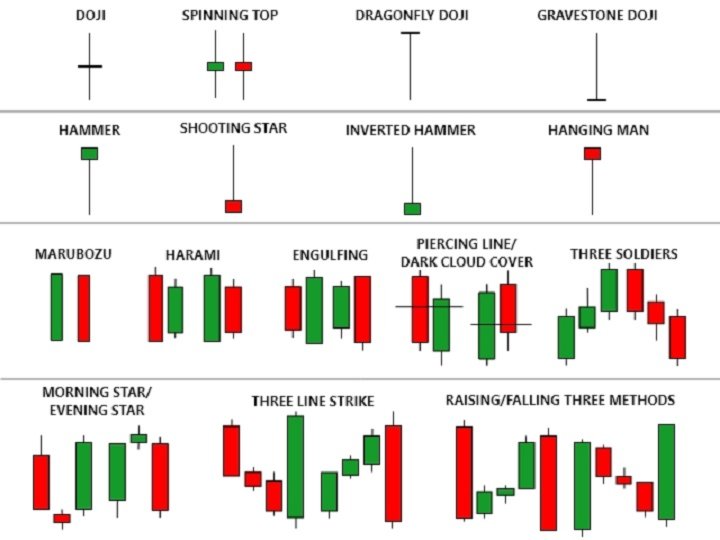
Candlestick patterns
- Doji
- Spinning top
- Dragonfly doji
- Gravestone doji
- Hammer
- Shooting star
- Inverted hammer
- Hanging man
- Marubozu bullish
- Marubozu bearish
- Engulfing bullish
- Engulfing bearish
- Harami bullish
- Harami bearish
- Piercing line
- Dark cloud cover
- Three white soldiers
- Three black soldiers
- Morning star
- Evening star
- Three line strike bullish
- Three line strike bearish
- Rising three methods
- Falling three methods