• Visão global
  • Comentários
  • Discussão

DYJ PowerSignalProfessionally

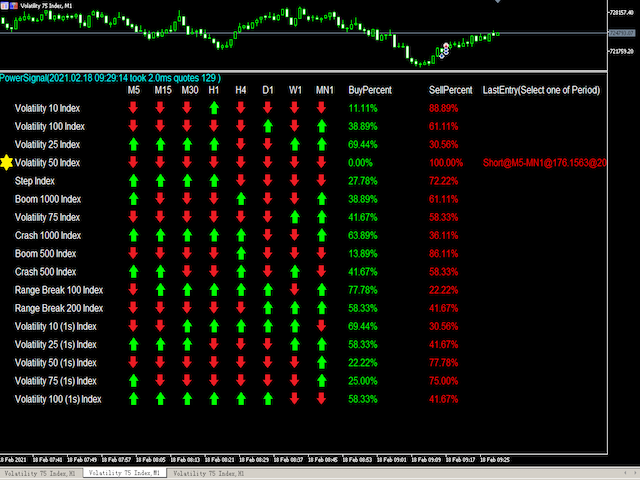
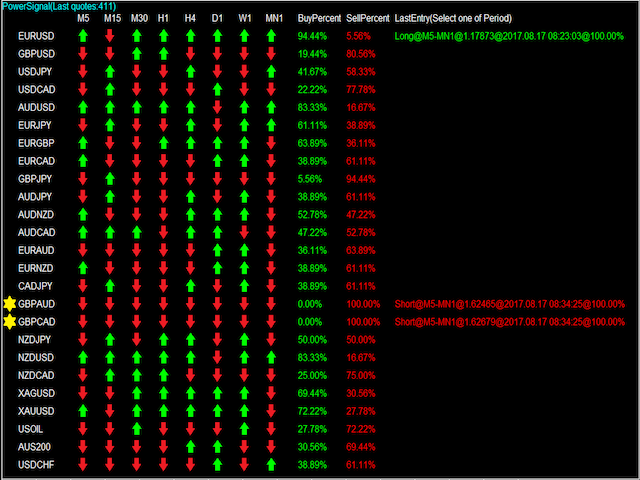
Este sinal DYJ é um sistema de transação completo baseado na especificação ATR. Esses indicadores registram o status atual de cada tendência de força em cada par de tempo e moeda analisada. Os sinais de Energia da DYJ avaliam esses dados para criar uma exibição profissional da intensidade da tendência e da lista de sinais de ponto de entrada. Se algum par corresponder exatamente, um alerta indicará essa condição. Os dados da lista incluem Symbol, M5 MN1, BuyPercent, SellPercent e LastEntry. LastEntry exibe o ponto de entrada ( período, preço, hora ). Quando a intensidade da tendência é maior que 75%, é considerada um par de moedas fortes.

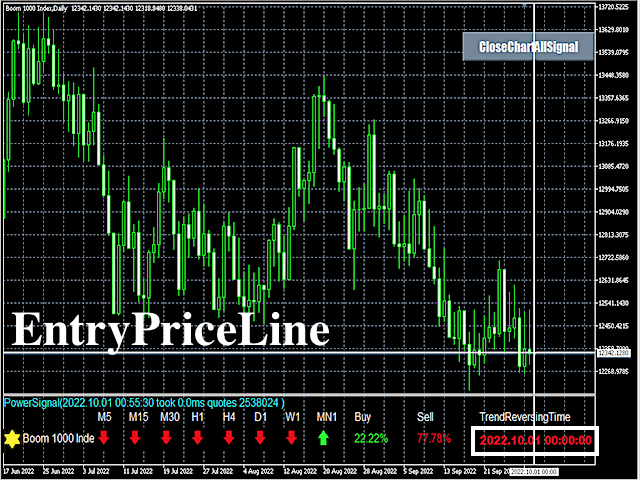
Este indicador também pode analisar a tendência de várias variedades para reverter o tempo do ponto e o melhor preço de admissão.

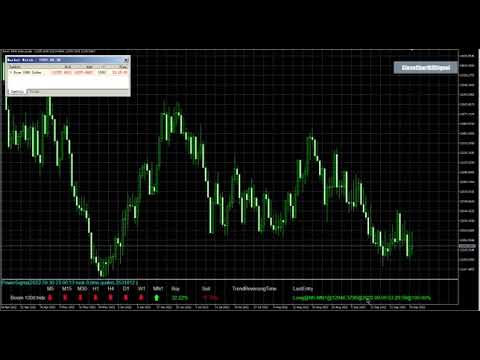
Abre automaticamente uma janela de gráfico para uma variedade de novas tendências

Mostra uma linha temporal vertical branca e uma linha horizontal branca para o preço da admissão

Inputs Value

  • Periods = 14 - indicators Periods.
  • Text color = White - Normal text color.
  • Buy Signal color = LawnGreen - Long signal color.
  • Sell signal color = OrangeRed - Short signal color.
  • AlertOnlyTrendReversing     = true --  Alert Only Trend Reversing.
  • Alert_ON = false - Disable Alarm. true - Enable Alarm: support Alert, Email, push.
  • Alert_Min_Interval = 15
  • Entry_Percent = PERCENT_100 - Trend percentage requirements PERCENT_100 or more.
  • Wait_Mins_For_Next_Signal = 30 - Wait for the next time of signal.


Author

  • Daying Cao, an experienced software engineer.


Produtos recomendados
Xtrade Trend Detector
Dago Elkana Samuel Dadie
Xtrade Trend Detector is an indicator capable of finding the best opportunities to take a position in any stock market. Indeed, it is a great tool for scalpers but also for Daytraders. You could therefore use it to identify areas to trade, it fits easily on a chart. I use it to detect trends on Big timeframes and take positions on Small timeframes. Don't hesitate to give me a feedback if you test it.
The   Pairs Cross indicator   is a unique tool for negatively correlated trading instruments, such as EURUSD and USDCHF currency pairs. It is based on a concept called pairs trading (or spread trading). Our indicator compares the strength of two currency pairs that are inversely correlated and quickly tells you when it’s time to buy the first pair and short a second pair, and vice versa. This is a straightforward approach to trading currency pairs that works very well. How to you use the Pair
This is an original, agile, and excellent trending system. Whether you are a beginner trading novice or a professional trader, this set of indicators can help you quickly and timely track the latest changes in market trends. It has the following characteristics: The method of use is extremely simple, plug and play, and the display of all trend analysis results is clear at a glance; There is no need to configure any functional parameters, the trend tracking indicator will automatically analyze th
TS Prop Firm MT5
Marzena Maria Szmit
TS Prop Firm MT5 has been prepared for Prop Trading Firms and Forex Brokers. TS Prop Firm EA is a version that support the   EURUSD, XAUUSD and US30 . There are three risk levels to choose from: Low, Medium and High. This robot is also   protected during important news , when high-impact news comes out, the robot doesn't open positions for 60 minutes before and 60 minutes after the important news. TS Prop Firm is available for MetaTrader 4 and MetaTrader 5. If you click on my profile, you can fi
O medidor de força monetária fornece um guia visual rápido para saber quais moedas estão fortes e quais são fracas. O medidor mede a força de todos os pares cruzados do forex e aplica cálculos sobre eles para determinar a força geral de cada moeda individual. Calculamos com base na força da moeda com base na tendência de 28 pares. Acessando nosso Blog MQL5, você pode baixar a versão gratuita do indicador. Experimente antes de comprar, sem as restrições do Metatrader Tester:   Clique aqui
Niubility Trend  Niubility Trend  displays the trend direction for all time frames in real time. You'll see at a glance at which direction the trends are running, how long they last and how powerful they are. All this makes it an easy-to-use trend trading system for beginners, advanced and professional traders. Features Easy to trade Customizable colors and sizes It is non-repainting and non-backpainting It is fantastic as a trailing stop method It implements alerts of all kinds
the fundamental technical indicator Informative Trend, which allows you to assess the current market situation in order to enter the market of the selected currency pair in a trend and with minimal risk. It basically uses the process of identifying the rate of change in price growth and allows you to find entry and exit points from the market. The indicator was created on the basis of the original indicators for searching for extreme points and is well suited for determining a reversal or a l
John Bollinger's normalized MFI (Fund Flow Index). Bollinger bands are used to calculate overbought/oversold areas. It takes three input parameters: MFI period - MFI calculation period MFI Applied Volume - Calculates the volume of MFI transactions BB period - Calculation period of the Bollinger band BB deviation - Brin deviation Calculation: NormMFI = (MFI-BL) / (TL-BL) Among them: TL = BBands(MFI, BB period, BB deviation, UPPER_BAND) BL = BBands(MFI, BB period, BB deviation, LOWER_BAND) MFI - M
INDICADOR baseado em INTELIGÊNCIA ARTIFICIAL que gera possíveis entradas de chamada e venda para opções binárias. o indicador funciona em 3 estratégias diferentes: 1) ao ler volumes, envia um sinal quando o preço deve reverter 2) através da divergência entre preço e volume, envia um sinal quando a tendência deve continuar ou reverter 3) através da convergência entre preço e volume, envia um sinal de quando a tendência deve continuar. o indicador funciona em todos os prazos, mas os
移動平均線クロス、ボリンジャーと移動平均線のクロス、移動平均線の角度でサイン表示 MT5インジケータ こちらに サイト があります。 このインジケータは3つのパターンでサインを表示(切り替え可能)します。 ① 移動平均線のクロス ② ボリンジャーバンドと短期移動平均線とのクロス ③ ボリンジャーバンドと短期移動平均線とのクロスと、中期移動平均線と長期移動平均線の角度 ⓸ ボリンジャーバンドと短期移動平均線とのクロス(サインを交互に表示) 移動平均線のクロス 指定した短期移動平均線と長期移動平均線のゴールデンクロスでは買いサイン、デットクロスでは売りサインを表示します。 ディフォルトでは短期は5,長期は20となっています。 もちろん変更可能になります。 移動平均線の種類をEMA(指数平滑移動平均線)やSMMA(平滑化移動平均)などに変更可能で適する価格も変更可能になります。 ボリンジャーバンドと短期移動平均線のクロス ボリンジャーバンド(以降BB)と短期移動平均線のクロスでサインを表示します。 ディフォルトではBB+1σと5MAのゴールデンクロスで買いサイン、BB-1σと5MAのデ
The indicator scans for Dinapoli thrust pattern in multiple timeframes for the all markets filtered and shows the results on Dashboard. Key Features Dashboard can be used for all markets It can scan for thrust pattern on MN1, W1, D1, H4, H1, M30, M15 ,M5, M1 timeframes Ability to choose number of bars required above/below displaced moving average to define thrust Parameters UseMarketWatch: Set true to copy all symbols available in market watch MarketWatchCount : Set the number of symbols that
Savia Forex Pro Indicator MT5
Savia Forex Software Solutions
Savia Forex Pro Indicator (MT5) The Savia Forex Solutions Forex Pro Indicator gives you highly accurate entries on all Forex/Currency pairs, Indices and Cryptocurrencies. The Forex Pro Indicator is dynamic and powerful and is optimized for all timeframes and ALL Currency pairs, Indices, Commodities, and Cryptocurrency pairs. Trade with improved confidence and maximize your success rate. Benefits Dynamic and Powerful. Forex Pro Indicator is fully optimized for all chart timeframes. Forex Pro Indi
Gapless   Moving Average  (GMA) Média móvel sem   gaps   (GMA) Versão melhorada do   indicador padrão de Média Móvel   ( Moving Average, 'MA' ) da biblioteca MetaTrader que fornece a possibilidade de eliminar os   gaps   (lacunas) entre os   candles   que distorcem os valores médios principalmente durante os N (' period ')  candles   iniciais após a abertura do mercado devido ao   spread   ('gap') entre o preço de fechamento do dia anterior e o preço de abertura do dia seguinte. Quanto maiores
FREE
O indicador ajuda a entrar em uma negociação seguindo a tendência, ao mesmo tempo, após alguma correção. Ele encontra fortes movimentos de tendência de um par de moedas em um determinado número de barras e também encontra níveis de correção para essa tendência. Se a tendência for forte o suficiente e a correção se tornar igual à especificada nos parâmetros, o indicador sinalizará isso. Você pode definir diferentes valores de correção, 38, 50 e 62 (níveis de Fibonacci) são melhores. Além disso,
Este indicador do painel de controle de zona de oferta e demanda com vários períodos e vários símbolos envia alertas quando o preço atinge uma zona de oferta / demanda. Também é possível usá-lo para ser alertado sobre topos / fundos duplos regulares em vez de zonas. Ele pode ser usado com todos os intervalos de tempo de M1 a MN.       No máximo 9 períodos de tempo podem ser mostrados no painel ao mesmo tempo.   É possível usar RSI, divergência (MACD, OsMA, RSI ou Awesome) e filtros de padrões de
1. Why did I develop this series of indicators I found that most traders need to use multiple time frame indicators. They usually switch time frame to see indicators. However, once the timeframe is switched, you cannot see the  corresponding relationship  between  the price in the smaller timeframe  and  the indicator in the larger timeframe . For example: if your price chart is in H1 timeframe, you can see H4, D1 and W1 indicators in H1 timeframe Chart. This is more helpful for you to find t
Fibrillar
Vitalii Zakharuk
It is very easy to use the Fibrillar indicator, since the simplest is to look at the chart and act according to the indications of the colored arrows. The algorithm takes into account the measurement of prices, and this method also focuses on measuring each of the price drops (H / C, H / O, LC, LO) - which gives more detailed information, but also more averaged. When calculating this indicator, logarithmic gains are first calculated at the closing price, which allows you to filter out the tre
It's a multi-symbol and multi-timeframe scanner for our indicator - ACB Breakout Arrows . With default settings, it scans for the buy/sell signals on 28 currency pairs and 9 time-frames concurrently.   Features It can scan 252* combinations of symbols and time-frames from a single chart. Open the signal's chart loaded with a predefined template with a single click.  Easy drag n drop anywhere on the chart. Real-time alerts with popup, sound, push-notifications and email alerts.  Input Para
This EA includes 11 SmartForexExpert EAs. These EAs belong to 3 different area types, momentum, reversal, trend. Using all EAs we can diversify risk and trade better and take advantage of different market behaviors where specific type of EA works better than others. Version 3.0 on MT5 include SFE Crypto Master! A big effort has made to include the different EAs in 1 mt5 file, and keeping the low demand of the computer resources. The EA runs very smoothly and only take care of his own trades,
Descriptions A point point is a technical analysis indicator, or calculations, used to determine the overall trend of market over different time frames. This indicator calculate the highest or lowest pivots among left x and right y bars and show the high/low level during that period.   From that, you could clearly see the top resistance & bottom support level and how market goes break out. Instructions pivotLeft - pivot left bar count pivotRight - pivot right bar count pivotHighColor - c
ESTE INDICADOR, BASEADO EM INTELIGÊNCIA ARTIFICIAL, identifica possíveis pontos de reversão do mercado através da leitura da pegada e sinaliza ANTECIPADAMENTE pequenos movimentos de mercado antes que eles ocorram. Ao contrário dos indicadores de preço e volume, que geram entradas “tardias”, ou seja, quando já ocorreu uma confirmação de preço ou volume sobre uma mudança de direção e, portanto, muitas vezes o movimento já terminou, este indicador sinaliza, com base no que lê no pegada, “QUANDO O
The Trap Play MT5
Carl Gustav Johan Ekstrom
Trap Play  refers to a market situation where price initially makes a new high or low, luring traders into believing a strong trend is forming. However, the price quickly reverses and invalidates the breakout, trapping those traders who entered positions based on the initial move. This sudden reversal often results in a rapid exit of positions, leading to significant price movement in the opposite direction.  Trap plays  can occur in various financial markets and timeframes and are characterized
Hrum
Yvan Musatov
The Hrum indicator was created to neutralize temporary pauses and rollbacks. It analyzes price behavior and, if there is a temporary weakness in the trend, you can notice this from the indicator readings, as in the case of a pronounced change in trend direction. Entering the market is not difficult, but staying in it is much more difficult. With the Giordano Bruno indicator and its unique trend line, staying on trend will become much easier! Every rise and every fall is reflected in your emot
Signal Eskiya, in addition to channel lines, reflects entry signals in the form of arrows. Trading strategies using the channel indicator belong to the classic methods of technical analysis, are easy to execute, and therefore available even to beginners. Price ranges work equally well on any trading assets and timeframes, they can be used both independently and with additional confirmation from oscillators and market volumes. American traders say: “Trend is your friend”, which means “Trend is
This MT5 indicator has been designed to be used on any currency pair or indices and on the daily time frame or higher . The indicator looks for medium-term high-probability continuations in price and will indicate you to go long (buy) or short (sell) if you see a green or red arrow next to the current candlestick respectively. The indicator paints an arrow when the specific criteria are met, however, you must wait until the current candlestick has closed until you enter a trade . Therefore you w
The indicator scans for TD Combo signals in multiple timeframes for the all markets filtered and shows the results on Dashboard. Key Features Dashboard can be used for all markets It can scan for signals on MN1, W1, D1, H4, H1, M30, M15 ,M5, M1 timeframes Parameters UseMarketWatch: Set true to copy all symbols available in market watch MarketWatchCount : Set the number of symbols that you want to copy from the market watch list. CustomSymbols: Enter the custom symbols that you want to be availa
- This is an implementation of OCC ==> open close cross - This indicator applies twelve different averaging methods to open and close prices separately to signal the trend switching. - All MA methods are set as input as well as period and different offsets applied to linear regression and ALMA averaging. - Buffers 16 and 17 can be used in EAs to detect trend direction. - You can message in private chat for further changes you need.
Glider
Vitalii Zakharuk
The Glider indicator gives accurate and timely signals to enter and exit the transaction that appear on the current candle. Using the indicator is very simple. When a dot and a blue line appear, open a buy deal. When a dot and a red line appear, open a sell deal. The main purpose of this indicator is to determine the moments of entry and exit from transactions, therefore the Glider indicator will display only the trend line and entry points, i.e. displays displays the entry points to the mark
Apresentamos o revolucionário indicador MT5, Traffic Signal - seu portal definitivo para o mundo do trading bem-sucedido! Projetado com precisão e expertise, o Traffic Signal opera com uma estratégia especial que aproveita o poder de indicadores técnicos avançados - RSI, Stochastics, CCI e Tendências - em todos os intervalos de tempo. Prepare-se para uma experiência de trading extraordinária, pois este indicador de última geração oferece os sinais mais precisos para entrada, permitindo que você
The intelligent algorithm of the Godfather indicator accurately determines the trend, filters out market noise and generates entry and exit levels. The indicator will help in finding entry points when analyzing the price chart. The program first receives a "snapshot" of the graph, then analyzes it. The results are reported to the trader in the form of signals. The main purpose of this indicator is to determine the moments of entries and exits from transactions, so the indicator displays only th
Os compradores deste produto também adquirem
Primeiramente, vale ressaltar que este Sistema de Trading é um Indicador Não Repintado, Não Redesenho e Não Atrasado, o que o torna ideal tanto para o trading manual quanto para o automatizado. O "Sistema de Trading Inteligente MT5" é uma solução completa de trading projetada para traders novos e experientes. Ele combina mais de 10 indicadores premium e apresenta mais de 7 estratégias de trading robustas, tornando-o uma escolha versátil para diversas condições de mercado. Estratégia de Seguime
Atomic Analyst MT5
Issam Kassas
4.82 (11)
Primeiramente, vale ressaltar que este Indicador de Negociação não repinta, não redesenha e não apresenta atrasos, tornando-o ideal tanto para negociação manual quanto automatizada. O Analista Atômico é um Indicador de Ação de Preço PA que utiliza a força e o momentum do preço para encontrar uma vantagem melhor no mercado. Equipado com filtros avançados que ajudam a remover ruídos e sinais falsos, e aumentam o potencial de negociação. Utilizando múltiplas camadas de indicadores complexos, o A
FX Volume MT5
Daniel Stein
4.94 (17)
Receba a sua atualização diária do mercado com detalhes e screenshots através do nosso Morning Briefing aqui no mql5 e no Telegram ! O Volume FX é o PRIMEIRO e ÚNICO indicador de volume que fornece uma visão REAL do sentimento do mercado do ponto de vista de um corretor. Ele fornece uma visão incrível de como os participantes do mercado institucional, como corretores, estão posicionados no mercado Forex, muito mais rápido do que os relatórios COT. Ver essas informações diretamente no seu gráfi
Quantum Trend Sniper
Bogdan Ion Puscasu
5 (37)
Apresentando       Quantum Trend Sniper Indicator   , o inovador Indicador MQL5 que está transformando a maneira como você identifica e negocia as reversões de tendência! Desenvolvido por uma equipe de traders experientes com experiência comercial de mais de 13 anos,       Indicador de Atirador de Tendência Quântica       foi projetado para impulsionar sua jornada de negociação a novos patamares com sua forma inovadora de identificar reversões de tendência com precisão extremamente alta. ***C
Este é um indicador para MT5 que fornece sinais precisos para entrar em uma negociação sem redesenhar. Ele pode ser aplicado a qualquer ativo financeiro: forex, criptomoedas, metais, ações, índices. Ele fornecerá estimativas bastante precisas e informará quando é melhor abrir e fechar um negócio. Assista o vídeo (6:22) com um exemplo de processamento de apenas um sinal que compensou o indicador! A maioria dos traders melhora seus resultados de negociação durante a primeira semana de negociação c
FX Power MT5 NG
Daniel Stein
5 (4)
Receba a sua atualização diária do mercado com detalhes e screenshots através do nosso Morning Briefing aqui no mql5 e no Telegram ! O FX Power MT5 NG é a próxima geração do nosso medidor de força de moeda muito popular de longa data, o FX Power. E o que é que este medidor de força da próxima geração oferece? Tudo o que adorou no FX Power original MAIS Análise de força GOLD/XAU Resultados de cálculo ainda mais precisos Períodos de análise configuráveis individualmente Limite de cálculo personal
RelicusRoad Pro MT5
Relicus LLC
4.82 (22)
Agora US $ 147 (aumentando para US $ 499 após algumas atualizações) - Contas ilimitadas (PCs ou Macs) Manual do usuário do RelicusRoad + vídeos de treinamento + acesso ao grupo de discórdia privado + status VIP UMA NOVA FORMA DE OLHAR PARA O MERCADO O RelicusRoad é o indicador de negociação mais poderoso do mundo para forex, futuros, criptomoedas, ações e índices, oferecendo aos traders todas as informações e ferramentas necessárias para se manterem rentáveis. Fornecemos análises técnica
XQ Indicator MetaTrader 5
Marzena Maria Szmit
5 (1)
Step into the realm of Forex trading with confidence and precision using XQ, a cutting-edge Forex indicator designed to elevate your trading game to unprecedented heights. Whether you're a seasoned trader or just stepping into the world of currency exchange, XQ Forex Indicator empowers you with the insights and signals needed to make informed trading decisions. The signal conditions are a combination of three indicators, and XQ Forex Indicator only display  medium and long-term trends . The ind
Blahtech Supply Demand MT5
Blahtech Limited
4.57 (14)
Was: $299  Now: $99   Supply Demand uses previous price action to identify potential imbalances between buyers and sellers. The key is to identify the better odds zones, not just the untouched ones. Blahtech Supply Demand indicator delivers functionality previously unavailable on any trading platform. This 4-in-1 indicator not only highlights the higher probability zones using a multi-criteria strength engine, but also combines it with multi-timeframe trend analysis, previously confirmed swings
Advanced Supply Demand MT5
Bernhard Schweigert
4.53 (15)
Atualmente com 33% de desconto! A melhor solução para qualquer Trader Novato ou especialista! Este indicador é uma ferramenta de negociação exclusiva, de alta qualidade e acessível porque incorporamos uma série de recursos proprietários e uma nova fórmula. Com esta atualização, você poderá mostrar fusos horários duplos. Você não só será capaz de mostrar um TF mais alto, mas também mostrar ambos, o TF do gráfico, MAIS o TF mais alto: MOSTRANDO ZONAS ANINHADAS. Todos os traders de Oferta e Demanda
O Indicador de Quadrados de Gann é uma poderosa ferramenta de análise de mercado baseada no artigo "Fórmula Matemática para Previsões de Mercado" escrito por W.D. Gann, que se baseia em conceitos matemáticos para análise. Ele incorpora elementos das técnicas de Gann relacionadas com os quadrados de 144, 90 e 52, bem como o quadrado de 9. Além disso, inclui o método do  sobre como combinar o quadrado de 9 com canais e padrões de estrela. Manual do Usuário e Modo de Uso: Antes de usar este indicad
The Volume by Price Indicator for MetaTrader 5 features Volume Profile and Market Profile TPO (Time Price Opportunity). Get valuable insights out of currencies, equities and commodities data. Gain an edge trading financial markets. Volume and TPO histogram bar and line charts. Volume Footprint charts. TPO letter and block marker charts including split structures. Versatile segmentation and compositing methods. Static, dynamic and flexible ranges with relative and/or absolute visualizations. Lay
Apresentando       Quantum Breakout PRO   , o inovador Indicador MQL5 que está transformando a maneira como você negocia Breakout Zones! Desenvolvido por uma equipe de traders experientes com experiência comercial de mais de 13 anos,       Quantum Breakout PRO       foi projetado para impulsionar sua jornada comercial a novos patamares com sua estratégia de zona de fuga inovadora e dinâmica. O Quantum Breakout Indicator lhe dará setas de sinal em zonas de breakout com 5 zonas-alvo de lucro e
Owl Smart Levels MT5
Sergey Ermolov
4.47 (36)
Versão MT4  |  FAQ O Indicador Owl Smart Levels é um sistema de negociação completo dentro de um indicador que inclui ferramentas populares de análise de mercado, como fractais avançados de Bill Williams , Valable ZigZag que constrói a estrutura de onda correta do mercado e níveis de Fibonacci que marcam os níveis exatos de entrada no mercado e lugares para obter lucros. Descrição detalhada da estratégia Instruções para trabalhar com o indicador Consultor de negociação Owl Helper Chat privado d
Gartley Hunter Multi
Siarhei Vashchylka
5 (5)
Gartley Hunter Multi - An indicator for searching for harmonic patterns simultaneously on dozens of trading instruments and on all classic timeframes: (m1, m5, m15, m30, H1, H4, D1, Wk, Mn). Manual (Be sure to read before purchasing) | Version for MT4 Advantages 1. Patterns: Gartley, Butterfly, Shark, Crab. Bat, Alternate Bat, Deep Crab, Cypher 2. Simultaneous search for patterns on dozens of trading instruments and on all classic timeframes 3. Search for patterns of all possible sizes. Fr
MetaBands M5
Vahidreza Heidar Gholami
4.67 (3)
MetaBands utiliza algoritmos poderosos e únicos para desenhar canais e detectar tendências, a fim de fornecer aos traders pontos potenciais para entrar e sair de negociações. É um indicador de canal mais um indicador de tendência poderoso. Inclui diferentes tipos de canais que podem ser mesclados para criar novos canais simplesmente usando os parâmetros de entrada. O MetaBands usa todos os tipos de alertas para notificar os usuários sobre eventos de mercado. Recursos Suporta a maioria dos algori
TPSpro TRENDPRO  - is a trend indicator that automatically analyzes the market and provides information about the trend and each of its changes, as well as giving signals for entering trades without redrawing! The indicator uses each candle, analyzing them separately. referring to different impulses - up or down impulse. Exact entry points into transactions for currencies, crypto, metals, stocks, indices!  -  Version MT4                  DETAILED DESCRIPTION        /       TRADING SETUPS       
Was: $249  Now: $99   Market Profile defines a number of day types that can help the trader to determine market behaviour. A key feature is the Value Area, representing the range of price action where 70% of trading took place. Understanding the Value Area can give traders valuable insight into market direction and establish the higher odds trade. It is an excellent addition to any system you may be using. Inspired by Jim Dalton’s book “Mind Over Markets”, this indicator is designed to suit the
Golden Spikes Detector
Batsirayi L Marango
5 (1)
Golden Spikes Detector Este indicador é baseado em uma estratégia avançada principalmente para picos de negociação nos índices Boom e Crash. Algoritmos complexos foram implementados para detectar apenas entradas de alta probabilidade. Ele alerta sobre possíveis entradas de compra e venda. Para negociar picos na corretora Deriv ou Binária, receba apenas os alertas Buy Boom e Sell Cash. Ele foi otimizado para ser carregado em um período de 5 minutos, embora a análise de vários períodos de tempo se
Golden Gate Algo MT5
James David Lane
4 (6)
40% DE DESCONTO PARA O NATAL! AUMENTO DE PREÇO PARA $250 EM 1º DE JANEIRO! Apresentando GoldenGate Entries: Uma Solução de Negociação de Ponta! Descubra uma abordagem revolucionária para a negociação com o GoldenGate Entries (GGE), um indicador avançado projetado para elevar sua experiência de negociação. O GGE oferece um conjunto abrangente de recursos para capacitar os usuários com precisão e confiança em suas decisões de negociação. Pares: Qualquer (FX - Commodities - Equities - Ações
Bill Williams Advanced
Siarhei Vashchylka
5 (3)
Bill Williams Advanced is designed for automatic chart analysis using Bill Williams' "Profitunity" system. The indicator analyzes four timeframes at once. Manual (Be sure to read before purchasing) Advantages 1. Automatically analyzes the chart using the "Profitunity" system of Bill Williams. The found signals are placed in a table in the corner of the screen. 2. Equipped with a trend filter based on the Alligator indicator. Most of the system signals are recommended to be used only accordi
TrendMaestro5
Stefano Frisetti
note: this indicator is for METATRADER4, if you want the version for METATRADER5 this is the link:  https://www.mql5.com/it/market/product/108106 TRENDMAESTRO recognizes a new TREND in the bud, he never makes mistakes. The certainty of identifying a new TREND is priceless. DESCRIPTION TRENDMAESTRO identifies a new TREND in the bud, this indicator examines the volatility, volumes and momentum to identify the moment in which there is an explosion of one or more of these data and therefore the mome
TPA True Price Action indicator reveals the true price action of the market makers through 100% non-repainting signals strictly at the close of a candle! TPA shows entries and re-entries, every time the bulls are definitely stronger than the bears and vice versa. Not to confuse with red/green candles. The shift of power gets confirmed at the earliest stage and is ONE exit strategy of several. There are available now two free parts of the TPA User Guide for our customers. The first "The Basics"
Trade Assistant MetaTrader System  — a multi-timeframe system that is based on three standard indicators:   Stochastic oscillator ,   RSI   (Relative Strength Index), and   CCI   (Commodity Channel Index). It displays current trend directions for M1, M5, M15, M30, H1, H4, D1, W1, and MN1 timeframes. When you follow such an indicator you have a clear picture of the trends across all important timeframes. It doesn't matter which timeframe you attach this indicator to. Input parameters CheckCandl
Professional Scalping Tool on Deriv Attention! The indicator will be sold in limited quantities!!! Description: This trading indicator is designed for professional traders focused on scalping. Designed with the market in mind, it provides highly accurate spike trading signals. It works on the M1 timeframe and supports the following symbols: Boom 300 Index, Boom 500 Index, Boom 1000 Index, Crash 300 Index, Crash 500 Index, Crash 1000 Index. Functional Features: - Direction: - Trading is ca
A key element in trading is zones or levels from which decisions to buy or sell a trading instrument are made. Despite attempts by major players to conceal their presence in the market, they inevitably leave traces. Our task was to learn how to identify these traces and interpret them correctly. Reversal First Impulse levels (RFI)   -  Version MT4                  INSTRUCTIONS                 RUS                 ENG                         R ecommended to use with an indicator   -  TREND PRO  
Quantum Heiken Ashi PRO MT5
Bogdan Ion Puscasu
4.5 (8)
Apresentando o   Quantum Heiken Ashi PRO Projetadas para fornecer informações claras sobre as tendências do mercado, as velas Heiken Ashi são conhecidas por sua capacidade de filtrar o ruído e eliminar sinais falsos. Diga adeus às confusas flutuações de preços e olá para uma representação gráfica mais suave e confiável. O que torna o Quantum Heiken Ashi PRO verdadeiramente único é sua fórmula inovadora, que transforma os dados tradicionais de velas em barras coloridas fáceis de ler. As barras ve
Gartley Hunter MT5
Siarhei Vashchylka
5 (13)
Gartley Hunter - An indicator for searching for harmonic patterns (Gartley patterns) and their projections. The indicator is equipped with a system of alerts and push notifications. Manual (Be sure to read before purchasing) | Version for MT4 Advantages 1. 12 harmonic patterns: 7 classical and 5 exotic. New patterns will be added as the indicator develops. 2. Constant automatic search for harmonic patterns. The indicator is capable of finding from the smallest to the largest patterns. 3. Autom
Anchored VWAP with Alert MT5
Trade The Volume Waves Single Member P.C.
What is the Volume Weighted Average Price (VWAP)? The volume weighted average price (VWAP) is a trading benchmark used by traders that gives the average price an instrument has traded at throughout the day, based on both volume and price.  It is important because it provides traders with insight into both the trend and value of the instrument. What is the Difference between VWAP and AVWAP? While VWAP is having as starting point the beggining of the day,week,month etc. in the AVWAP you can p
VTrende Pro
Andrii Diachenko
5 (1)
VTrende Pro - MTF indicator for trend trading with a display panel for MT5 *** Videos can be translated into any language using subtitles (video language - Russian) Although the signals of the VTrende Pro indicator can be used as signals of a full-fledged trading system, it is recommended to use them in conjunction with the Bill Williams TS. VTrende Pro is an extended version of the VTrende indicator. Difference between Pro version and VTrende: - Time zones - Signal V - signal 1-2 waves
Mais do autor
DYJ CashRegisterEA trabalha em indicadores técnicos DYJ. Quando o mercado é forte , esta EA encontra a oportunidade e comércio no mercado seguro. Ganho consistente com tempo seguro de negociação. A EA usa um modo de ordem para minimizar o volume de transação e maximizar a estratégia do algoritmo de fechamento de lucros. Nada de troca de rede. Sem arbitragem. Sem Hedge. Nada de Martingale. Please download the setting file and the PDF file of the back test report in the product comment area
StrongCurrency
Daying Cao
5 (1)
This StrongCurrency is a complete trading system based on a variety of technical indicators, moving averages and pivots. Each of those elements can be assessed in defined rules and coefficients (depending on the indicator) providing limitless optimization scenarios for the StrongCurrency. In order to work the StrongCurrency creates a trend strength and entry point signal list display by evaluating these data, that takes data from all symbols. It extrapolates all the information in order to get t
DYJ Follow Me   is an EA that follows the virtual transaction record of any dyj indicator to actually open and close positions. It can display the name and status of the indicator of the single signal source; At present, it is only the   DYJ SignalSourceOfWPR MT5   indicator, and more indicators will be expanded in the future. It can receive real-time trend direction of indicator. It can receive the latest admission time of the indicator. It can receive the latest admission price of
O plano de retirada da DYJ é um sistema de negociação de mudança de tendência que abre e fecha posições em pontos de virada de tendência. Qualquer símbolo aplicável a qualquer corretora: câmbio ou qualquer outra variedade ( Por exemplo, o Volatility Index de uma corretora ) Ele mostra TP, SL básico, espaçamento de grade e margem para lucro TPSL com volume de transação mínimo e mostra o lucro por variedade quando aberto, com rastreamento automático do lucro - alvo para cada variedade e rastrea
The  DYJ WPR - SignalSource is based on  WPR  indicator. It can be used for any currency pair and timeframe. The  WPR  recommends  Indicator values ranging between 80 and 100% indicate that the market is oversold. Indicator values ranging between 0 and 20% indicate that the market is overbought. The entry signal of this indicator is a turning point in the trend. The indicator uses analog trading technology, Provide you with indicators to evaluate the overall profit of the opening signal and c
This QuickClose help you to close all orders having profit immediately with only ONE CLICK, its work is very fast. You can choose which symbol you want or close all symbols so it will helpful for you in your trading to manage trading faster. This EA can quick close all Buy and Sell Orders by a selected symbol or total. This SymbolButton is designed for closing orders. There is available Manual and Automatic closing functions. Automatic closing function will close the orders according the paramet
Professional traders know that a reversal in market price is the best entry points to trade. The trend changes K line state changes the most obvious. The SoarSignal is good to identify these changes, because we have incorporated the KDJ indicators. It is the closest to the K line state of the indicators. The two lines of KDJ Winner move within a range of 0 and 100. Values above 80 are considered to be in overbought territory and indicate that a reversal in price is possible. Values below 20 are
PowerSignal
Daying Cao
5 (1)
Este PowerSignal é um sistema de negociação completo baseado em ATR de indicadores técnicos. Esses indicadores registrarão o status atual de cada POWERTREND em cada período de tempo e par de moedas analisado. O PowerSignal cria uma exibição de lista de sinal de ponto de entrada e força de tendência avaliando esses dados. Se houver uma coincidência total em qualquer par, um alerta aparecerá indicando tal caso. Os dados da lista incluem Symbol, M5-MN1, BuyPercent, SellPercent, LastEntry. O LastEn
This indicator shows the crossing between two moving averages, a slower and faster moving average. Signal show alert pop-up, when MA1 crosses above the MA2. Signal show alert pop-up, when MA1 crosses below the MA2. Inputs Value Fast MA Setup Period = 5 - period of Faster Moving Average (value 5). Mode = SMA - type of Moving Average (SMA, EMA, SMMA, LWMA). Price = Close - type of price (Close, Open, Low, High, Median, Typical, Weighted). Slow MA Setup Period = 10 - period of Slower MA (value 10
This EA is based on the classical trend-following system of opening the positions. The EA is based on DYJ TwoMACrossAlarm and ATR and CCI indicator. It uses two moving averages. The EA uses dynamic allocation MA period. The MA1 and MA2 period is the Fibonacci sequence, such as 5.8 or 13.21 or 21.34 or...; EA Entry Rules: Go long when fast MA1 crosses above the slow MA2 and CCI crosses above the zero line; Go short when fast MA1 crosses below the slow MA2 and CCI crosses below the zero line; the
A DYJ news exchange factory é um indicador básico de análise de Mercado de ferramentas de negociação de calendário e eventos macroeconômicos. Aqui você pode encontrar notícias financeiras e indicadores para a maior economia do mundo - dos estados unidos e da união européia à austrália e ao japão, há nove economias envolvidas em mais de 60 pares de moedas. Coleta mais de 800 indicadores macroeconômicos e eventos de fontes públicas em tempo real. Cada métrica tem valores históricos, atuais e pr
This indicator shows the crossing between three moving averages (slower, middle and faster ones). When fast MA crosses up middle MA and middle MA crosses up slow MA, the bullish alert is issued. When fast MA crosses down middle MA and middle MA crosses down slow MA, the bearish alert is issued. Signals to close buy positions are generated if fast MA crosses middle MA downwards, signals to close sell positions are generated if fast MA crosses middle MA upwards. Inputs Fast MA Setup MAPeriod1 =
The Expert Advisor is based on three Moving Average indicators. ThreeMACross is based on the following idea: crossing of three Moving Average lines (Fast, Middle and slow ones) is used as a signal for opening and closing a position together. Go Long when Fast MA (MA1) crosses above Middle MA (MA2), and Middle MA (MA2) crosses above Slow MA (MA3). Go Short when Fast MA (MA1) crosses below Middle MA (MA2), and Middle MA (MA2) crosses below Slow MA (MA3). Signals to close buy positions are generate
The RiseTrading is a unique High quality and easy to use and affordable trading tool because we have incorporated a number of proprietary features and PowerSignal and MACD and Stochastic indicators. The main advantages of the trend trading strategy used by the Expert Advisor are opening positions only in the direction of a trend, ability for the long-term retention of profitable positions allowing users to achieve good combinations of profit/loss distributions. That can work on a real account at
O DYJ stock controller é um sistema de negociação de ações de moeda completa Ele pode exibir valores aleatórios para cada par de moedas de M1 a MN Quando o valor de Stoch de um período atinge a área de hipermercado e a área de hipermercado, há dicas de cores. Você pode fazer a transação correta com base nessa informação Crie e salve um modelo de métrica de inventário chamado dyn inventory control. Quando você clica com o mouse em uma área de hiper - compras ou hiper - compras, o mapa do par d
The DYJ SoarTrading is based on SoarSignal indicator. It can be used for any currency pair and timeframe. Signals to buy are generated when SoarSignal has crossed oversold downwards, reached oversold and then crossed back up through oversold. Signals to sell are generated when SoarSignal has crossed overbought upwards, reached overbought, and then crossed back down through overbought. Close a trade when SoarSignal reaches the opposite side ( overbought for long order, oversold for short order).
DYJ Sharp advanced algorithm that detects new trends and current trend continuations for use as an entry and exit strategy. The strategy display the SHARP trend demarcation area. This SHARP area has high HighLine and low LowLine. Falling of high below HighLine of SHARP and then falling of close below LowLine of SHARP can be interpreted as a signal to sell. Rising of close above HighLine of SHARP and then rising of low above LowLine of SHARP can be interpreted as a signal to buy. The signal for e
DYJ TRENDWAVE features an advanced algorithm that detects new trends and current trend continuations for use as an entry strategy. DYJ TRENDWAVE's volatility is based on the power of buyers and sellers, it grabs total body size of candles and identifies the battle between buyers and sellers as a percentage of the total volume, like Sellers: (-)100% and Buyers: (+)100%. This information can be used for any entry and exit strategy. For bullish/Long Pin bar it is below the price line, for bearish/S
DYJTRENDWAVE features an advanced algorithm that detects new trends and current trend continuations for use as an entry strategy. DYJTRENDWAVE's volatility is based on the power of buyers and sellers, it grabs total body size of candles and identifies the battle between buyers and sellers as a percentage of the total volume, like Sellers: (-)100% and Buyers: (+)100%. This information can be used for any entry and exit strategy. For bullish/Long Pin bar it is below the price line, for bearish/Sho
DYJ Scalping é um Expert Advisor totalmente automatizado. O filtro indicador estocástico é usado para entradas. O consultor precisa de um tipo de conta de cobertura e ECN. A perda da ordem é resgatada pelo jogo e se torna um lucro. Se a direção da ordem estiver errada. Você pode desativar a estratégia do jogo a qualquer momento. Recomendações Gerais Recomendar contas ECN, xauusd spreads entre 8 e 11 ou menos, EURUSD spreads 1 O depósito mínimo é de 200 dólares. Please download the xauusd and EU
O DYJ T3ModeMA é baseado no algoritmo T3. O algoritmo T3 foi introduzido no campo da análise técnica no artigo “Better Moving Averages”, publicado na revista americana TASC. Isso suaviza as séries de preços e, ao mesmo tempo, reduz o atraso típico dos sistemas de rastreamento de tendências. O tamanho da coluna do indicador determina o sinal de entrada e, quando o tamanho da coluna se aproxima de 0, é o ponto de inflexão da tendência. O indicador usa técnicas de negociação simulada, Fornece
DYJ Estratégia de longo prazo EA é um sistema de negociação de longo prazo Começamos por procurar o preço mais baixo na vela como uma tendência longa, e começamos por procurar o preço mais alto como uma tendência curta. Manteremos a posição por mais tempo e obteremos o lucro máximo. Quando a ordem está na direção errada, a estratégia pode transformar perdas em lucros. A EA é executada em qualquer período do gráfico em apenas uma moeda Signal URL INPUT InpMagicNumber = 8257 InpIsDisplayInterf
The DYJBands opens and closes positions using Bollinger Bands signals: It performs trades after a price rebound from the borderlines of the indicator. It has the option to close positions by an opposite signal, by take profit and stop loss, move a trade to breakeven upon reaching the central Bollinger band or after a certain price movement. By default, the EA is configured for trading the GBPUSD currency pair on the H1 timeframe. Also, settings for the EURUSD, USDJPY, USDCAD and XAUUSD currency
The DYJ MacdSto is a unique High quality and easy to use and affordable trading tool because we have incorporated a number of proprietary features and MACD and Stochastic and RSI and ADX indicators. The main advantages of the trend trading strategy used by the Expert Advisor are opening positions only in the direction of a trend, ability for the long-term retention of profitable positions allowing users to achieve good combinations of profit/loss distributions. DYJ MacdSto EA uses MACD and Stoch
This StrongCurrency is a complete trading system based on a variety of technical indicators, moving averages and pivots. Each of those elements can be assessed in defined rules and coefficients (depending on the indicator) providing limitless optimization scenarios for the StrongCurrency. In order to work the StrongCurrency creates a trend strength and entry point signal list display by evaluating these data, that takes data from all symbols. It extrapolates all the information in order to get t
The DYJ TrendPending EA tracks the new change of price of the currency pair and opens trades in case of a price low and high from the main movement in the direction of the trend. So EA uses the least risky grid and Add lots. And can attach a positive and reverse pending order. The PositivePending orders can reduce the number of grids and Add lots,  while ReversePending orders reduce the loss of orders . For more convenient search, the working timeframe has been added to inputs (Work timeframe).
This is a multi-currency and multi-strategy EA. This EA is to create one or more polling trading strategies in a transaction. In the polling mode, the strategies filter a trend-free range market environment and trades are placed in the opposite direction at the edges of the range. With an additional main trend filter in the trend-following mode, the DYJ's ArtOfForexWar can also trade pull-backs during trends in the trend of loss. The winning rate is more than 95% within three orders or three cl
DYJ ScalpingBurg EA é um Expert Advisor totalmente automatizado. O filtro de algoritmo Burg é usado para entradas. O consultor precisa de um tipo de conta de cobertura e ECN. A perda da ordem é resgatada pelo jogo e se torna um lucro. Se a direção da ordem estiver errada. Você pode desativar a estratégia do jogo a qualquer momento. Recomendações Gerais Recomendar contas ECN, xauusd spreads entre 8 e 11 ou menos, EURUSD spreads 1 O depósito mínimo é de 200 dólares. Faça o download do arquivo de
DYJ ArtOfMakingMoney attempts to gauge bullish and bearish forces in the market by using two separate measures, one for each type of directional pressure. The  EA's BearsIndex  attempts to measure the market's appetite for lower prices The EA's BullsIndex attempts to measure the market's appetite for higher prices Features Monitors all pairs at the same time. The EA monitors the top 35 pairs by default, but you can select less pairs if you wish. It is a multi-currency EA that can be run from a
Nosso objetivo é fornecer um serviço acessível e de qualidade, capacitar os participantes do mercado, traders e analistas, com ferramentas muito necessárias para decisões de negociação informadas e oportunas. O indicador analista DYJ Trend mais otimizado, altamente robusto e fácil de usar. O analista da DYJ Trend tenta avaliar as forças de alta e de baixa no mercado usando duas medidas separadas, uma para cada tipo de pressão direcional. O BearsIndex do indicador tenta medir o apetite do
Filtro:
Sem comentários
Responder ao comentário