• 概述
  • 评论
  • 评论

DYJ PowerSignalProfessionally

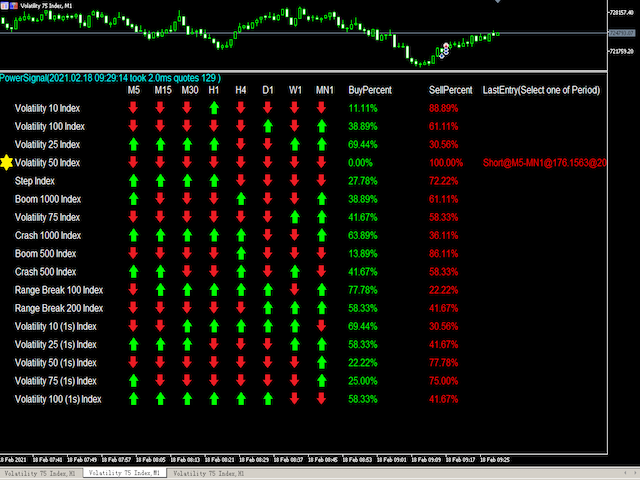
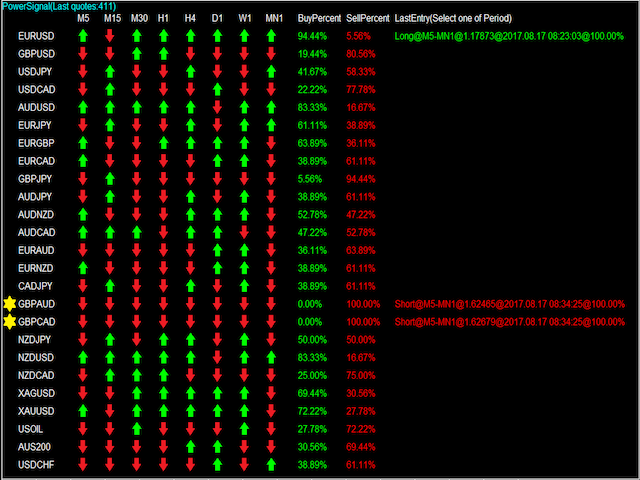
这个 DYJ PowerSignalProfessionally 是一个完整的基于ATR技术指标的交易系统。这些指标将记录每个时间框架和分析的货币对中每个力量趋势的当前状态。 DYJ PowerSignalProfessionally 通过评估这些数据,专业地创建一个趋势强度和进场点信号列表显示。如果有任何一对完全符合,将弹出一个警报指示这种情况。列表数据包括Symbol、M5 MN1、BuyPercent、SellPercent和LastEntry。LastEntry显示入口点(周期、价格、时间)。当趋势强度大于75%时,认为是强势货币对。

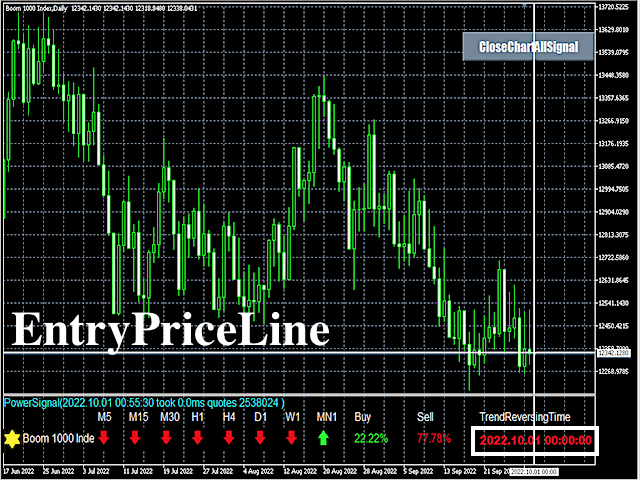
该指标还可以分析各品种的趋势反转点时间和最佳入场价格。

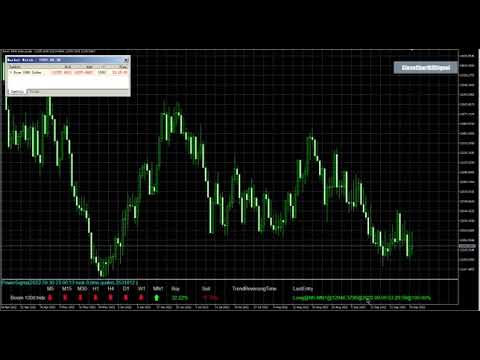
它能自动打开有新趋势的某个品种的图表窗口.

它可以显示一条白色的垂直时间线和一条白色的入场价格水平线

输入参数

  • Periods = 14-indicators Periods.
  • Text Color = While - 常态文本颜色。
  • Buy Signal color = LawnGreen - 多头信号颜色。
  • Sell signal color = OrangeRed - 空头信号颜色。
  • AlertOnlyTrendReversing     = true --  仅仅在趋势转折时报警.
  • Alert_ON = false-禁止报警.true-激活报警:支持报警提示、邮件、手机推送.
  • Alert_Min_Interval = 15
  • Entry_Percent = PERCENT_100 - PERCENT_100表示产生多空信号的趋势百分比要求在PERCENT_100或以上。
  • Wait_Mins_For_Next_Signal = 30 - 每次信号最小间隔时间。


关于作者

  • 作者:dayingcao,我是一个具有丰富经验的软件工程师.

Inputs Value

  • Periods = 14 - indicators Periods.
  • Text color = White - Normal text color.
  • Buy Signal color = LawnGreen - Long signal color.
  • Sell signal color = OrangeRed - Short signal color.
  • AlertOnlyTrendReversing     = true --  Alert Only Trend Reversing.
  • Alert_ON = false - Disable Alarm. true - Enable Alarm: support Alert, Email, push.
  • Alert_Min_Interval = 15
  • Entry_Percent = PERCENT_100 - Trend percentage requirements PERCENT_100 or more.
  • Wait_Mins_For_Next_Signal = 30 - Wait for the next time of signal.


Author

  • Daying Cao, an experienced software engineer.


推荐产品
Xtrade Trend Detector
Dago Elkana Samuel Dadie
Xtrade Trend Detector is an indicator capable of finding the best opportunities to take a position in any stock market. Indeed, it is a great tool for scalpers but also for Daytraders. You could therefore use it to identify areas to trade, it fits easily on a chart. I use it to detect trends on Big timeframes and take positions on Small timeframes. Don't hesitate to give me a feedback if you test it.
The   Pairs Cross indicator   is a unique tool for negatively correlated trading instruments, such as EURUSD and USDCHF currency pairs. It is based on a concept called pairs trading (or spread trading). Our indicator compares the strength of two currency pairs that are inversely correlated and quickly tells you when it’s time to buy the first pair and short a second pair, and vice versa. This is a straightforward approach to trading currency pairs that works very well. How to you use the Pair
这是一套原创的、敏捷型、极佳趋势系统。无论您是刚入门的交易新手还是专业级的交易人士,这套指标均可助您快捷及时的追踪市场趋势的最新变化。它具有以下特点: 使用方法极简单,即插即用,且所有趋势分析结果的显示方式一目了然 ; 不需配置 任何功能参数   ,趋势追踪指标将根据市场数据自动分析显示日/周/月级别的趋势大方向; 本日,本周及当前月度的趋势信息同时显示在同一个图表窗口中; 不依赖于任何其他传统/经典指标的数据 ; 支持 MT平台的 所有交易品种; 支持5分钟到日线的各级图表(MT5平台用户没有任何限制); 这套指标 采用特有的市场行为分析算法,以不同于传统趋势分析方法的维度,快速辨识即将形成的趋势。因此您 可以将本指标结合任何其他经典分析方法一起使用,从多方角度衡量您的交易决策。
TS Prop Firm MT5
Marzena Maria Szmit
TS Prop Firm MT5 has been prepared for Prop Trading Firms and Forex Brokers. TS Prop Firm EA is a version that support the   EURUSD, XAUUSD and US30 . There are three risk levels to choose from: Low, Medium and High. This robot is also   protected during important news , when high-impact news comes out, the robot doesn't open positions for 60 minutes before and 60 minutes after the important news. TS Prop Firm is available for MetaTrader 4 and MetaTrader 5. If you click on my profile, you can fi
货币强度计,为您提供当前哪些货币强,哪些货币弱的快速视觉指南。 该仪表测量所有外汇交叉货币对的强度,并对它们进行计算以确定每种货币的整体强度。 我们根据 28 对的趋势计算货币的强度。 .货币强度计是指标的通用名称,用于显示您是在处理强货币还是弱货币。这种基于算法的指标依赖于各种货币对的汇率来提供每种货币的强弱程度。 通过访问我们的 MQL5 博客,您可以下载该指标的免费版本。 购买前试用,不受 Metatrader Tester 限制: 单击此处 1. 文档 所有趋势货币强度文档(说明)和策略详细信息均可在我们 MQL5 博客的这篇文章中找到: 单击此处。 2. 联系方式 如果您有任何问题或需要帮助,请通过私信联系我。 3. 作者 SAYADI ACHREF,金融科技软件工程师,Finansya 创始人。
Niubility Trend  Niubility Trend  displays the trend direction for all time frames in real time. You'll see at a glance at which direction the trends are running, how long they last and how powerful they are. All this makes it an easy-to-use trend trading system for beginners, advanced and professional traders. Features Easy to trade Customizable colors and sizes It is non-repainting and non-backpainting It is fantastic as a trailing stop method It implements alerts of all kinds
Informative Trend
Vitalii Zakharuk
the fundamental technical indicator Informative Trend, which allows you to assess the current market situation in order to enter the market of the selected currency pair in a trend and with minimal risk. It basically uses the process of identifying the rate of change in price growth and allows you to find entry and exit points from the market. The indicator was created on the basis of the original indicators for searching for extreme points and is well suited for determining a reversal or a l
John Bollinger's normalized MFI (Fund Flow Index). Bollinger bands are used to calculate overbought/oversold areas. It takes three input parameters: MFI period - MFI calculation period MFI Applied Volume - Calculates the volume of MFI transactions BB period - Calculation period of the Bollinger band BB deviation - Brin deviation Calculation: NormMFI = (MFI-BL) / (TL-BL) Among them: TL = BBands(MFI, BB period, BB deviation, UPPER_BAND) BL = BBands(MFI, BB period, BB deviation, LOWER_BAND) MFI - M
AI Binary Sniper
Angelo Capoferri
基於人工智慧的指標,可產生二元期權的可能的看漲期權和看跌期權條目。 此指標適用於 3 種不同的策略: 1) 透過讀取交易量,它會在價格應該反轉時發出訊號 2)透過價格和成交量之間的背離,發出趨勢何時繼續或反轉的信號 3)透過價格和成交量之間的收斂,它發出了趨勢何時應該繼續的信號。 此指標適用於所有時間範圍,但在 3 分鐘或 5 分鐘期限內獲得最佳結果(因為在低時間範圍內會出現機構攻擊)。 最佳時間是流動性較大的時間,即格林威治標準時間 7 點至 18 點。 雖然該指標產生超過 70% 的正確訊號,但您可能會遇到操縱價格或相互排斥的機構之間的爭鬥,從而產生一系列錯誤訊號,因此我們建議使用充分的資金管理(例如 Masaniello )...
移動平均線クロス、ボリンジャーと移動平均線のクロス、移動平均線の角度でサイン表示 MT5インジケータ こちらに サイト があります。 このインジケータは3つのパターンでサインを表示(切り替え可能)します。 ① 移動平均線のクロス ② ボリンジャーバンドと短期移動平均線とのクロス ③ ボリンジャーバンドと短期移動平均線とのクロスと、中期移動平均線と長期移動平均線の角度 ⓸ ボリンジャーバンドと短期移動平均線とのクロス(サインを交互に表示) 移動平均線のクロス 指定した短期移動平均線と長期移動平均線のゴールデンクロスでは買いサイン、デットクロスでは売りサインを表示します。 ディフォルトでは短期は5,長期は20となっています。 もちろん変更可能になります。 移動平均線の種類をEMA(指数平滑移動平均線)やSMMA(平滑化移動平均)などに変更可能で適する価格も変更可能になります。 ボリンジャーバンドと短期移動平均線のクロス ボリンジャーバンド(以降BB)と短期移動平均線のクロスでサインを表示します。 ディフォルトではBB+1σと5MAのゴールデンクロスで買いサイン、BB-1σと5MAのデ
The indicator scans for Dinapoli thrust pattern in multiple timeframes for the all markets filtered and shows the results on Dashboard. Key Features Dashboard can be used for all markets It can scan for thrust pattern on MN1, W1, D1, H4, H1, M30, M15 ,M5, M1 timeframes Ability to choose number of bars required above/below displaced moving average to define thrust Parameters UseMarketWatch: Set true to copy all symbols available in market watch MarketWatchCount : Set the number of symbols that
Savia Forex Pro Indicator MT5
Savia Forex Software Solutions
Savia Forex Pro Indicator (MT5) The Savia Forex Solutions Forex Pro Indicator gives you highly accurate entries on all Forex/Currency pairs, Indices and Cryptocurrencies. The Forex Pro Indicator is dynamic and powerful and is optimized for all timeframes and ALL Currency pairs, Indices, Commodities, and Cryptocurrency pairs. Trade with improved confidence and maximize your success rate. Benefits Dynamic and Powerful. Forex Pro Indicator is fully optimized for all chart timeframes. Forex Pro Indi
Gapless   Moving Average  (GMA) Improved version of   standard   Moving Average  (MA)   from MetaTrader library which provides the possibility to   eliminate the 'gaps' between candle sticks   which distort the average values mainly during the N ('period') initial candles after market opens due to the spread ('gap') between closing price from previous day and opening price from the next day. The greater these 'gaps' are, the more divergent the standard MA is in order to indicate the current p
FREE
The indicator helps to enter a trade following the trend, at the same time, after some correction. It finds strong trending movements of a currency pair on a given number of bars, and also finds correction levels to this trend. If the trend is strong enough, and the correction becomes equal to the one specified in the parameters, then the indicator signals this. You can set different correction values, 38, 50 and 62 (Fibonacci levels) are better. In addition, you can set the minimum trend lengt
这个多时间框架和多符号供需区仪表板指示器在价格达到供需区时发送警报。也可以使用它来提醒常规的双顶/双底而不是区域。它可以用于从 M1 到 MN 的所有时间范围。     仪表板中最多可同时显示 9 个时间范围。 可以使用 RSI、背离(MACD、RSI 或 Awesome)和蜡烛图过滤器(pin bar、吞没、镊子和晨星/夜星)来仅过滤掉最强的设置。结合您自己的规则和技术,该指标将允许您创建(或增强)您自己的强大系统。 在产品博客 的末尾,您将能够下载示例智能交易系统 (EA) 的源代码,该示例使用 iCustom() 函数从指标获取交易信号。尽管 EA 功能齐全,但主要目的是使用代码并将其粘贴到您自己开发的 EA 中或将您自己的额外进入/退出逻辑添加到此 EA 中。鉴于我的时间有限,我将无法提供任何编程支持。我很抱歉。 特征 这 足以放置一个指标图表上,你会出现在仪表板的任何新的信号接收警报。支持所有 Metatrader 本地警报类型。 在仪表板内持续执行排名排序。可以禁用此排序,以便更轻松地找到特定符号。然后,交易品种将按照它们在交易品种参数中输入的相同顺序显示,或者按照它们
1. Why did I develop this series of indicators I found that most traders need to use multiple time frame indicators. They usually switch time frame to see indicators. However, once the timeframe is switched, you cannot see the  corresponding relationship  between  the price in the smaller timeframe  and  the indicator in the larger timeframe . For example: if your price chart is in H1 timeframe, you can see H4, D1 and W1 indicators in H1 timeframe Chart. This is more helpful for you to find t
Fibrillar
Vitalii Zakharuk
It is very easy to use the Fibrillar indicator, since the simplest is to look at the chart and act according to the indications of the colored arrows. The algorithm takes into account the measurement of prices, and this method also focuses on measuring each of the price drops (H / C, H / O, LC, LO) - which gives more detailed information, but also more averaged. When calculating this indicator, logarithmic gains are first calculated at the closing price, which allows you to filter out the tre
ACB Breakout Arrows Scanner MT5
KEENBASE SOFTWARE SOLUTIONS
It's a multi-symbol and multi-timeframe scanner for our indicator - ACB Breakout Arrows . With default settings, it scans for the buy/sell signals on 28 currency pairs and 9 time-frames concurrently.   Features It can scan 252* combinations of symbols and time-frames from a single chart. Open the signal's chart loaded with a predefined template with a single click.  Easy drag n drop anywhere on the chart. Real-time alerts with popup, sound, push-notifications and email alerts.  Input Para
This EA includes 11 SmartForexExpert EAs. These EAs belong to 3 different area types, momentum, reversal, trend. Using all EAs we can diversify risk and trade better and take advantage of different market behaviors where specific type of EA works better than others. Version 3.0 on MT5 include SFE Crypto Master! A big effort has made to include the different EAs in 1 mt5 file, and keeping the low demand of the computer resources. The EA runs very smoothly and only take care of his own trades,
Descriptions A point point is a technical analysis indicator, or calculations, used to determine the overall trend of market over different time frames. This indicator calculate the highest or lowest pivots among left x and right y bars and show the high/low level during that period.   From that, you could clearly see the top resistance & bottom support level and how market goes break out. Instructions pivotLeft - pivot left bar count pivotRight - pivot right bar count pivotHighColor - c
該指標基於人工智慧,透過讀取足跡來識別可能的市場反轉點,並在市場小幅波動發生之前提前發出訊號。 與價格和成交量指標不同的是,價格和成交量指標會產生「後期」入場,即當價格或成交量在方向變化時已經發生確認,因此通常運動已經結束,該指標根據其在圖表中讀取的內容發出信號。足跡,“當運動應該發生時”,因此提供了在運動開始時立即進入市場的可能性。 它不僅產生反轉訊號,而且還產生已經持續的趨勢的延續訊號。 由於人工智慧,該指標讀取市場上每個層級實際執行的合約(而不是帳簿中等待執行的合約,這些合約在執行前透過演算法交易刪除)。 該指標能夠區分以買價和賣價執行的合約(因此本質上識別激進訂單和被動訂單)、它們在市場上執行的頻率和激進程度(因此它檢測大型運營商“推動”的意圖)市場在某個方向上)並識別(由於資料流)“ICEBERG”訂單,即大訂單被分割成小塊以“隱藏”訂單的大小,但始終屬於同一運營商。 它還根據所簽訂的合約認識到耗盡和吸收階段,這會產生價格逆轉。 當這些條件中的一個或多個同時發生時,指標在幾毫秒內處理完這些條件後,會立即產生「多頭或空頭」入場訊號,發出聲音警告並在圖表上沿該方向繪製箭頭。
The Trap Play MT5
Carl Gustav Johan Ekstrom
Trap Play  refers to a market situation where price initially makes a new high or low, luring traders into believing a strong trend is forming. However, the price quickly reverses and invalidates the breakout, trapping those traders who entered positions based on the initial move. This sudden reversal often results in a rapid exit of positions, leading to significant price movement in the opposite direction.  Trap plays  can occur in various financial markets and timeframes and are characterized
Hrum
Yvan Musatov
The Hrum indicator was created to neutralize temporary pauses and rollbacks. It analyzes price behavior and, if there is a temporary weakness in the trend, you can notice this from the indicator readings, as in the case of a pronounced change in trend direction. Entering the market is not difficult, but staying in it is much more difficult. With the Giordano Bruno indicator and its unique trend line, staying on trend will become much easier! Every rise and every fall is reflected in your emot
Signal Eskiya mt5
Vitalii Zakharuk
Signal Eskiya, in addition to channel lines, reflects entry signals in the form of arrows. Trading strategies using the channel indicator belong to the classic methods of technical analysis, are easy to execute, and therefore available even to beginners. Price ranges work equally well on any trading assets and timeframes, they can be used both independently and with additional confirmation from oscillators and market volumes. American traders say: “Trend is your friend”, which means “Trend is
This MT5 indicator has been designed to be used on any currency pair or indices and on the daily time frame or higher . The indicator looks for medium-term high-probability continuations in price and will indicate you to go long (buy) or short (sell) if you see a green or red arrow next to the current candlestick respectively. The indicator paints an arrow when the specific criteria are met, however, you must wait until the current candlestick has closed until you enter a trade . Therefore you w
The indicator scans for TD Combo signals in multiple timeframes for the all markets filtered and shows the results on Dashboard. Key Features Dashboard can be used for all markets It can scan for signals on MN1, W1, D1, H4, H1, M30, M15 ,M5, M1 timeframes Parameters UseMarketWatch: Set true to copy all symbols available in market watch MarketWatchCount : Set the number of symbols that you want to copy from the market watch list. CustomSymbols: Enter the custom symbols that you want to be availa
- This is an implementation of OCC ==> open close cross - This indicator applies twelve different averaging methods to open and close prices separately to signal the trend switching. - All MA methods are set as input as well as period and different offsets applied to linear regression and ALMA averaging. - Buffers 16 and 17 can be used in EAs to detect trend direction. - You can message in private chat for further changes you need.
Glider
Vitalii Zakharuk
The Glider indicator gives accurate and timely signals to enter and exit the transaction that appear on the current candle. Using the indicator is very simple. When a dot and a blue line appear, open a buy deal. When a dot and a red line appear, open a sell deal. The main purpose of this indicator is to determine the moments of entry and exit from transactions, therefore the Glider indicator will display only the trend line and entry points, i.e. displays displays the entry points to the mark
Traffic Signal
Ramzi Abuwarda
推出瞩目的MT5指标——交通信号,它基于分析RSI(相对强弱指标)、Stochastics(随机指标)、CCI(商品通道指标)和趋势等多个时间框架上的水平,以获取最准确的入场信号的特殊策略。交通信号是您成功交易的终极通道!该创新指标精确且专业,通过集成先进的技术指标,并覆盖所有时间框架,助您准确把握市场动向,为您提供无与伦比的自信心。 通过交通信号,您可以全面分析关键指标,经过精密校准,以探测最具利润潜力的交易机会。告别不确定性,迎接明智决策的新时代。交通信号将RSI、Stochastics、CCI和趋势等指标融合得天衣无缝,为您描绘市场动态提供鲜活画面,前所未有。 畅享轻松的市场趋势和模式,交通信号为您持续监测各个时间框架。无论您偏好短期激动还是长期战略,这一杰出指标均可满足您的交易风格,为您提供对市场起伏的整体认知。 交通信号的准确性是其成功的基石。通过广泛的研究与开发,该指标提供精确调校和时机准确的信号。告别虚假信号,迎接前所未有的可靠性水平。就像有一位可信赖的盟友与您并肩作战,以毫不动摇的准确性引导您走向丰盈机会。 通过直观的界面和易于理解的信号,您将体验到自信交易的乐趣。无论
Godfather mt5
Ivan Simonika
The intelligent algorithm of the Godfather indicator accurately determines the trend, filters out market noise and generates entry and exit levels. The indicator will help in finding entry points when analyzing the price chart. The program first receives a "snapshot" of the graph, then analyzes it. The results are reported to the trader in the form of signals. The main purpose of this indicator is to determine the moments of entries and exits from transactions, so the indicator displays only th
该产品的买家也购买
首先,值得强调的是,这个交易系统是一个非重绘、非重画和非滞后的指标,这使得它非常适合手动和机器人交易。 “智能趋势交易系统 MT5”是专为新手和经验丰富的交易者量身定制的综合交易解决方案。它结合了超过 10 个优质指标,具有 7 多个强大的交易策略,使其成为适用于各种市场条件的多功能选择。 趋势跟随策略:提供精确的入场和止损管理,以有效地跟随趋势。 反转策略:识别潜在的趋势反转,使交易者能够利用区域市场的机会。 剃头策略:专为快速准确的日内交易和短期交易而设计。 稳定性:所有指标都不会重绘、不会重画和不会滞后,确保可靠的信号。 定制:支持自定义策略,以满足个人交易偏好。超过 7 种策略和组合可帮助您找到最佳策略。 信号清晰度:提供箭头信号,以指示清晰的入场和退出点。 实时警报:通过交易进出警报使交易者保持了解。 深入分析:提供更高时间框架的趋势分析和实时交易监控。 自适应颜色编码:利用蜡烛颜色编码来显示成交量、趋势和反转蜡烛信号。通过蜡烛颜色分析市场方向。 “智能趋势交易系统 MT5”赋予交易者必要的工具,以便在各种市场条件下做出明智和战略性的交易决策。无论当前市场状态如何,都能够充满
Atomic Analyst MT5
Issam Kassas
4.82 (11)
首先值得强调的是,该交易指标是非重绘、非延迟的指标,这使其成为手动和机器人交易的理想选择。 Atomic Analyst是一种PA价格行动指标,利用价格的力量和动量来寻找市场上更好的机会。配备了高级过滤器,可帮助去除噪音和假信号,并提高交易潜力。使用多层复杂的指标,Atomic Analyst扫描图表,并将复杂的数学计算转化为任何初学者都能理解并用来做出一致交易决策的简单信号和颜色。 “Atomic Analyst”是专为新手和经验丰富的交易者量身定制的综合交易解决方案。它将高级指标和一流功能融合为一体的交易策略,使其成为所有类型交易者的多功能选择。 日内交易和剥头皮策略:专为快速准确的日内交易和短期交易而设计。 日内和摆动交易策略:可用作追求价格大幅波动的日内和摆动交易者的可靠工具。 多货币和市场:凭借其可靠的精度,在不同的工具和市场上运作。 多个时间框架:可在多个时间框架上使用,性能良好。 稳定性:所有指标均不重绘、不重绘和不滞后,确保可靠的信号。 信号清晰度:提供箭头信号,用于清晰的入场和出场点。 实时警报:通过交易入场、SL和TP警报通知交易者。 多个利润水平:使用
FX Volume MT5
Daniel Stein
4.94 (17)
通过 mql5 和 Telegram 上 的 " 晨间简报 "获取每日市场更新,包括详细信息和屏幕截图 ! 外汇交易量(FX Volume)是第一个也是唯一一个从经纪商角度真正洞察市场情绪的交易量指标。 直接在您的图表上看到这些信息是真正改变游戏规则和突破性的交易解决方案。 受益于独特的市场数据洞察,如 比率(Ratios )显示货币多头和空头头寸的比率(百分比 比率变化 显示所选时间段内的多头比率及其百分比变化 总交易量 显示货币的总交易量(多头和空头),以手为单位 多头 交易量显示货币所有多头头寸的交易量 空头 交易量显示所有货币空头头寸的交易量 净多头 显示净多头交易量,即所有多头头寸减去所有空头头寸(以手为单位)。 净多头百分比 显示货币净多头交易量的变化 请阅读我们的基本教程 -> "如何使用外汇交易量进行交易 " 获取更多信息,如常见问题、交易技巧和教程视频,请访问我们的 外汇交易量公共信息频道 请 安装并运行 SI Connect 以建立与我们数据中心的持续连接 背景信息 我们都知道,外汇是一个分散的市场。这就是为什么我们必须打破常规思维,开发一个独
Quantum Trend Sniper
Bogdan Ion Puscasu
5 (37)
介绍   量子趋势狙击指标 ,突破性的 MQL5 指标,正在改变您识别和交易趋势反转的方式!由拥有超过13年交易经验的资深交易员团队开发,     量子趋势狙击指标   旨在通过其创新的方式以极高的准确度识别趋势反转,将您的交易之旅推向新的高度。 ***购买量子趋势狙击指标,即可免费获得量子突破指标!*** 当量子突破指标识别出趋势反转时,它会向您发出警报和信号箭头,并建议您三个止盈水平。 它既适合新手交易者,也适合专业交易者。 量子 EA 通道:       点击这里 MT4版本:       点击这里 建议: 时间范围: 所有时间范围。为了获得最佳结果,我们建议在 M15、M30 和 H1 时间范围内使用它。 货币对:欧元兑美元、英镑兑美元、澳元兑美元、欧元兑英镑、, EURAUD,  XAUUSD 账户类型:ECN、Raw 或 Razor,点差极低 经纪时间:任意 经纪商:IC Markets、Pepperstone with Raw 和 Razor 的点差最低 建议止损:50 点 建议止盈水平:20 点、50 点和
Entry Points Pro for MT5
Yury Orlov
4.54 (157)
这款指标用于 MT5,可提供准确的入场交易信号,且无重绘。 它可应用在任何金融资产:外汇、加密货币、贵金属、股票、指数。 它将提供极其精准的评估,并告诉您何时开仓和平仓的最佳时机。 观看 视频 (6:22),其中包含一个仅处理单一信号的示例,该信号即可值回指标购价! 大多数交易者在 Entry Points Pro 指标的帮助下,在第一个交易周内即改善了他们的交易结果。 订阅我们的 Telegram 群 ! Entry Points Pro 指标的益处。 入场信号无重绘 如果信号出现,并得到确认,则它不会再消失;不像是重绘指标,它会导致重大的财产损失,因为它们可以在显示信号后再将其删除。 无差错开仓 指标算法可令您找到入场交易(买入或卖出资产)的理想时机,从而提高每位交易者的成功率。 Entry Points Pro 可操作任何资产 它允许您在 MT5 平台上交易任何经纪商的加密货币、股票、贵金属、指数、大宗商品和货币。 提供任何方向的信号 Entry Points Pro 指标提供针对任意价格走势的入场交易信号 - 上涨、下跌或横盘(横向)。
FX Power MT5 NG
Daniel Stein
5 (4)
通过 mql5 和 Telegram 上 的晨间简报获取每日市场更新,包括详细信息和屏幕截图 ! FX Power MT5 NG 是我们长期以来非常受欢迎的货币强度计算器 FX Power 的下一代产品。 这款下一代强度计算器能提供什么?您所喜爱的原版 FX Power 的所有功能 附加功能 黄金/XAU 强度分析 更精确的计算结果 可单独配置的分析周期 可自定义计算限制,以获得更好的性能 为希望查看更多信息的用户提供特殊的多实例设置 无尽的图形设置,可在每个图表中设置您最喜欢的颜色 无数的通知选项,让您再也不会错过任何重要信息 采用 Windows 11 和 macOS 风格的全新圆角设计 神奇的移动指标面板 FX Power 主要功能 所有主要货币的完整强势历史 所有时间框架内的货币强弱历史 所有经纪商和图表的计算结果完全相同 100% 可靠的实时计算 -> 无重绘 可通过下拉列表选择分析时段 通过自定义模式单独配置分析时段 可在一个图表中使用多个实例 可移动 FX Power 显示屏(通过拖放) 适用于高分辨率 QHD、UHD 和 4K 显示器 自动终端配置 针对平板电脑
RelicusRoad Pro MT5
Relicus LLC
4.82 (22)
现在$ 147(更新后增加到$ 499) - 无限帐户(PC或Mac) RelicusRoad 用户手册 + 培训视频 + 访问 Private Discord Group + VIP 身份 一种看待市场的新方式 RelicusRoad 是世界上最强大的外汇、期货、加密货币、股票和指数交易指标,为交易者提供保持盈利所需的所有信息和工具。我们提供技术分析和交易计划,帮助每一位交易者取得成功,从初学者到高级。它是一个关键的交易指标,可以提供足够的信息来预测未来的市场。我们相信一个完整的解决方案,而不是图表上几个没有意义的不同指标。这是一个多合一指标,显示无与伦比且非常准确的信号、箭头 + 价格行为信息。 RelicusRoad 基于强大的人工智能,提供缺失的信息和工具来教育您并使您成为交易专家,成为成功的交易者。 几乎所有技术指标都滞后,这意味着它们只能报告已经发生的事情。因此,他们只确认您过去可以看到的价格已经在哪里。我们相信领先指标可以预测未来价格,而无需重新绘制,也不要过度依赖可能改变并导致重新绘制的滞后指标。如果您根据滞后指标进行交易并建立头寸,您就知道您已
XQ Indicator MetaTrader 5
Marzena Maria Szmit
5 (1)
Step into the realm of Forex trading with confidence and precision using XQ, a cutting-edge Forex indicator designed to elevate your trading game to unprecedented heights. Whether you're a seasoned trader or just stepping into the world of currency exchange, XQ Forex Indicator empowers you with the insights and signals needed to make informed trading decisions. The signal conditions are a combination of three indicators, and XQ Forex Indicator only display  medium and long-term trends . The ind
Blahtech Supply Demand MT5
Blahtech Limited
4.57 (14)
Was: $299  Now: $99   Supply Demand uses previous price action to identify potential imbalances between buyers and sellers. The key is to identify the better odds zones, not just the untouched ones. Blahtech Supply Demand indicator delivers functionality previously unavailable on any trading platform. This 4-in-1 indicator not only highlights the higher probability zones using a multi-criteria strength engine, but also combines it with multi-timeframe trend analysis, previously confirmed swings
Advanced Supply Demand MT5
Bernhard Schweigert
4.53 (15)
任何新手或专业交易者的最佳解决方案! 该指标是一款独特、高质量、且价格合理的交易工具,因为我们已经整合了许多专有功能和新公式。 依据此更新,您将能够显示双重时间帧区域。 您不仅可以显示一个较高的时间帧,还可以同时显示图表时间帧,加上更高的时间帧:显示嵌套时区。 供需双方所有交易者都会喜欢它。 :) 重要信息披露 高级供需的最大潜力,请访问 https://www.mql5.com/zh/blogs/post/720245   想象您的交易如何得以改善,是因为您能够精准定位入场或目标位吗? 构建于新的底层算法,它可以更轻松地识别出买卖双方之间的潜在失衡。 这是因为它以图形方式展示供需最强劲区域,及其过去的表现(显示旧区域)。 这些功能旨在帮助您更轻松地发现最佳入场区域和价位。 现在您可以针对您的交易品种和时间帧来优化和编辑区域强度! 高级供需指标适用于所有产品和时间帧。 它是一个新的公式,非常新的功能是两个区域强度函数可由用户输入进行调整! 这在交易中是一大优势。 当您学习如何使用专有功能,例如带有价格游离最小 X 因子的区域强度时,您能够判断该区域强劲与否。 供需区域用作警报触发器
ON Trade Gann Squares MT5
Abdullah Alrai
5 (1)
Gann 方块指标是一种强大的市场分析工具,基于 W.D. Gann 在其“市场预测数学公式”一文中介绍的数学概念。该指标融合了与平方数(如 144、90 和 52)有关的 Gann 技术,以及平方 9。此外,它还融入了  关于如何将平方 9 与通道和星形图案结合使用的方法。 用户手册和使用方式: 在使用该指标之前,我们建议您阅读用户手册,并与我们联系以获得任何澄清。您可以在我们的网站上找到完整的用户手册。 该指标提供了 MT5 的完整版本供购买,也提供了 MT4 的免费版本供测试。提供了两个版本的链接供您方便使用。 主要特点和功能: Gann 方块指标为您的交易环境提供了全套工具,使您能够基于几何图案和 Gann 的概念做出明智的决策。以下是主要特点: 平方 9 分析:   该指标可以绘制与平方 9 有关的各种元素,包括水平线、星形图案、网格、Gann 扇形等。这在您的图表上提供了 Gann 的几何概念的视觉表示。 Gann 方块:   该指标绘制了 Gann 方块 52、90 和 144,使您能够可视化和分析它们与价格走势的关系。 自由 Gann 星形图案:   该指标使您能够直接
Volume by Price MT5
Brian Collard
5 (3)
The Volume by Price Indicator for MetaTrader 5 features Volume Profile and Market Profile TPO (Time Price Opportunity). Get valuable insights out of currencies, equities and commodities data. Gain an edge trading financial markets. Volume and TPO histogram bar and line charts. Volume Footprint charts. TPO letter and block marker charts including split structures. Versatile segmentation and compositing methods. Static, dynamic and flexible ranges with relative and/or absolute visualizations. Lay
介绍     Quantum Breakout PRO   ,突破性的 MQL5 指标,正在改变您交易突破区域的方式!由拥有超过13年交易经验的资深交易员团队开发,     量子突破 PRO     旨在通过其创新和动态的突破区域策略将您的交易之旅推向新的高度。 量子突破指标将为您提供带有 5 个利润目标区域的突破区域的信号箭头,以及基于突破框的止损建议。 它既适合新手交易者,也适合专业交易者。 量子 EA 通道:       点击这里 重要的!购买后请私信我领取安装手册。 建议: 时间范围:M15 货币对:GBPJPY、EURJPY、USDJPY、NZDUSD、XAUUSD 账户类型:ECN、Raw 或 Razor,点差极低 经纪商时间:GMT +3 经纪商:IC Markets、Pepperstone with Raw 和 Razor 的点差最低 规格: 不重漆! 最多 5 个建议利润目标区域 建议止损水平 可定制的盒子。您可以设置自己的 Box Time Start 和 Box Time End。 接触 如果您有任何疑问或需要帮
Owl Smart Levels MT5
Sergey Ermolov
4.47 (36)
MT4版本  |   FAQ Owl Smart Levels Indicator 是一個完整的交易系統,包含 Bill Williams 的高級分形、構建正確的市場波浪結構的 Valable ZigZag 以及標記準確入場水平的斐波那契水平等流行的市場分析工具 進入市場和地方獲利。 策略的详细说明 指示灯使用说明 顾问-贸易猫头鹰助手助理 私人用户聊天 ->购买后写信给我,我会将您添加到私人聊天中,您可以在那里下载所有奖金 力量在於簡單! Owl Smart Levels 交易系統非常易於使用,因此適合專業人士和剛開始研究市場並為自己選擇交易策略的人。 策略和指標中沒有隱藏的秘密公式和計算方法,所有策略指標都是公開的。 Owl Smart Levels 允許您快速查看進入交易的信號,突出顯示下訂單的水平並向您發送有關已出現信號的通知。 優點很明顯: 清楚地顯示主要和更高時間框架的趨勢方向。 指示儀器信號的出現。 標記開單、止損設置和固定利潤的水平。 沒有多餘的,只有必要的結構! ZigZag 表示全球趨勢的方向,因此也表示貿易方向。 市場反轉點的短線清楚地表明在什麼水平上構建斐波
Gartley Hunter Multi
Siarhei Vashchylka
5 (5)
Gartley Hunter Multi - An indicator for searching for harmonic patterns simultaneously on dozens of trading instruments and on all classic timeframes: (m1, m5, m15, m30, H1, H4, D1, Wk, Mn). Manual (Be sure to read before purchasing) | Version for MT4 Advantages 1. Patterns: Gartley, Butterfly, Shark, Crab. Bat, Alternate Bat, Deep Crab, Cypher 2. Simultaneous search for patterns on dozens of trading instruments and on all classic timeframes 3. Search for patterns of all possible sizes. Fr
MetaBands M5
Vahidreza Heidar Gholami
4.67 (3)
MetaBands使用强大且独特的算法绘制通道并检测趋势,以便为交易者提供进出交易的潜在点。它是一个通道指标和强大的趋势指标。它包括不同类型的通道,可以通过使用输入参数简单地合并以创建新通道。MetaBands使用所有类型的警报通知用户市场事件。 功能 支持大多数通道算法 强大的趋势检测算法 能够合并不同类型的通道 多时间帧和多货币(信号矩阵) 所有类型的警报功能(声音、屏幕闪烁、推送通知、电子邮件、弹出窗口、箭头) 它永远不会重绘 趋势检测 MetaBands使用在通道内振荡的蓝色线来检测趋势。当该线遇到通道的上界时,表明开始下跌趋势,当它遇到下界时,表明开始上涨趋势。如果蓝线接近中线,则市场处于整理期。 该指标使用独特的方法来检测趋势。一开始可能看起来有些复杂,但如果您观看视频教程,您就会意识到它是多么强大且易于使用。 入场和出场信号 当趋势变化或价格穿过上下通道时,MetaBands会立即通过不同的方法提醒交易者,这些方法可以在指标设置中启用。 信号矩阵 要监视来自不同时间框架的多个符号并在一个地方查看信号,请单击右上角按钮或按键盘上的M键以打开信号矩阵。该矩阵可以
Blahtech Market Profile MT5
Blahtech Limited
5 (8)
Was: $249  Now: $99   Market Profile defines a number of day types that can help the trader to determine market behaviour. A key feature is the Value Area, representing the range of price action where 70% of trading took place. Understanding the Value Area can give traders valuable insight into market direction and establish the higher odds trade. It is an excellent addition to any system you may be using. Inspired by Jim Dalton’s book “Mind Over Markets”, this indicator is designed to suit the
Golden Spikes Detector
Batsirayi L Marango
5 (1)
Golden Spikes Detector This indicator is based on an advanced strategy primarily for trading spikes on Boom and Crash Indices. Complex algorithms were implemented to detect high probability entries only. It alerts on potential Buy and Sell entries. To trade spikes on the Deriv or Binary broker, only take Buy Boom and Sell Cash alerts. It was optimised to be loaded on 5-minute timeframe although multiple timeframe analysis is done in the background. Features ·             Desktop pop up and sound
Golden Gate Algo MT5
James David Lane
4 (6)
40% 圣诞优惠!价格将于1月1日涨至$250! 推出GoldenGate Entries:前沿交易解决方案! 发现与GoldenGate Entries(GGE)一同进行交易的革命性方法,这是一款设计用于提升您交易体验的先进指标。GGE提供了一套全面的功能,以赋予用户在交易决策中的精准和信心。 交易对:任意(外汇 - 商品 - 股票 - 股票 - 加密货币) 时间框架:15分钟至H1 主要特点: 买入和卖出箭头指示:接收伴随弹出警报的买入和卖出箭头指示,确保您随时保持了解。 GoldenGate_Algo:通过GoldenGate_Algo深入了解市场状况,这是一款强大的工具,用于评估市场是否处于“超卖”或“超买”状态。 当前趋势分析:通过访问您正在查看的时间框架上的当前趋势,保持领先地位,使您能够将交易与市场当前方向对齐。 内置枢轴点:使用内置的枢轴点轻松识别关键市场点,提供有价值的支撑和阻力水平。 蜡烛扫描器:分析蜡烛形态和图案,找到最佳的入场点并过滤掉低概率的入场。 完全定制:通过完整的定制选项,完全掌控您的交易体验,允许您个性化从
Bill Williams Advanced
Siarhei Vashchylka
5 (3)
Bill Williams Advanced is designed for automatic chart analysis using Bill Williams' "Profitunity" system. The indicator analyzes four timeframes at once. Manual (Be sure to read before purchasing) Advantages 1. Automatically analyzes the chart using the "Profitunity" system of Bill Williams. The found signals are placed in a table in the corner of the screen. 2. Equipped with a trend filter based on the Alligator indicator. Most of the system signals are recommended to be used only accordi
TrendMaestro5
Stefano Frisetti
note: this indicator is for METATRADER4, if you want the version for METATRADER5 this is the link:  https://www.mql5.com/it/market/product/108106 TRENDMAESTRO recognizes a new TREND in the bud, he never makes mistakes. The certainty of identifying a new TREND is priceless. DESCRIPTION TRENDMAESTRO identifies a new TREND in the bud, this indicator examines the volatility, volumes and momentum to identify the moment in which there is an explosion of one or more of these data and therefore the mome
TPA True Price Action indicator reveals the true price action of the market makers through 100% non-repainting signals strictly at the close of a candle! TPA shows entries and re-entries, every time the bulls are definitely stronger than the bears and vice versa. Not to confuse with red/green candles. The shift of power gets confirmed at the earliest stage and is ONE exit strategy of several. There are available now two free parts of the TPA User Guide for our customers. The first "The Basics"
Trades Assistant MT5
Martin Muriu Maina
Trade Assistant MetaTrader System  — a multi-timeframe system that is based on three standard indicators:   Stochastic oscillator ,   RSI   (Relative Strength Index), and   CCI   (Commodity Channel Index). It displays current trend directions for M1, M5, M15, M30, H1, H4, D1, W1, and MN1 timeframes. When you follow such an indicator you have a clear picture of the trends across all important timeframes. It doesn't matter which timeframe you attach this indicator to. Input parameters CheckCandl
Professional Scalping Tool on Deriv Attention! The indicator will be sold in limited quantities!!! Description: This trading indicator is designed for professional traders focused on scalping. Designed with the market in mind, it provides highly accurate spike trading signals. It works on the M1 timeframe and supports the following symbols: Boom 300 Index, Boom 500 Index, Boom 1000 Index, Crash 300 Index, Crash 500 Index, Crash 1000 Index. Functional Features: - Direction: - Trading is ca
TPSpro RFI Levels MT5
Roman Podpora
5 (5)
A key element in trading is zones or levels from which decisions to buy or sell a trading instrument are made. Despite attempts by major players to conceal their presence in the market, they inevitably leave traces. Our task was to learn how to identify these traces and interpret them correctly. Reversal First Impulse levels (RFI)   -  Version MT4                  INSTRUCTIONS                 RUS                 ENG                         R ecommended to use with an indicator   -  TREND PRO  
Quantum Heiken Ashi PRO MT5
Bogdan Ion Puscasu
4.5 (8)
Quantum Heiken Ashi PRO 简介 Heiken Ashi 蜡烛旨在提供对市场趋势的清晰洞察,以其过滤噪音和消除虚假信号的能力而闻名。告别令人困惑的价格波动,迎接更流畅、更可靠的图表表示。 Quantum Heiken Ashi PRO 的真正独特之处在于其创新公式,它将传统烛台数据转换为易于阅读的彩色条。红色和绿色条分别优雅地突出了看跌和看涨趋势,让您能够以非凡的精度发现潜在的进入和退出点。 量子 EA 通道:       点击这里 MT4版本:       点击这里 这一卓越的指标具有以下几个关键优势: 增强清晰度:通过平滑价格波动,Heiken Ashi 金条可以更清晰地反映市场趋势,使您更容易识别有利的交易机会。 减少噪音:告别经常导致错误信号的不稳定价格变动。 Quantum Heiken Ashi 指标可过滤噪音,使您能够做出更明智的交易决策 无缝集成:Heiken Ashi 指标专为 MetaTrader 开发,可无缝集成到您的交易平台中。它用户友好、高度可定制,并且与您的其他交易指标和过滤器兼容 无论您是寻求新优势的经验丰富的交易者,
Gartley Hunter MT5
Siarhei Vashchylka
5 (13)
Gartley Hunter - An indicator for searching for harmonic patterns (Gartley patterns) and their projections. The indicator is equipped with a system of alerts and push notifications. Manual (Be sure to read before purchasing) | Version for MT4 Advantages 1. 12 harmonic patterns: 7 classical and 5 exotic. New patterns will be added as the indicator develops. 2. Constant automatic search for harmonic patterns. The indicator is capable of finding from the smallest to the largest patterns. 3. Autom
Anchored VWAP with Alert MT5
Trade The Volume Waves Single Member P.C.
What is the Volume Weighted Average Price (VWAP)? The volume weighted average price (VWAP) is a trading benchmark used by traders that gives the average price an instrument has traded at throughout the day, based on both volume and price.  It is important because it provides traders with insight into both the trend and value of the instrument. What is the Difference between VWAP and AVWAP? While VWAP is having as starting point the beggining of the day,week,month etc. in the AVWAP you can p
VTrende Pro
Andrii Diachenko
5 (1)
VTrende Pro - MTF indicator for trend trading with a display panel for MT5 *** Videos can be translated into any language using subtitles (video language - Russian) Although the signals of the VTrende Pro indicator can be used as signals of a full-fledged trading system, it is recommended to use them in conjunction with the Bill Williams TS. VTrende Pro is an extended version of the VTrende indicator. Difference between Pro version and VTrende: - Time zones - Signal V - signal 1-2 waves
作者的更多信息
DYJ CashRegisterEA致力于DYJ技术指标。当市场强劲时,价格位于高位做空,价格位于低位时做多,保持全天后交易 这就是安全市场中的机会和交易。与安全交易时间一致的收益。 EA使用单一订单模式来最小化交易量和最大化利润结算算法策略。并根据DYJ技术指标自动关闭仓位,EA始终保持1个订单 没有网格交易。 没有套利。 没有对冲。 没有马丁。 请在产品评论区下载回测测试报告的设置文件和PDF文件 建议 最低存$100,建议$1000以上或更高. 使用Deriv经纪商。 专注M1, Crash 500 Index.   回测存款 $100 回撤=0.53%    15 个月利润=$30069 专注M1, Crash 500 Index.   回测存款 $100 回撤=2%    15 个月利润=$4429 专注M1, Crash 500 Index.   回测存款 $100 回撤=6%    15 个月利润=$13041 专注M1, Crash 500 Index.   回测存款 $100 回撤=1.76%    15 个月利润=$21379 专注M
StrongCurrency
Daying Cao
5 (1)
StrongCurrency是基于各种技术指标,移动平均线和枢轴的完整交易系统。这些元素中的每一个都可以通过定义的规则和系数进行评估(取决于指标),为StrongCurrency提供了无限优化的方案。StrongCurrency通过评估数据创建一个趋势强度和入场信号列表显示,它显示所有货币对的数据。根据每个货币对趋势强弱获得入场信号。列表数据包括Symbol,BuyPercent,SellPercent,LastBuySignal,LastSellSignal。其中LastBuySignal和LastSellSignal内容显示入场价格,时间,货币对趋势百分比。趋势强度大于70%时,认为是强货币对;该工具适用于外汇市场,指数,金属的数据。 该工具仅在一个图表任意周期上运行,它对于多货币交易者非常有吸引力的,其简化的信息(LastBuySignal和LastSellSignal)可以提供出色的输入信号。帮助您快速,识别强弱货币对。请参见截图。 关于MT4回测多货币的限制在评论里有说明。 输入参数 Text Color = White - 常态文本颜色。 Buy Signal colo
DYJ Follow Me 是一跟随任意DYJ指示器虚拟交易记录进行真实开仓和关仓的EA。 它能显示跟单信号源指示器名称,显示指示器状态;当前仅仅是 DYJ SignalSourceOfWPR MT5 ,后续会扩展更多指示器。 它能接收指示器实时趋势方向 它能接收指示器最新入场时间 它能接收指示器最新入场价格 它能显示多个货币对的利润按钮,并且在按钮上还显示了仓位总数 显示多个货币对挂单数量的按钮,您能随时删除某个货币对挂单,也能删除全部货币对挂单 您能根据利润大小,随时点击按钮关闭某个货币对的总利润或全部货币对利润 您可以设置每次1单,每单固定手数0.01 等或者1手或者更高或者跟随指示器交易量。 设置动态利润追踪。 设置封顶目标利润。 关仓时自动删除挂单。 同时显示多个货币对的每个利润和总体利润。 设置总体亏损百分比强制关仓。 INPUT InpSignalOrigin            =  "WPR"; -- 1.  DYJ_T3:DYJ T3MA.  2. WPR: WPR  indicator.  3. ALG: Alligator  indicator. In
DYJ Withdrawal Plan
Daying Cao
3 (4)
DYJ WITHDRAWAL PLAN 取款计划EA是一个趋势转折交易系统, 它适合任意经纪商的任意品种:外汇或者其他任何经纪商(例如某经纪商的Volatility Index等). 它显示出基础的TP,SL,网格间距和TPSL利润以及最低交易量的保证金,可以在表格内修改止损止盈和网格间距,并能在开仓后,显示每个品种利润,并且每个品种都有自动目标利润追踪功能,还具有总体目标利润追踪功能. 它可以在趋势转折点开仓和平仓。 另外它具有手动交易助手功能,它能做独立手动交易或者与EA混合交易. 当手动交易或者自动交易方向错误时,EA能自动使订单由亏损变获利。 EA能通过设置使用1单制模式,网格布局模式,马丁布局模式,GAME模式。 DYJ WITHDRAWAL PLAN 取款计划EA 可以根据资金管理系统指定提款计划。 它可以按照日盈利、周盈利、月盈利三种模式取钱。 每种模式都可以按照你指定的提取比例提取利润。 我们能让你在实盘账户上做到模拟仿真取款。 并有计划的定期取款策略能循序渐进地收藏我们的利润,当遭遇市场风险时,取款已经远远超出本金. 目前经过严格测试,以下品种效果最佳 推荐 260
DYJ WPR - SignalSource 是基于  WPR  指标的EA . 它仅仅使用一个货币对某个周期图表运行EA,就能监控全部货币对信号开仓关仓。 WPR 推荐 指标值介于80%和100%之间,表明市场超卖。 指标值介于0到20%之间,表示市场超买。 该指标的入场信号,则是趋势转折点。 该指标使用模拟交易技术,   指标为你提供评价开盘信号和收盘信号整体盈利。   你用哪种评估模式交易都很方便。   当你选择最大利润模型评估模型时, 建议您使用跟踪止损功能。 这样可以最大程度的跟踪趋势利润。   当您选择反向信号关闭评估模式时, 建议你耐心等待反信号出现,然后关闭仓位。 这个可以一直等趋势真正结束并盈利。 如果您需要自动化跟随指标开仓关仓,请下载实用工具软件 DYJ Follow Me Input parameters  [Indicator] InpWPRPeriod    = 14 -- period for WPR    InpShowArrows      = true InpAlertsOn        = true ArrowUpClr 
这个QuickClose帮助您一键即可立即关闭所有订单,其工作非常快。您可以选择您想要的符号或关闭所有符号,因此它将有助于您在交易中更快地管理交易。该EA可以通过选定的符号或总数快速关闭所有买入和卖出订单。此SymbolButton专为关闭订单而设计。有手动和自动预设利润关闭功能。 带有总利润追踪功能,能锁定70%的目标利润,同时新的目标利润成倍提高. 并且带有自动删除全部挂单功能或者某个货币对全部挂单功能。 参数 PROFIT -> 某个货币对的全部订单利润达到PROFIT时,仅仅这个货币对的仓位全部平仓。 TOTALPROFIT   ->   全部货币对的利润达到TOTALPROFIT时全部平仓。 InpTrailingPercentage   ->   自动锁定70%的目标利润 ISEQUITY   ->   YES_EQ/NO_EQ. YES_EQ - 选择YES_EQ则净值低于EQUITY平仓. NO_EQ - 选择NO_EQ时净值低于EQUITY也不平仓。 EQUITY   ->   1.00. 净值低于EQUITY时全部平仓. ButtonsInARow   ->   每
SoarSignal
Daying Cao
专业交易者都知道,在市场价格趋势转变时是进场交易的最佳时机,趋势转变时K线状态变化最明显,SoarSignal使用随机指标可以识别这些变化,确认趋势已衰竭,它是最接近K线状态变化的指标。SoarSignal的3条线均在 0 到 100 的区间内移动。值高于 80 视为处于超买区,表明价格可能发生反转。值低于 20 视为超卖,也表明价格可能发生反转。如果 %K 线由下往上穿越 %D 线,如果 %J 线由下往上穿越 %K与%D 线,可解读为买入信号。如果 %K 线由上往下穿越 %D 线,如果 %J线由下往上穿越 %K与%D 线,可解读为卖出信号。此类交叉可频繁发生。为获取更可靠的信号,您可以等待交叉与到达超买/超卖位同时发生。当有更可靠的买卖信号时提示交易者。 输入参数 nPeriod:20-Indicator Period.KDJ指标周期,通常不需要改变。 zoneSELL:80-值高于 80 视为处于超买区,表明价格可能发生反转。 zoneBUY:20-值低于 20 视为超卖,也表明价格可能发生反转。 InpBuyColor:LighSeaGreen-多头箭头颜色。 InpSell
PowerSignal
Daying Cao
5 (1)
这个PowerSignal是基于ATR技术指标的完整交易系统。该指标将分析并记录每个POWERTREND从M5-MN中每个周期和货币对趋势强度。 PowerSignal通过评估这些数据来创建一个趋势强度和入口点信号列表显示。如果趋势强度百分比达到100,则一个警告会弹出来指示这种情况。当趋势百分比达大于等于75%时认为是强货币,另外LastEntry字段提示选择一个周期入场、显示了多个入场周期,入场价格,时间.通常根据实际情况选择一个中高周期入场比较好。 输入参数 Periods = 14-indicators Periods. Text Color = While - 常态文本颜色。 Buy Signal color = LawnGreen - 多头信号颜色。 Sell signal color = OrangeRed - 空头信号颜色。 Alert_ON = false-禁止报警.true-激活报警:支持报警提示、邮件、手机推送. Alert_Min_Interval = 15 Entry_Percent = PERCENT_100 - PERCENT_100表示产生多空信号的
这个指标显示2条移动平均线间的交叉,一个快速和慢速移动平均线。当快速MA1向上穿越慢速MA2时弹出报警。当快速MA1向下穿越慢速MA2时弹出报警。 输入参数 快速MA设置 Period = 5 -快速MA周期 Mode = SMA - type of Moving Average (SMA, EMA, SMMA, LWMA). Price = Close - type of price (Close,Open, Low, High, Median, Typical, Weighted). 慢速MA设置 Period:10 - 慢速MA周期 Mode = SMA - type of Moving Average (SMA, EMA, SMMA, LWMA). Price = Close - type of price (Close,Open, Low, High, Median, Typical, Weighted). 其他 NewBarCheckOnly = true/false - true:Check only new Bar DistanceBetweenMA = 0 - 2
这个EA是基于经典的趋势跟踪系统监测入场信号的。它是基于ATR和CCI指标与移动平均线指标 DYJ TwoMACrossAlarm ,它使用2条移动平均线交叉查找信号,2个平均线分为一个快速和慢速移动平均线,这个EA使用了动态分配移动平均线MA1和MA2的周期,平均线周期使用了斐波那契数列,例如5,8 或 13,21 或 21,34 或......;当快速MA1向上穿越慢速MA2与CCI值向上穿越0线时,建立多单。当快速MA1向下穿越慢速MA2与CCI值向下穿越0线时,建立空单。ATR指标用于自动计算止损。如果有相反信号以及止损,止盈,追踪止损退出. 输入参数 MA Setup IsAutoAllocationMA = true - Dynamic allocation Period Fast MA Setup Period =5 - period of Faster Moving Average (value 5 ),if not automatic allocation period . Mode = EMA - type of Moving Average (SMA,
DYJ NewsForexFactory是用于基本市场分析的日历交易工具,同时它也是宏观经济事件指标。 在这里,你可以找到全球最大经济体的金融新闻和指标——从美国、欧盟到澳大利亚和纽西兰和日本和中国,共有9个经济体,涉及60多个货币对。800多个宏观经济指标和事件是从公共来源实时收集的。每个指标都有历史、当前和预测值以及重要性特征。此外,该服务存储图表和表格中列出的大量历史数据。 指示器右侧动态绿色箭头指示最后一个事件的发生,并给出该货币的数据分析结果,Better或者Worse,你能根据结果判断货币对的多与空 指示器左边指示黄色星号表示下一个即将发生的事件 指示器时间序列栏里显示每个时间点的事件对象。 指示器具有电子邮件和推送通知功能。 所有货币对 GBPUSD、EURUSD、USDJPY、USDCHF、USDCAD、GBPJPY、EURJPY、eugbp、EURAUD、EURNZD、EURCAD、EURCHF、CADJPY、CADCHF、AUDUSD、AUDNZD、AUDCAD、AUDJPY、AUDCHF,NZDJPY、NZDUSD、NZDCAD、NZDCHF 参数
这个指标显示了3条移动平均线之间的交叉,有快速、中速、慢速3条MA线。当快速FastMA向上穿越中速middleMA与中速middleMA向上穿越慢速slowMA,发出多头报警。当快速FastMA向下穿越中速middleMA与中速middleMA向下穿越慢速slowMA,发出空头报警。其中三线交叉包含了三线交叉于一个点的特例;当FastMA(MA1) 向下穿越middleMA(MA2),发出报警提示关闭多单,当FastMA(MA1) 向上穿越middleMA(MA2),发出报警提示关闭空单。 输入参数 快速MA设置 MAPeriod1 = 5 - 快速平均线周期. MAMethod1 = EMA - 移动平均线类型(SMA, EMA, SMMA, LWMA). MAPriceType1 = Close - 价格类型 (Close,Open, Low, High, Median, Typical, Weighted). 中速MA设置 MAPeriod2 = 20 - 中速平均线周期. MAMethod2 = EMA - 移动平均线类型 (SMA, EMA, SMMA, LWMA).
这个 Expert Advisor 是基于3条移动平均线指标,移动平均线交叉基于下列思想:快速、中速、慢速3条移动平均线交叉时,作为开仓和关仓的信号,其中三线交叉包含了三线交叉于一个点的特例。 当FastMA(MA1) 向上穿越middleMA(MA2)与middleMA(MA2)向上穿越slowMA(MA3)时建立多单. 当FastMA(MA1) 向下穿越middleMA(MA2)与middleMA(MA2)向下穿越slowMA(MA3)时建立空单; 当FastMA(MA1) 向下穿越middleMA(MA2),关闭多单,当FastMA(MA1) 向上穿越middleMA(MA2),关闭空单。 这个专家使用了资金管理,传统的止损、止盈、追踪止损。每次交易只有一个订单,这确保交易的最大安全。 输入参数: Fast MA settings Period = 5 - period of Faster Moving Average (value 5 ). Mode = EMA - type of Moving Average (SMA, EMA, SMMA, LWMA). Pric
The RiseTrading is a unique High quality and easy to use and affordable trading tool because we have incorporated a number of proprietary features and PowerSignal and MACD and Stochastic indicators. The main advantages of the trend trading strategy used by the Expert Advisor are opening positions only in the direction of a trend, ability for the long-term retention of profitable positions allowing users to achieve good combinations of profit/loss distributions. That can work on a real account at
DYJ Stoch 控制器 是一个全货币对 Stoch 交易系统,它能显示每一个货币对M1到MN周期的 Stoch 值,当某个周期的 Stoch 值达到超卖区和超买区时有颜色提示,你能根据这些信息做出正确的交易 请你制作一个 Stoch 指标模板命名为DYJ Stoch ,保存它 当你用鼠标单击超卖区或者超买区时,自动打开相应货币对   周期的 图表,并加载 Stoch 指标 INPUT InpPairs                      = "GBPUSD,EURUSD,USDJPY,USDCHF,XAUUSD,USDCAD,GBPJPY,EURJPY,EURGBP,EURAUD,EURNZD,EURCAD,CADJPY,AUDUSD,AUDNZD,AUDCAD,AUDJPY,NZDJPY,NZDUSD,NZDCAD,GBPAUD,GBPNZD,GBPCAD,CHFJPY,NZDCHF,AUDCHF,EURCHF";     InpStrategyMinTimeFrame         = PERIOD_M1 -- Strategy MinPeriod  InpStra
这个 DYJ SoarTrading 是基于 SoarSignal 指标,它能使用任何货币对和任何图表周期。 当SoarSignal交叉在oversold下方, 达到oversold区域,且它们的交叉又向上穿越oversold线时,多头进场。当SoarSignal交叉在overbought上方, 达到 overbought区域, 且它们的交叉又向下穿越overbought线时,空头进场。 当SoarSignal到达对侧的区域,如果对侧区域是overbought区域关闭多单,如果对侧区域是oversold区域关闭空单. 这个专家使用了资金管理,传统的止损、止盈、追踪止损。每次交易只有一个订单,这确保交易的最大安全。 输入参数 SoarSignal指标设置 nPeriod = 20 - 指标周期 zoneSELL = 80 - 超买水平(overbought) zoneBUY = 20 - 超卖水平(oversold) 风险管理 Risk_Management = Automatic - 自动管理风险. Auto_Risk_Percent = 2 - 2%的活动资金. Auto_Max_
DYJ Sharp
Daying Cao
DYJ Sharp高级算法,可检测新趋势和当前趋势延续,策略可用于入场和出场信号。策略在图表里显示了SHARP分界区域,区域有高位价格线HighLine和低位价格线LowLine。当K线的收盘价向上穿越区域 HighLine价格时与最低价向上穿越区域LowLine价格时是上涨信号,当K线收盘价下穿区域LowLine价格与最高价下穿HighLine价格时是下跌信号。每个货币对的信号显示在LAST SIGNALLED字段 输入参数 Paris - 指定货币对,以逗号分隔,例如 EURUSD,USDJPY,CADJPY MAX_BARS = 100 - 最大K线数量 nMinPeriod = D1 - 最小入场周期 nMaxPeriod = D1 - 最大入场周期 SendEmail = false - 通知你的邮箱 ShowAlert = true - 显示弹出报警窗口. MobileAlert = true - 通知到你的移动设备. MyMessage = 来自SHARP的消息. - 自定义消息 作者 Daying Cao, 我是一个具有丰富经验的软件工程师.
DYJ TRENDWAVE高级算法,检测新的趋势和当前趋势的延续,作为策略的入场信号。DYJ TRENDWAVE指标基于衡量多空双方的力量百分比,当空头(-)多头(+)趋势大于100%时产生信号。如果当前K线是阳线为多头入场信号,如果当前K线是阴线为空头入场信号,它使用多种滤波器对虚假信号过滤。 特点: 同时监视所有交易品种。 如果Pairs是空,指标默认监控报价窗口全部货币对,但用户可以选择喜欢的货币对. 监控每个时间段,从M1到MN。 仅在一个货币的某个图表周期(推荐H4或D1)运行指标. 输入参数: Pairs  --指定多货币符号,例如 EURUSD,USDJPY,CADJPY";为空时代表MARKET WATCH窗口的全部货币对 MinTimeFrame  = H1   --最小入场周期 MaxTimeFrame = MN   --最大入场周期 InpBuyColor = clrLime    --空头颜色. InpSellColor = clrWhite  --多头颜色. Send_Email = true       --发送邮件通知. Snow_Alert =
DYJTRENDWAVE高级算法,检测新的趋势和当前趋势的延续,作为策略的入场信号。DYJTRENDWAVE交易系统基于衡量多空双方的力量百分比,当空头(-)多头(+)趋势大于100%时产生信号。如果当前K线是阳线为多头入场信号,如果当前K线是阴线为空头入场信号,它使用多种滤波器对虚假信号过滤。EA离场规则是当有反信号时或止损或追踪止损或止盈。 EA的新闻交易是基于经典DYJTRENDWAVE趋势波策略的。您只需要从EA属性进行新闻时间和入场周期配置,其余部分由机器人自动处理。 EA默认是任何时间都能交易。3段工作时间参数是日内范围的。 例如,如果要设置从19:00 PM到05:00 AM的工作时间,则必须定义两个不同的时间间隔,例如19:00至23:59和00:00至05:00。 例如设置新闻时间是19:59 到 20:05,入场周期选择MinTimeFrame=M1至MaxTimeFrame=H1. 这个专家使用了资金管理,传统的止损、止盈、追踪止损。每次交易限定的订单数量,这确保交易的最大安全。 特点: 同时监视所有交易品种。 EA默认监控23个主流货币对,但用户可以选择喜欢的货
DYJ Scalping是一个全自动专家顾问。 随机指标过滤器用于入场条件。顾问需要对冲型、ECN账户类型 EA具备解套辅助策略,当方向错误时,自动激活解套策略,使其变为获利. 你可以随时禁用解套策略. 一般性建议 推荐ECN账户,XAUUSD点差在8到11或更低,EURUSD点差1 最低存款为200美元。 请在产品评论区下载XAUUSD and EURUSD设置文件 输入参数 InpLotsRisk                = 0.002  -- 批量风险x%, 如果余额为$10000与500杠杆,则默认为0.002%; 如果余额是$100或$200 与500杠杆 ,设置risk 0.1%; 如果 余额为$10000与 是2000杠杆,则rsik 0.008% 如果 余额为$100或$200与 是2000杠杆,则rsik 0.4% InpLots                      = 0      --  InpLots: 0-->自动 InpBlanceLimitMode   = EQUITY_LIMIT -- 净值限额模式,或删除EA               
DYJ T3ModeMA基于T3算法。 T3算法是在美国杂志《TASC》发表的文章《更好的移动平均线》中被引入技术分析领域的。 T3可以平滑价格序列,同时减少趋势跟踪系统的典型滞后。 该指标的柱形线尺寸决定入场信号,当柱形线尺寸趋于0时,则是趋势转折点。 该指标使用模拟交易技术, 指标为你提供评价开盘信号和收盘信号整体盈利。 你用哪种评估模式交易都很方便。 当你选择最大利润模型评估模型时, 建议您使用跟踪止损功能。 这样可以最大程度的跟踪趋势利润。 当您选择反向信号关闭评估模式时, 建议你耐心等待反信号出现,然后关闭仓位。 这个可以一直等趋势真正结束并盈利。 如果您需要自动化跟随指标开仓关仓,请下载实用工具软件 DYJ Follow Me Input [Indicator] InpMaMetod         = 2 -- Moving Average method(0~3):0-Simple averaging; 1-Exponential averaging; 2-Smoothed averaging;3-Linear-weighted averagin InpMaPer
DYJ Long term Strategy EA 是一个长线RSI交易系统。 我们在蜡烛中寻找最低价格作为多头趋势开始, 寻找最高价格位空头趋势开始, 我们会以最长时间持仓, 并且获得最大利润。 当订单方向错误时,策略能使其扭亏为盈。 EA仅仅在一个货币对图表任意周期运行 信号网址   参数 InpMagicNumber = 8257 InpIsDisplayInterface = true InpEAComment = LTS InpRStrategyTimeFrame = 1 Day InpLotsRisk = 0.0002 -- Lots Risk x%,default 0.002% if blance is 10000$ InpLots = 0.01 -- fixed lot [0-->Auto] InpMaxSpread = 100 Maxtrades = 1 InpDirection = Both InpFristOrderStep = 200 InpOrderStep = 200 InpTakeProfit = 0 InpStopLoss = 0 InpIsHi
DYJBands使用Bands带信号开仓关仓:当价格回落时,它在较低频段买进,而在较高频段卖出.在相反的信号下或通过止盈,止损,追踪止损关仓. 这个专家使用了资金管理,传统的止损,止盈,追踪止损.每次交易限定的订单数量,这确保交易的最大安全.EA不使用高风险的交易方法,并且可以在大多数货币对和时间范围内进行交易.此外,它不会花费太多,而且它的设置非常简单,这对有经验的和新手交易者都是有好处的.EA默认设置参数设置适合GBPUSD在图表周期H1运行.此外, EURUSD, USDJPY, USDCAD和XAUUSD或其他等货币对的设置将在评论部分提供. EA的新闻交易是基于经典DYJBands策略的。您只需要从EA属性参数进行新闻时间和入场周期配置,其余部分由机器人自动处理。例如设置新闻时间是19:59 到 20:05,入场周期选择TimeFrame=M1至TimeFrame=H1.EA默认是任何时间都能交易。3段工作时间参数是日内范围的。 例如,如果要设置从19:00 PM到05:00 AM的工作时间,则必须定义两个不同的时间间隔,例如19:00至23:59和00:00至05:00。
这个专家是一个独特的、易于使用的高质量的工具,因为我们纳入了MACD、Stochastic,RSI和ADX指标,EA使用趋势策略的优点在于保持长期盈利方向上才做单。它使用户的利润/损失有良好的组合实现。EA使用MACD与Stochastic,RSI和附属入场策略ADX指标查找信号。 入场规则: 多单:当在负值区域,MACD线向上穿越SIGNAL时,并且在MACD开仓水平下方时,同时Stochastic交叉在zoneBuy下方,然后又穿越zoneBuy线到zoneBuy上方时做多。 空单:当在正值区域,MACD线向下穿越SIGNAL线时,并且在MACD开仓水平的上方时,同时Stochastic交叉在zoneSell上方,然后又穿越到zoneSell的下方时做空。 退出规则: 多单:当在正值区域,MACD线向下穿越SIGNAL线时,并且在MACD关仓水平上方时关闭多单。 空单:当子啊负值区域,MACD线向上穿越SIGNAL线时,并且在关仓水平下方时关闭空单。 EA的新闻交易是基于经典DYMacdSto策略的。您只需要从EA属性参数进行新闻时间和入场周期配置,其余部分由机器人自动处理。
DYJ StrongCurrency EA是基于各种技术指标,移动平均线和枢轴的完整交易系统。这些元素中的每一个都可以通过定义的规则和系数进行评估(取决于指标),为DYJ StrongCurrency EA提供了无限优化的方案。DYJ StrongCurrency EA通过评估数据创建一个趋势强度和入场信号列表显示,它显示所有货币对的数据。根据每个货币对趋势强弱获得入场信号。列表数据包括Symbol,LastEntryies,LastPercent。其中LastEntryies,LastPercent内容显示入场价格,时间,货币对趋势百分比。趋势强度大于70%时,认为是强货币对;该工具适用于外汇市场,指数,金属的数据。 EA默认是任何时间都能交易。3段工作时间参数是日内范围的。 例如,如果要设置从19:00 PM到05:00 AM的工作时间,则必须定义两个不同的时间间隔,例如19:00至23:59和00:00至05:00。 EA的新闻交易是基于经典StrongCurrency趋势策略的。您只需要从EA属性进行新闻时间和入场周期配置,其余部分由机器人自动处理。 例如设置新闻时间是19:5
这个策略是基于自适应算法指标,自动寻找价格新低点与高点。这个DYJ TrendPending EA是实施这个规则开仓关仓的, 它使用风险最小的网格和加仓方法。并且可以附加正向和反向挂单,正向挂单可以降低网格和加仓次数,而反向挂单降低亏损概率。 EA的新闻交易是基于经典TrendPending策略的。您只需要从EA属性参数进行新闻时间和入场周期配置,其余部分由机器人自动处理。例如设置新闻时间是19:59 到 20:05,入场周期选择TimeFrame=M1至TimeFrame=H1.EA默认是任何时间都能交易。3段工作时间参数是日内范围的。 例如,如果要设置从19:00 PM到05:00 AM的工作时间,则必须定义两个不同的时间间隔,例如19:00至23:59和00:00至05:00。 EA默认设置参数设置适合EURGBP在图表周期H1运行. 此外, GBPUSD,EURUSD和XAUUSD或其他等货币对的设置将在评论部分提供. 推荐: EA 设置: 使用默认设置或set files. 货币对: EURGBP. 图表: H1. 账户:ECN经纪商, 低点差/手续费, 1:500 lev
这是一个多货币和多策略EA。该EA是在交易中创建一个或多个轮询交易的策略。 在轮询模式中,这些策略能应对各种复杂的市场环境,在交易中含有逆向策略。在趋势跟踪模式下,通过附加的主要趋势过滤器, DYJ's ArtOfForexWar 还可以在亏损趋势期间进行回撤交易。通常是在3单或3次平仓以内获利概率大于95%。 DYJ's ArtOfForexWar的新闻交易是基于多个趋势波策略的。您只需要从EA属性进行新闻时间和入场周期配置,其余部分由机器人自动处理。 DYJ's ArtOfForexWar默认是任何时间都能交易。3段工作时间参数是日内范围的。 例如,如果要设置从19:00 PM到05:00 AM的工作时间,则必须定义两个不同的时间间隔,例如19:00至23:59和00:00至05:00。 例如设置新闻时间是19:59 到 20:05,入场周期选择MinTimeFrame=M1至MaxTimeFrame=H1. 这个专家使用了资金管理,传统的止损、止盈、追踪止损。每次交易限定的订单数量,这确保交易的最大安全。 特点 同时监视所有交易品种。 EA默认监控35个主流货币对,但用户可
DYJ Scappingburg EA是一个全自动专家顾问。 Burg算法过滤器用于条目。顾问需要对冲和ECN账户类型。 如果订单方向错误, 订单损失将由解套策略使其扭亏为盈。 您可以随时禁用 解套 策略。 一般性建议 推荐ECN账户,xauusd点差在8和11之间或更低,欧元兑美元点差1 最低存款额是200美元。 请在产品评论区下载xauusd和EURUSD设置文件 Input Parameters [Burg] MinProfit                  =  160 -- Open positions if predicted profit >= MinProfit PastBars                   =  200     --   Number of past bars ModelOrder              =  0.37     --   Order of Burg model as a fraction of PastBars UseMOM                   =  true     --  
DYJ ArtOfMakingMoney attempts to gauge bullish and bearish forces in the market by using two separate measures, one for each type of directional pressure. The  EA's BearsIndex  attempts to measure the market's appetite for lower prices The EA's BullsIndex attempts to measure the market's appetite for higher prices Features Monitors all pairs at the same time. The EA monitors the top 35 pairs by default, but you can select less pairs if you wish. It is a multi-currency EA that can be run from a
DYJ Trend Analyst
Daying Cao
5 (1)
我们的目标是提供无障碍和高质量的服务,使市场参与者、交易员和分析师都能获得及时的市场行情的交易决策所需的市场观察指标。 这是最优化,高度稳健和易于使用的动态趋势分析指标。 DYJ市场观察指标试图用两种不同的方法来衡量市场的看涨和看跌力量,每种方法都有一种。 该指标的熊市指数尝试衡量市场对价格下降趋势。 该指标的牛市指数尝试衡量市场对价格上涨趋势。 Pivot是市场观察指标的额外指标。Pivot含有6种策略:经典,卡玛瑞拉,无敌,斐波纳奇,网络布局,黄金分割. 另外点评里,采用多个辅助指标RSI,MACD,MA,布林带等过滤假信号. 我们的Pivot指标是基于先进的算法计算支点和支持和阻力水平。 它们对未来重要的价格水平和可能的市场逆转做出难以置信的准确预测。 适用于所有市场(外汇、大宗商品、股票、指数和其他)和时间框架。 特点: 同时监视所有对。 默认情况下,指标监视报价窗口的全部货币对。 它只从一个图(m1到mn)运行。 参数: inplanguage = english  --  英语或中文 InpCalculationMode = CALC_MODE_CLA
筛选:
无评论
回复评论