Market Momentum
- Indicadores
-
Flavio Javier Jarabeck
 We are a closed brotherhood of traders whose ultimate goal is to profit through well-studied, structured, and automated trades. As a result, we publish dozens of MT5 indicators (FREE and paid) to the global MQL5 community. 80% of our published products are high-quality free indicators so beginner
 - Versão: 1.3
- Atualizado: 18 julho 2023
O indicador de Momento do Mercado é baseado no Oscilador de Zona de Volume (VZO), apresentado por Waleed Aly Khalil na edição de 2009 do jornal da Federação Internacional de Analistas Técnicos, e apresenta uma nova visão desses valiosos dados de mercado que muitas vezes são mal compreendidos e negligenciados: o VOLUME. Com essa nova abordagem de "ver" os dados de Volume, os traders podem inferir de maneira mais adequada o comportamento do mercado e aumentar suas chances em uma negociação bem-sucedida.
"O VZO é um oscilador de volume líder; sua utilidade básica está em fornecer sinais de compra/venda com base nas condições de volume, também para identificar condições de volume sobrecompradas/sobrevendidas, juntamente com situações de mega sobrecompra/sobrevenda que levam a uma mudança de sentimento e, muito provavelmente, levam à mudança da tendência atual no período de tempo em estudo."
"O preço é precedido pelo volume; essa é outra ideia importante na análise técnica. Se o volume começar a diminuir em uma tendência de alta, geralmente é um sinal de que o movimento ascendente está prestes a terminar."
"Acreditamos que o volume deve ter a mesma importância que o preço e deve ser monitorado de perto."
"Um dos principais benefícios do VZO é identificar em qual zona o volume está posicionado, para decidir em qual lado devemos apostar."
-- Waleed Aly Khalil
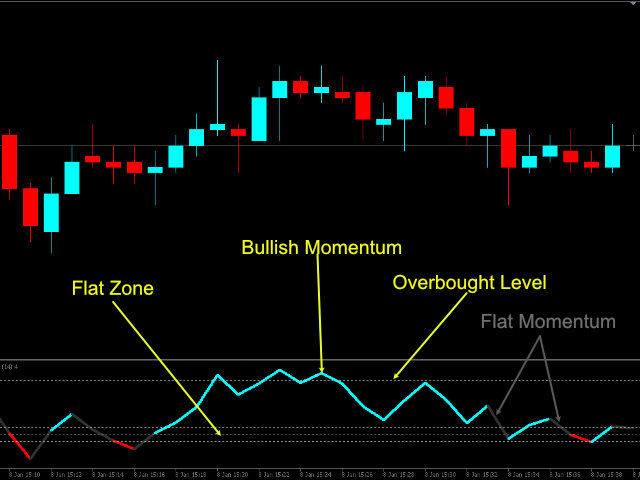
O indicador de Momento do Mercado guia visualmente os traders quando o mercado está acima ou abaixo da linha ZERO, indicando o provável "lado" do mercado. Você pode adaptar quando o indicador colorirá as linhas do oscilador alterando os valores "Flat".
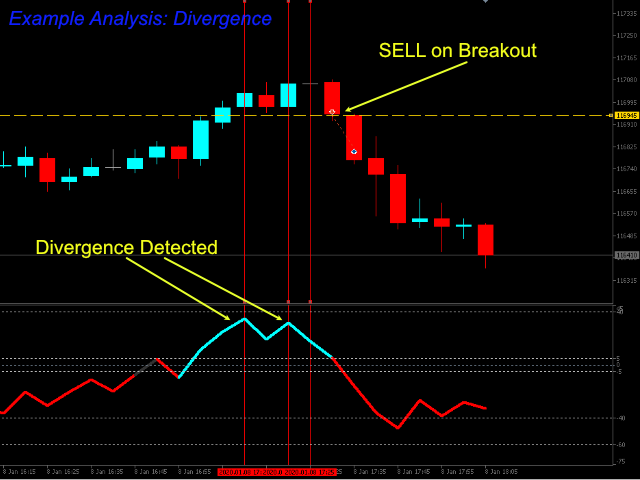
Você também pode testar a teoria da cruzamento dos limites de sobrecompra e sobrevenda. Ou, entrar nas Zonas e prestar atenção quando o oscilador sai das Zonas, observando divergências, etc...
Recomendo muito a leitura do artigo da IFTA para obter conhecimentos adicionais sobre o potencial deste indicador.
Aproveite!
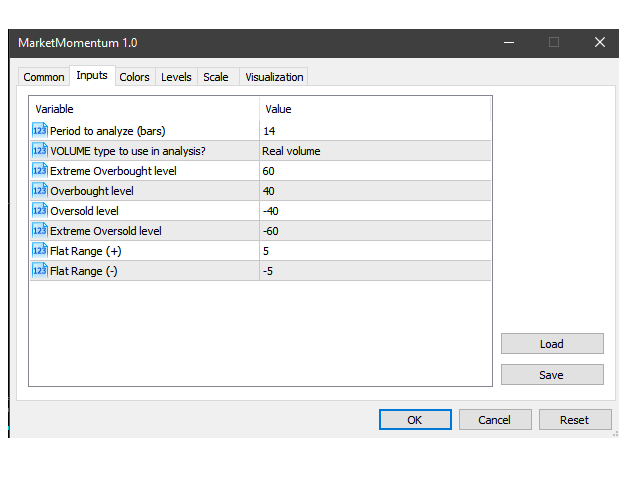
CONFIGURAÇÕES
- Período de Análise (barras)
- Tipo de Volume para Análise (Ticks ou Volume Real)
- Níveis do indicador da janela secundária para Sobrecompra, Sobrecompra Extrema, Sobrevenda, Sobrevenda Extrema e Níveis Flat.
- Todas as configurações ideais dependerão exclusivamente da análise sobre o Símbolo e o Período de Tempo que você pretende negociar.
- Este é um ótimo indicador, mas NÃO é mágico. Use-o com outras ferramentas/análises para aumentar as chances de sua negociação.
- Se você já conhece o poder da análise VZO e precisa de mais... Dê uma olhada no Market Momentum PRO aqui...
Se você gostou deste indicador, tudo o que peço é uma pequena Avaliação (não um Comentário, mas uma AVALIAÇÃO!)...
Isso significará MUITO para mim... E assim posso continuar oferecendo Coisas Legais de Graça...
Sem Compromissos! Nunca!
Vida Longa e Próspera!
;)


ok