WTR Dynamic Trend Ranges
- Indicadores
- Versão: 1.20
- Atualizado: 9 maio 2020
- Ativações: 5

CRAZY SALE! Was 250, NOW 50 USD till the end of MAY!!!
---> Check all the other products <---
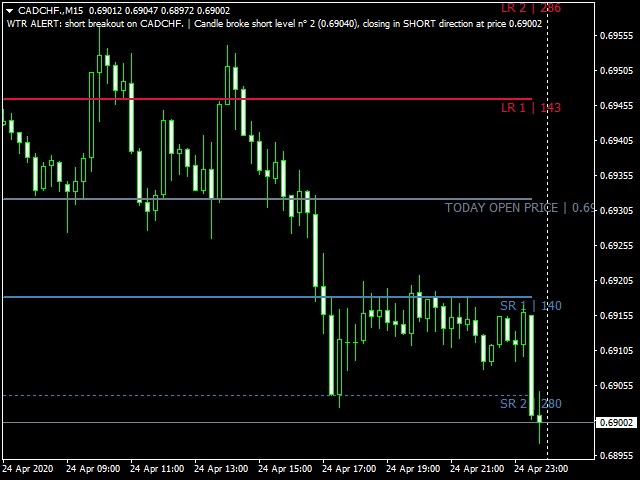
The WTR Dynamic Range Indicator is a powerful and deeply customizable range indicator that takes in account the average upward and downward movement of the price in the past trading days.
This fully customizable indicator can be setted for a lot of uses and cases:
• Trend trading on level breakouts
• Spotting high probability targets for Take Profits
• Setting a multiple
targets for position scaling out
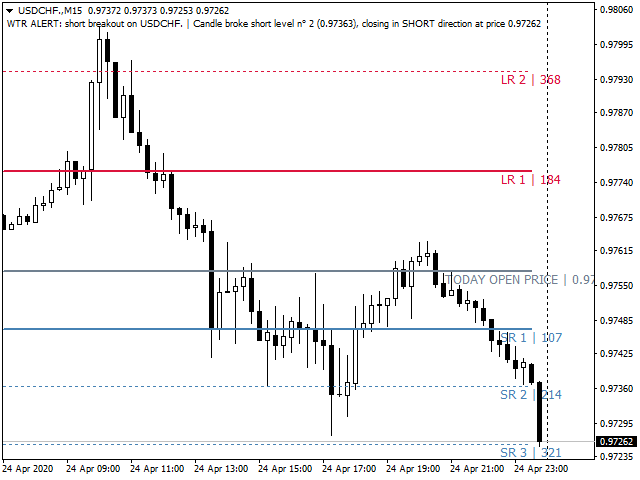
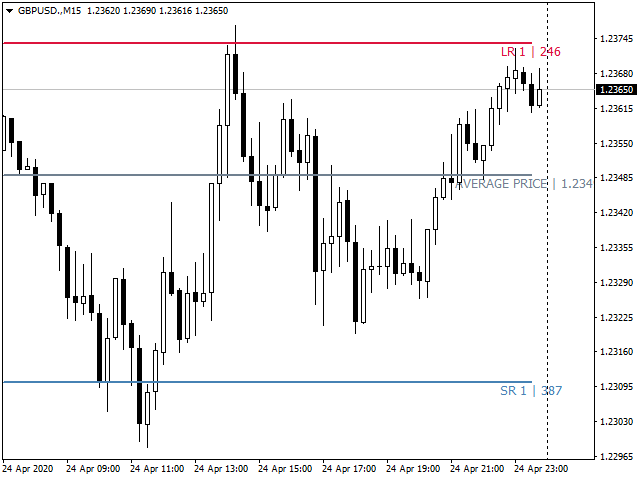
The WTR Dynamic Range Indicator calculates the average movements in the long side, then plot 4 projections of a percentage of this average. In the same ways it will plot the short side of the starting price.
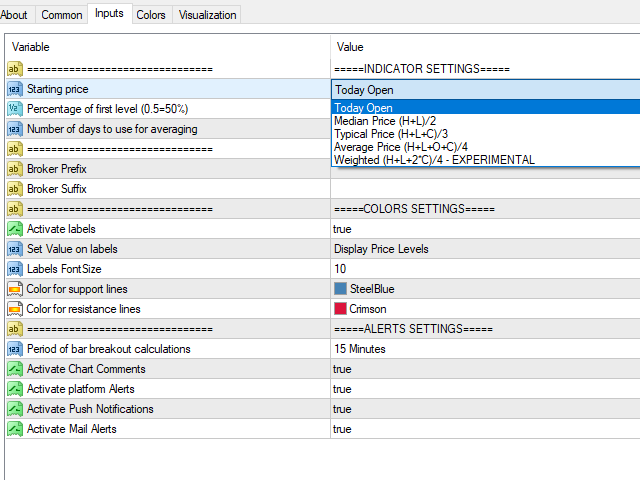
The first part of the indicator settings let you customize:
STARTING PRICE: choose between the day open price, the average price, the median price, the typical price and the weighted price to start plotting your ranges.
RANGE PERCENTAGE: choose the percentage of the range you want to plot both in the long side and in the short side
DAYS FOR AVERAGING: chose a longer day averaging
Then you can deeply trasnform the appearence, making the indicator:
SHOWING LABELS: turn on or off the
labels
SHOW PRICE LEVELS OR POINT RANGES: show the levels data in the way you like most
CUSTOMIZE COLORS: match your charting style with colors for dark or light themes
Never lose a signal
A powerful alert companion to spot every breakout of the levels, only in the trend direction (wich is strong reccomended)
Activate or deactivate COMMENTS, PUSH NOTIFICATIONS, PLATFORM ALERTS and MAIL ALERTS, choose also:
BREAKOUT CANDLE TIMEFRAME: spot your most liked Time frame to confirmation breakout candles.
DELAY BETWEEN ALERTS: too many notifications? Set a delay to bypass some of them!
FULL VERSION! To evaluate the product, try the demo or the free version (WORKING ONLY ON EURUSD) AVAILABLE HERE: https://www.mql5.com/en/market/product/49016/
---> Check all the other products <---
Produly developed by www.automazionetrading.com