Pivots Dashboard

5

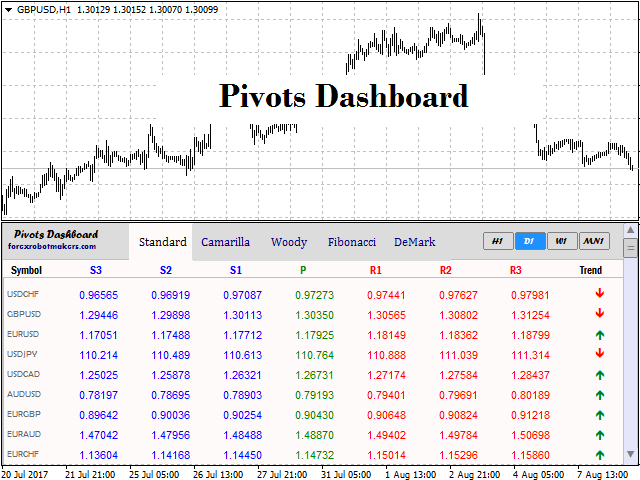
Pivots Dashboard is the single most complete instruments set for Pivot Points trading currently available in the market. We have done a comprehensive research prior to the product design to make sure that this product meets every need of Pivot Point trading.

Pivots Points are significant levels technical analysts can use to determine directional movement and potential support/resistance levels. Pivot Points are thus predictive or leading indicators. While the points were originally used by floor traders to set key levels to watch during the day, technical analysts have expanded upon the concepts to develop at least five (Standard, Camarilla, Woodie, Fibonacci, DeMark) different types of pivot points used in the modern day.


Features of Pivots Dashboard

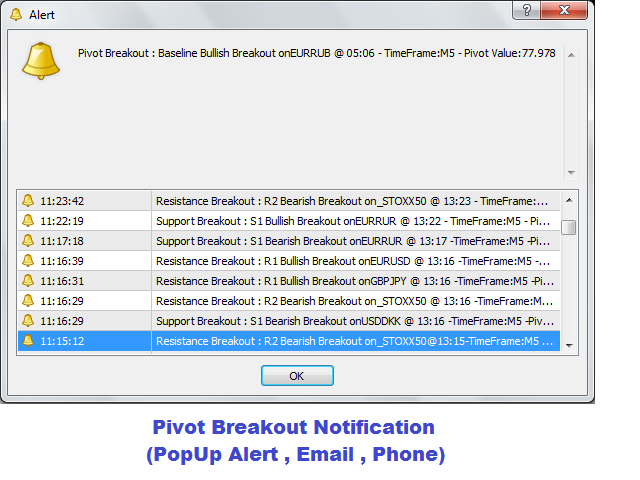
  • Pivot Level BreakOut Alert : The indicator notifies you when there is a breakout on any pivot level by x-pips (customizable).
  • The five (5) major Pivot Systems: This dashboard features the five major Pivot Point Systems which are Standard Pivot, Camarilla, Woodie, Fibonacci and DeMark.
  • Multi-Currency: The dashboard shows Pivot Statistics for all currency symbols in the Market Watch window.
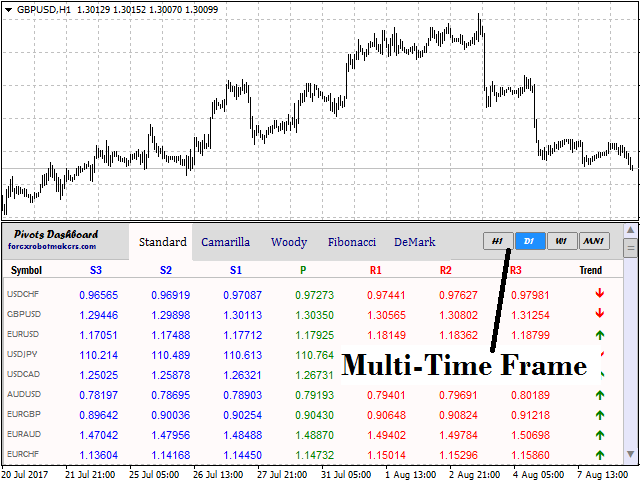
  • Multi-Timeframe: Pivots Dashboard has four (4) major timeframes including a user defined custom timeframe. The timeframes available include Daily, Weekly, Monthly and a user defined custom timeframe.
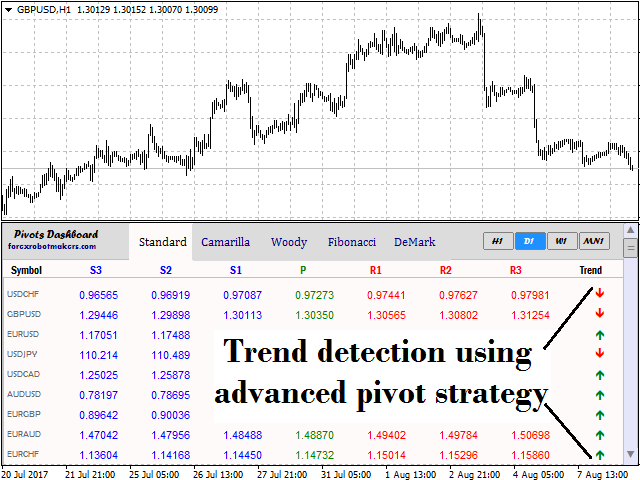
  • Trend Detection: The Dashboard displays the current market trend using an advanced Pivot Strategy.
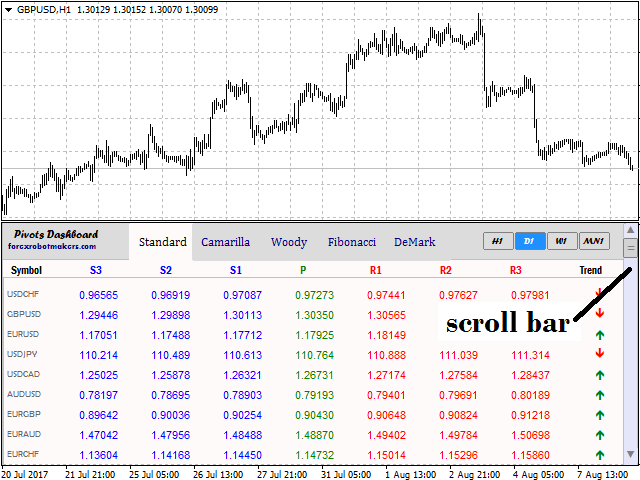
  • Scrollbar: The Dashboard has an in-built scrollbar for easy view.
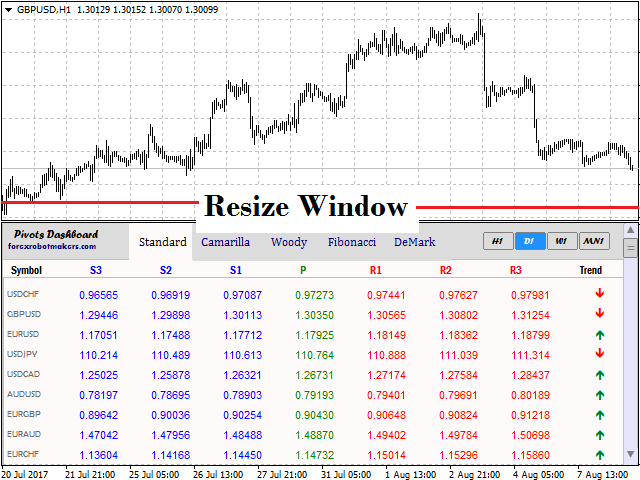
  • Window Resize: The Dashboard allows window resize for convenience and easy view.
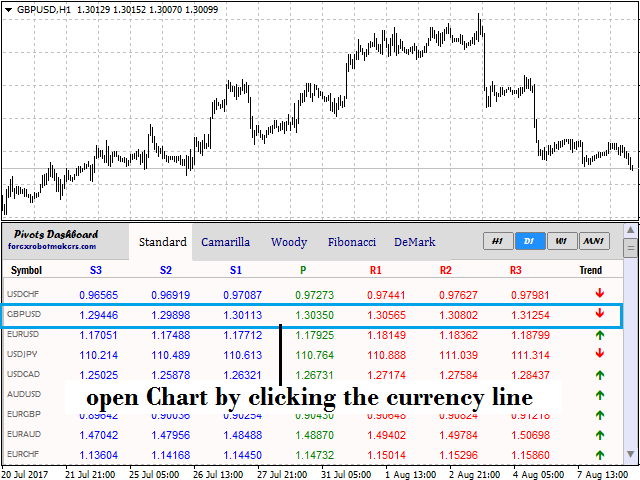
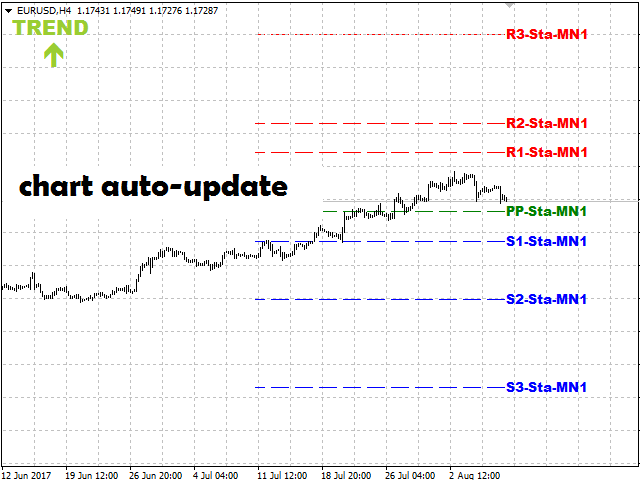
  • Chart Display and Update: On the click of any currency line on the dashboard, the chart of the pair is opened and the Pivot Lines are displayed on the chart. The pivots for every opened chart are auto-updated.
  • Novice and Pro compatibility: We have designed this product to be both easily usable by novice yet extensive for professionals. So, if you are a novice and do not want to concern yourself with Pivot Point technicalities, then just switch to Novice mode. If you are a professional and want to extensively define your pivot point levels, then just switch to Professional mode.


Using Pivot Points

Pivot Points can be used as a primary support and resistance level, thus making it a good spot to set your stop loss and take profits. Pivot Point levels along with other indicators can be used for trend detection and confirmation. As a rule of thumb, if the current price is above the Primary Pivot (PP), then the trend is bullish, and if the price is below the Primary Pivot, then the trend is bearish.


Settings

  • pivot_display_mode (Novice/ Professional): Dropdown menu to select the mode of pivot point display on the chart
  • line_display_mode: Dropdown menu, option 1 = right display, option 2 = full width display
  • chart_trend_display: Display trend on charts
  • default_chart: Default chart period when opening charts from dashboard
  • custom_time frame: User defined timeframe to use for Pivot Point calculation
  • daily_pivot_display: Enable/disable daily pivot lines if display mode is Professional
  • weekly_pivot_display: Enable/disable weekly pivot lines if display mode is Professional
  • monthly_pivot_display: Enable/disable monthly pivot lines if display mode is Professional
  • custom_pivot_display: Enable/disable custom pivot lines if display mode is Professional
  • Line_Style: Pivot Level lines styles
  • labels_display: Display Pivot Point labels
  • label_text_size: Text size
  • support_color: Support colors (S1, S2, S3)
  • resistance_color: Resistance colors (R1, R2, R3)
  • pivot point_color: Primary pivot color
  • label_text_color: Text colors
  • Upper Panel Color: Dashboard upper panel color
  • Fore Ground Color: Panel foreground color
  • Pivot Breakout Alert : Enable/Disable notification
  • Minimum Breakout Distnace(pips) : Breakout distance x-pips
  • Enable PopUp Notification : true/false
  • Enable Email Notification : true/false
  • Enable Phone Notification : true/false


YOU CAN NOW DOWNLOAD FREE VERSIONS OF OUR PAID INDICATORS . IT'S OUR WAY OF GIVING BACK TO THE COMMUNITY !

>>>  GO HERE TO DOWNLOAD


Comentários 3
Aravind Kolanupaka
9924
Aravind Kolanupaka 2020.06.18 21:17 
 

Very Good

Produtos recomendados
O indicador Crypto_Forex "Auto FIBO Pro" é uma ótima ferramenta auxiliar na negociação! - O indicador calcula e coloca automaticamente no gráfico os níveis de Fibonacci e as linhas de tendência locais (cor vermelha). - Os níveis de Fibonacci indicam áreas-chave onde o preço pode reverter. - Os níveis mais importantes são 23,6%, 38,2%, 50% e 61,8%. - Pode utilizá-lo para scalping de reversão ou para negociação de grelha de zona. - Existem muitas oportunidades para melhorar o seu sistema atual u
VR Cub
Vladimir Pastushak
VR Cub é um indicador para obter pontos de entrada de alta qualidade. O indicador foi desenvolvido para facilitar cálculos matemáticos e simplificar a busca por pontos de entrada em uma posição. A estratégia de negociação para a qual o indicador foi escrito tem provado a sua eficácia há muitos anos. A simplicidade da estratégia de negociação é a sua grande vantagem, o que permite que até mesmo os comerciantes novatos negociem com sucesso com ela. VR Cub calcula os pontos de abertura de posição e
O indicador SMC Venom Model BPR é uma ferramenta profissional para os traders que trabalham com o conceito Smart Money (SMC). Identifica automaticamente dois padrões principais no gráfico de preços: FVG   (Fair Value Gap) é uma combinação de três velas, em que existe um gap entre a primeira e a terceira velas. Forma uma zona entre níveis onde não há suporte de volume, o que geralmente leva a uma correção de preço. BPR   (Balanced Price Range) é uma combinação de dois padrões FVG que formam uma “
The Th3Eng PipFinite indicator is based on a very excellent analysis of the right trend direction with perfect custom algorithms. It show the true direction and the best point to start trading. With StopLoss point and Three Take Profit points. Also it show the right pivot of the price and small points to order to replace the dynamic support and resistance channel, Which surrounds the price. And Finally it draws a very helpful Box on the left side on the chart includes (take profits and Stop loss
PZ Harmonacci Patterns
PZ TRADING SLU
3.17 (6)
Este é sem dúvida o indicador de reconhecimento automático de formação de preço harmônico mais completo que você pode encontrar para a MetaTrader Platform. Ele detecta 19 padrões diferentes, leva as projeções de Fibonacci tão a sério quanto você, exibe a Zona de Reversão Potencial (PRZ) e encontra níveis adequados de stop loss e take-profit. [ Guia de instalação | Guia de atualização | Solução de problemas | FAQ | Todos os produtos ] Detecta 19 formações harmônicas de preços diferentes Traça
Trend Ray
Andriy Sydoruk
The indicator shows the potential trend direction by cyclical-wave dependence. Thus, all the rays of the intersection will be optimal rays, in the direction of which the price is expected to move, taking into account the indicator period. Rays can be used as a direction for potential market movement. But we must not forget that the approach must be comprehensive, the indicator signals require additional information to enter the market.
Super Reversal Pattern
Parfait Mujinga Ndalika
Super Reversal Pattern Indicator Unlock the power of advanced pattern recognition with our Super Reversal Pattern Indicator. Designed for traders seeking precision and reliability, this indicator identifies one of the most effective reversal patterns in technical analysis, offering a significant edge in your trading strategy. Key Features: Non-Repainting Accuracy: Enjoy the confidence of non-repainting technology. Once a Super Reversal Pattern is detected, it remains static, providing consiste
Daily Candle Predictor é um indicador que prevê o preço de fechamento de uma vela. O indicador destina-se principalmente ao uso em gráficos D1. Este indicador é adequado tanto para negociação forex tradicional quanto para negociação de opções binárias. O indicador pode ser usado como um sistema de negociação autônomo ou pode atuar como um complemento ao seu sistema de negociação existente. Este indicador analisa a vela atual, calculando certos fatores de força dentro do próprio corpo da vela, be
Noize Absorption Index MT4
Ekaterina Saltykova
5 (1)
Noize Absorption Index - is the manual trading system that measures the difference of pressure between bears forces and bulls forces. Green line - is a noize free index that showing curent situation. Zero value of index shows totally choppy/flat market.Values above zero level shows how powerfull bullish wave is and values below zero measures bearish forces.Up arrow appears on bearish market when it's ready to reverse, dn arrow appears on weak bullish market, as a result of reverse expectation. S
Owl smart levels
Sergey Ermolov
4.24 (37)
Versão MT5  |  FAQ O   Indicador Owl Smart Levels   é um sistema de negociação completo dentro de um indicador que inclui ferramentas populares de análise de mercado, como   fractais avançados de Bill Williams , Valable ZigZag que constrói a   estrutura de onda correta   do mercado e   níveis de Fibonacci que marcam os níveis exatos de entrada no mercado e lugares para obter lucros. Descrição detalhada da estratégia Instruções para trabalhar com o indicador Consultor de negociação Owl Helper Ch
Gold Titan King Scalper
Dodong Christian Arnon
Indicator Description GOLD TITAN KING SIGNAL INDICATOR High-Precision Gold Scalping Buy/Sell Signals – Manual Trading Assistant Overview The Gold Titan King Signal Indicator is a manual trading assistant tool designed for high-frequency scalping on Gold (XAUUSD) and other major pairs. It generates clear BUY/SELL signals with precise entry levels, along with adjustable Stop Loss and Take Profit levels displayed directly on the chart. ️ This tool is NOT an EA. It does not execute trades
RSI Speed mp
DMITRII GRIDASOV
Indicador Crypto_Forex "RSI SPEED" para MT4 - ótima ferramenta preditiva, sem necessidade de repintura. - O cálculo deste indicador é baseado em equações da física. O RSI SPEED é a primeira derivada do próprio RSI. - O RSI SPEED é bom para entradas de scalping na direção da tendência principal. - Use-o em combinação com um indicador de tendência adequado, por exemplo, HTF MA (como nas imagens). - O indicador RSI SPEED mostra a rapidez com que o próprio RSI muda de direção - ele é muito sensíve
YK-Fibo Pivot Indicator: Trade Smarter with Fibonacci Pivot Points The YK-Fibo Pivot Indicator is a powerful technical analysis tool that combines the precision of Fibonacci retracements with the insights of Pivot Points. Whether you're a novice or seasoned trader, this indicator empowers you to spot profitable opportunities in the market with ease. Why Choose YK-Fibo Pivot? Pinpoint Support & Resistance: By calculating Fibonacci levels based on the previous day's high, low, and close prices, y
Indicador Crypto_Forex "Morning Star pattern" para MT4. - O indicador "Morning Star pattern" é um indicador muito poderoso para negociação de Price Action: sem repintura, sem atraso. - O indicador detecta padrões Morning Star otimistas no gráfico: sinal de seta azul no gráfico (veja as imagens). - Com alertas para PC, celular e e-mail. - Também seu irmão - o indicador bearish "Evening Star pattern" está disponível (siga o link abaixo). - O indicador "Morning Star pattern" é excelente para comb
Free automatic Fibonacci is an indicator that automatically plots a Fibonacci retracement based on the number of bars you select on the BarsToScan setting in the indicator. The Fibonacci is automatically updated in real time as new highest and lowest values appears amongst the selected bars. You can select which level values to be displayed in the indicator settings. You can also select the color of the levels thus enabling the trader to be able to attach the indicator several times with differe
FREE
This is a new strategy for SUPPLY DEMAND areas It is based on a calculation using the tick volume to detect the big price action in market for both bear /bull actions this smart volume action candles are used to determine the supply and demand areas prices in between main supply and demand lines indicate sideway market  up arrows will be shown when prices moves above the main supply and the secondary supply lines Down arrows will be shown when prices moves below the main demand and the secondary
Intraday Levels shows intraday levels grid for intraday trading Shows a grid for the day levels, gives you a guide to know the trend and to measure intraday trades (stop-loss and take-profit). Parameters are: Levels Mode: Basic mode: Shows highest, lowest and middle levels. Advanced mode: Shows highest, lowest, middle and intermediate levels. Fibonacci mode: Shows session Fibonacci retracements levels. Momentum mode: Shows delayed Advanced levels to identify momentum. Smooth Period (Momentum m
EARLY REMINDER: The Starting price is 65 price will rise soon up to 365$ and then 750$ after first 10 copies of sales. Grab this offer now! Introduction Hello, traders! Welcome to the demonstration of the Forex Beast Indicator , a comprehensive tool designed to assist aspiring traders in navigating the complexities of the forex market. This indicator incorporates seven essential components to provide a well-rounded trading experience: Moving Averages Colored Zones Support and Resistance Levels
Double HMA lines MTF
Pavel Zamoshnikov
5 (1)
This is a multi-timeframe version of the popular Hull Moving Average (HMA). The Double HMA MTF Light indicator combines two timeframes on a single chart. The HMA of the higher timeframe defines the trend, and the HMA of the current timeframe defines short-term price movements. The indicator is freely distributed and hasn't audio signals or messages. Its main function is the visualization of price movements. If you need advanced functionality of the HMA multi-timeframe indicator (information ab
FREE
Classic Fractals indicator for MT4, with additional Trendlines connecting the latest couples of fractals ( fractals are showing highest high, and lowest low on each period) Rules for trendlines: -if new top fractal is below the last one = new resistance line -if new bot fractal is above the last one = new support line -Trendlines can be hidden -Fractals can be hidden Fractal Period = can be both even or uneven number, as it is setting for half (one side) of the bars sequence for findin
Antabod Gamechanger
Rev Anthony Olusegun Aboderin
*Antabod GameChanger Indicator – Transform Your Trading!*   Are you tired of chasing trends too late or second-guessing your trades? The *Antabod GameChanger Indicator* is here to *revolutionize your trading strategy* and give you the edge you need in the markets!   Why Choose GameChanger? *Accurate Trend Detection* – GameChanger identifies trend reversals with *pinpoint accuracy*, ensuring you enter and exit trades at the optimal time.   *Clear Buy & Sell Signals* – No more guesswork! T
O indicador Morning Star PRT utiliza o princípio do rompimento plano matinal. O indicador exibe os níveis planos matinais e mostra os possíveis objetivos. Foi adicionado um nível Fibonacci adicional ao indicador, bem como alertas sonoros sobre a interseção de ambos os níveis alvo especificados nas definições e o nível noturno plano. O indicador Morning Star PRT constrói um canal noturno plano no final da noite, bem como dois níveis de preços de Fibonacci para cima e para baixo. Estes níveis p
The indicator displays the data of the Stochastic oscillator from a higher timeframe on the chart. The main and signal lines are displayed in a separate window. The stepped response is not smoothed. The indicator is useful for practicing "manual" forex trading strategies, which use the data from several screens with different timeframes of a single symbol. The indicator uses the settings that are identical to the standard ones, and a drop-down list for selecting the timeframe. Indicator Paramet
Trend Oscillator - é um indicador Crypto_Forex personalizado avançado, uma ferramenta de negociação eficiente! - É utilizado um novo método de cálculo avançado - 20 opções para o parâmetro "Preço para cálculo". - O oscilador mais suave alguma vez desenvolvido. - Cor verde para tendências ascendentes, cor vermelha para tendências descendentes. - Valores de sobrevenda: abaixo de 5, Valores de sobrecompra: acima de 95. - Existem muitas oportunidades para atualizar até mesmo as estratégias padrão
Trendiness Index
Libertas LLC
5 (3)
"The trend is your friend" is one of the best known sayings in investing, because capturing large trendy price movements can be extremely profitable. However, trading with the trend is often easier said than done, because many indicators are based on price reversals not trends. These aren't very effective at identifying trendy periods, or predicting whether trends will continue. We developed the Trendiness Index to help address this problem by indicating the strength and direction of price trend
Laguerre SuperTrend Clouds adds an Adaptive Laguerre averaging algorithm and alerts to the widely popular SuperTrend indicator. As the name suggests, Laguerre SuperTrend Clouds (LSC) is a trending indicator which works best in trendy (not choppy) markets. The SuperTrend is an extremely popular indicator for intraday and daily trading, and can be used on any timeframe. Incorporating Laguerre's equation to this can facilitate more robust trend detection and smoother filters. The LSC uses the impro
Fibonacci recontratar e extensão linha de desenho ferramenta Fibonacci recontratar e estender a ferramenta de desenho de linha para a plataforma MT4 é adequado para comerciantes que usam método de negociação de pontos e negociação de secções douradas Vantagens: Não há linha extra, não há linhagem muito longa, e é fácil observar e encontrar oportunidades de negociação Versão experimental: https://www.mql5.com/zh/market/product/35884 Principais funções: 1. Podem ser desenhados diretamente vári
Awesome Oscillator by Bill Williams with the ability to fine-tune and replace the averaging algorithms of the indicator, which significantly expands the possibilities of using this oscillator in algorithmic trading and brings it closer in its properties to such an indicator as the MACD. To reduce price noise, the final indicator is processed with an additional Smooth averaging. The indicator has the ability to give alerts, send mail messages and push signals when the direction of movement of th
Fibonacci Magic Pivot Levels
Savia Forex Software Solutions
Fibonacci Magic Pivot Levels The  Fibonacci Magic Pivot Levels  is a  powerful yet easy to use indicator . It   continuously monitor s intra-day  price action  and uses complex algorithms to calculate and detect key support, resistance and pivot levels, using the D1 timeframe as a filter.  The    Fibonacci Magic Pivot Levels is optimized for H4, H1, M30, M15, M5 & M1 timeframes and  can be used on ALL Currencies, Indices, Commodities, and Cryptocurrency pairs . Trade with improved confidence an
The   Trend Duration Forecast MT4   indicator is designed to estimate the probable lifespan of a bullish or bearish trend. Using a Hull Moving Average (HMA) to detect directional shifts, it tracks the duration of each historical trend and calculates an average to forecast how long the current trend is statistically likely to continue. This allows traders to visualize both real-time trend strength and potential exhaustion zones with exceptional clarity. KEY FEATURES Dynamic Trend Detection:   Uti
Os compradores deste produto também adquirem
Precautions for subscribing to indicator This indicator only supports the computer version of MT4 Does not support MT5, mobile phones, tablets The indicator only shows the day's entry arrow The previous history arrow will not be displayed (Live broadcast is for demonstration) The indicator is a trading aid Is not a EA automatic trading No copy trading function The indicator only indicates the entry position No exit (target profit)  The entry stop loss point is set at 30-50 PIPS Or the front hi
Indicador Miraculous – Ferramenta 100% Não Repintável para Forex e Opções Binárias Baseada no Quadrado de Nove de Gann Este vídeo apresenta o Indicador Miraculous , uma ferramenta de negociação altamente precisa e poderosa, desenvolvida especificamente para traders de Forex e Opções Binárias . O que torna este indicador único é a sua base no lendário Quadrado de Nove de Gann e na Lei da Vibração de Gann , tornando-o uma das ferramentas de previsão mais precisas disponíveis na negociação moderna.
Volatility Trend System - um sistema de negociação que dá sinais para entradas. O sistema de volatilidade fornece sinais lineares e pontuais na direção da tendência, bem como sinais para sair dela, sem redesenho e atrasos. O indicador de tendência monitora a direção da tendência de médio prazo, mostra a direção e sua mudança. O indicador de sinal é baseado em mudanças na volatilidade e mostra entradas no mercado. O indicador está equipado com vários tipos de alertas. Pode ser aplicado a vários i
Actualmente 40% OFF ! A melhor solução para qualquer novato ou comerciante especializado! Este software de painel de instrumentos está a funcionar em 28 pares de moedas. É baseado em 2 dos nossos principais indicadores (Advanced Currency Strength 28 e Advanced Currency Impulse). Dá uma grande visão geral de todo o mercado Forex. Mostra valores avançados de força da moeda, velocidade de movimento da moeda e sinais para 28 pares de divisas em todos os (9) períodos de tempo. Imagine como a sua n
Looking for a powerful yet lightweight swing detector that accurately identifies market structure turning points? Want clear, reliable buy and sell signals that work across any timeframe and any instrument? Buy Sell Arrow MT Swing is built exactly for that — precision swing detection made simple and effective. This indicator identifies Higher Highs (HH) , Higher Lows (HL) , Lower Highs (LH) , and Lower Lows (LL) with remarkable clarity. It is designed to help traders easily visualize market str
FX Power MT4 NG
Daniel Stein
4.95 (21)
FX Power: Analise a Força das Moedas para Decisões de Negociação Mais Inteligentes Visão Geral FX Power é a sua ferramenta essencial para compreender a força real das principais moedas e do ouro em quaisquer condições de mercado. Identificando moedas fortes para comprar e fracas para vender, FX Power simplifica as decisões de negociação e revela oportunidades de alta probabilidade. Quer você prefira seguir tendências ou antecipar reversões usando valores extremos de Delta, esta ferramenta adap
Scalper Inside PRO
Alexey Minkov
4.74 (69)
* CURRENT 20% SALE * LIMITED TIME OFFER * An exclusive indicator that utilizes an innovative algorithm to swiftly and accurately determine the market trend. The indicator automatically calculates opening, closing, and profit levels, providing detailed trading statistics. With these features, you can choose the most appropriate trading instrument for the current market conditions. Additionally, you can easily integrate your own arrow indicators into Scalper Inside Pro to quickly evaluate their st
"Dragon's Tail" is an integrated trading system, not just an indicator. This system analyzes each candle on a minute-by-minute basis, which is particularly effective in high market volatility conditions. The "Dragon's Tail" system identifies key market moments referred to as "bull and bear battles". Based on these "battles", the system gives trade direction recommendations. In the case of an arrow appearing on the chart, this signals the possibility of opening two trades in the indicated directi
Super Signal – Skyblade Edition Sistema profissional de sinais de tendência sem repintar / sem atraso com taxa de acerto excepcional | Para MT4 / MT5 Funciona melhor em timeframes mais curtos, como 1 minuto, 5 minutos e 15 minutos. Principais características: Super Signal – Skyblade Edition é um sistema inteligente de sinais desenvolvido especificamente para operações com tendência. Utiliza uma lógica de filtragem em múltiplas camadas para detectar apenas movimentos direcionais fortes sustenta
Pulse Scalping Line - an indicator for identifying potential pivot points. Based on this indicator, you can build an effective Martingale system. According to our statistics, the indicator gives a maximum of 4 erroneous pivot points in a series. On average, these are 2 pivot points. That is, the indicator shows a reversal, it is erroneous. This means that the second signal of the indicator will be highly accurate. Based on this information, you can build a trading system based on the Martingale
MetaForecast M4
Vahidreza Heidar Gholami
5 (2)
MetaForecast prevê e visualiza o futuro de qualquer mercado com base nas harmonias nos dados de preços. Embora o mercado nem sempre seja previsível, se houver um padrão nos preços, o MetaForecast pode prever o futuro com a maior precisão possível. Em comparação com outros produtos similares, o MetaForecast pode gerar resultados mais precisos ao analisar as tendências do mercado. Parâmetros de entrada Past size (Tamanho do passado) Especifica o número de barras que o MetaForecast usa para criar
Um indicador técnico que estrutura gráficos e identifica movimentos cíclicos de preços. Pode funcionar em qualquer gráfico. Vários tipos de notificações. Existem setas adicionais no próprio gráfico. Sem redesenhar a história, trabalha no fecho da vela. TF recomendado a partir de M5 e superior. Parâmetros fáceis de utilizar e configurar. Ao utilizar 2 indicadores com parâmetros diferentes, pode utilizá-los sem outros indicadores. Tem 2 parâmetros de entrada Ciclicidade e duração do sinal Estes
Atomic Analyst
Issam Kassas
5 (3)
Primeiramente, vale ressaltar que este Indicador de Negociação não repinta, não redesenha e não apresenta atrasos, tornando-o ideal tanto para negociação manual quanto automatizada. Manual do utilizador: configurações, entradas e estratégia. O Analista Atômico é um Indicador de Ação de Preço PA que utiliza a força e o momentum do preço para encontrar uma vantagem melhor no mercado. Equipado com filtros avançados que ajudam a remover ruídos e sinais falsos, e aumentam o potencial de negociação.
Introducing a powerful, precision-engineered indicator that seamlessly combines Pivot Points, Moving Averages, and Multi-Timeframe Analysis to deliver high-probability Buy and Sell signals in real-time. This tool is your strategic edge, designed to identify trend reversals, market momentum, and optimal trade entries, no matter your preferred trading style. Our algorithm goes beyond standard indicators—by analyzing multiple timeframes simultaneously, it spots true market turning points while fi
Shogun Trade
Yuki Miyake
5 (2)
SHOGUN Trade - The Shocking Truth of 16 Years Unoptimized. Shogun Trading February Special Sale – Only $88 (Regular Price $199)! This special offer is available until February 28th . As we are dedicated to further product development and optimization , we are offering this discount in exchange for your valuable feedback. Your insights will directly influence our next round of updates and feature enhancements. Price: $88 (Special discount from $199) Requirement: Please leave a review and share
First 25 copies at $80, after that price becomes $149 (3 copies left) Gold Signal Pro is a powerful MT4 indicator designed to help traders spot strong price reactions in the market. It focuses on clear wick rejections , showing when price strongly rejects a level and often continues in the same direction. Gold Signal Pro is mainly built for scalping gold (XAUUSD) and works best on lower timeframes like M5 and M15 , where timing matters most. That said, it can also be used on any forex pair, a
RFI levels PRO
Roman Podpora
5 (1)
O indicador mostra com precisão os pontos de reversão e as zonas de retorno de preço onde o   Principais players . Você identifica onde novas tendências estão se formando e toma decisões com máxima precisão, mantendo o controle sobre cada negociação. VERSION MT5     -     Revela seu potencial máximo quando combinado com o indicador   TREND LINES PRO. O que o indicador mostra: Estruturas de reversão e níveis de reversão com ativação no início de uma nova tendência. Exibição dos níveis de   TAKE
Meravith
Ivan Stefanov
5 (3)
Ferramenta dos market makers. O Meravith irá: Analisar todos os timeframes e exibir a tendência atual em vigor. Destacar zonas de liquidez (equilíbrio de volume) onde o volume comprador e vendedor é igual. Mostrar todos os níveis de liquidez de diferentes timeframes diretamente no seu gráfico. Gerar e apresentar análise de mercado em formato de texto para sua referência. Calcular alvos, níveis de suporte e pontos de stop-loss com base na tendência atual. Calcular a relação risco/retorno das sua
Beast Super Signal
Dustin Vlok
4.73 (89)
Procurando por um poderoso indicador de negociação forex que possa ajudá-lo a identificar oportunidades de negociação lucrativas com facilidade? Não procure mais do que o Beast Super Signal. Este indicador baseado em tendências fácil de usar monitora continuamente as condições do mercado, procurando por novas tendências em desenvolvimento ou aproveitando as já existentes. O Beast Super Signal dá um sinal de compra ou venda quando todas as estratégias internas se alinham e estão em 100% de conflu
Se você comprar este indicador, receberá meu Gerenciador de Operações Profissional   + EA  GRATUITAMENTE. Primeiramente, vale ressaltar que este Sistema de Trading é um Indicador Não Repintado, Não Redesenho e Não Atrasado, o que o torna ideal tanto para o trading manual quanto para o automatizado. Curso online, manual e download de predefinições. O "Sistema de Trading Inteligente MT5" é uma solução completa de trading projetada para traders novos e experientes. Ele combina mais de 10 indicador
Uma implementação pessoal de blocos de pedidos, uma estratégia de negociação de posição simples, mas eficaz. O negociador deve entrar no mercado ou procurar negociações na direção do último bloco de ordem, se a faixa de preço não foi violada na direção oposta ao rompimento. Blocos abertos não são desenhados para maior clareza. [ Guia de instalação | Guia de atualização | Solução de problemas | FAQ | Todos os produtos ] Um bloco aberto de alta é a primeira barra de alta após uma nova baixa do me
Trend Screener
STE S.S.COMPANY
4.79 (95)
Indicador de tendência, solução única inovadora para negociação e filtragem de tendências com todos os recursos de tendências importantes construídos dentro de uma ferramenta! É um indicador multi-timeframe e multi-moedas 100% sem repintura que pode ser usado em todos os símbolos/instrumentos: forex, commodities, criptomoedas, índices e ações. OFERTA POR TEMPO LIMITADO: O indicador Support and Resistance Screener está disponível por apenas US$ 50e vitalício. (Preço original US$ 250) (oferta este
- Real price is 200$ - 50% Discount (It is 99$ now) -   It is enabled for 3 purchases. Contact me for extra bonus (Gann Trend   indicator), instruction or any questions! - Non-repaint, No lag - I just sell my products in Elif Kaya Profile, any other websites are stolen old versions, So no any new updates or support. - Lifetime update free Gann Gold EA MT5 Introduction W.D. Gann’s theories in technical analysis have fascinated traders for decades. It offers a unique approach beyond traditional c
Sinal de tendência GoldRush Arrow O indicador Sinal de tendência GoldRush Arrow fornece uma análise precisa e em tempo real das tendências, adaptada para scalpers de alta velocidade e curto prazo em XAU/USD. Criada especificamente para o intervalo de tempo de 1 minuto, esta ferramenta exibe setas direcionais para pontos de entrada claros, permitindo que os scalpers naveguem em condições de mercado voláteis com confiança. O indicador consiste em setas de alerta PRIMÁRIAS e SECUNDÁRIAS. Os sin
Presenting one-of-a-kind Gann Indicator for XAUUSD IQ Gold Gann Levels is a non-repainting, precision tool designed exclusively for XAUUSD/Gold intraday trading. It uses W.D. Gann’s square root method to plot real-time support and resistance levels, helping traders spot high-probability entries with confidence and clarity. William Delbert Gann (W.D. Gann) was an exceptional market analyst whose trading technique was based on a complex blend of mathematics, geometry, astrology, and ancient calcul
TPSpro RFI Levels
Roman Podpora
4.86 (28)
INSTRUÇÕES RUS  /  INSTRUÇÕES   ENG  /  Versão MT5 Principais funções: Exibe zonas ativas de vendedores e compradores! O indicador exibe todos os níveis/zonas de impulso iniciais corretos para compras e vendas. Quando esses níveis/zonas são ativados, onde a busca por pontos de entrada começa, os níveis mudam de cor e são preenchidos com cores específicas. Setas também aparecem para uma percepção mais intuitiva da situação. LOGIC AI - Exibição de zonas (círculos) para busca de pontos de entrada
SMC Easy Signal
Mohamed Hassan
4.71 (14)
SMC Easy Signal was built to remove the confusion around the smart money concept by turning structural shifts like BOS (Break of Structure) and CHoCH (Change of Character) into simple buy and sell trading signals. It simplifies market structure trading by automatically identifying breakouts and reversals as they happen, allowing traders to focus on execution rather than analysis. Whether the market is continuing its trend or preparing to reverse, the indicator translates complex price action in
Dynamic Forex28 Navigator
Bernhard Schweigert
4.43 (7)
Dynamic Forex28 Navigator - A ferramenta de negociação Forex de última geração. ATUALMENTE 49% DE DESCONTO. Dynamic Forex28 Navigator é a evolução dos nossos indicadores populares de longa data, combinando o poder de três em um: Indicador Advanced Currency Strength28 (695 avaliações) + Advanced Currency IMPULSE com ALERTA (520 avaliações) + Sinais CS28 Combo (Bônus). Detalhes sobre o indicador https://www.mql5.com/en/blogs/post/758844 O que o Next-Generation Strength Indicator oferece?  Tudo
FX Volume
Daniel Stein
4.63 (38)
FX Volume: Vivencie o Verdadeiro Sentimento de Mercado sob a Perspectiva de um Corretor Visão Geral Rápida Quer aprimorar sua abordagem de trading? FX Volume fornece insights em tempo real sobre como traders de varejo e corretores estão posicionados—bem antes de relatórios atrasados como o COT. Seja para buscar ganhos consistentes ou simplesmente ter uma vantagem mais clara no mercado, FX Volume ajuda você a detectar grandes desequilíbrios, confirmar rompimentos e aperfeiçoar sua gestão de ris
Este painel mostra os últimos padrões harmónicos disponíveis para os símbolos seleccionados, pelo que poupará tempo e será mais eficiente / versão MT5 . Indicador gratuito: Basic Harmonic Pattern Colunas do indicador Symbol : aparecem os símbolos seleccionados Trend : de alta ou de baixa Pattern : tipo de padrão (gartley, borboleta, morcego, caranguejo, tubarão, cifra ou ABCD) Entry : preço de entrada SL: preço de paragem de perda TP1: preço do 1º take profit TP2: preço do 2º take profit TP3:
Mais do autor
M & W Pattern Pro is an advanced scanner for M and W patters , it uses extra filters to ensure scanned patterns are profitable. The indicator can be used with all symbols and time frames. The indicator is a non repaint indicator with accurate statistics calculations. To use , simply scan the most profitable pair using the statistics dashboard accuracy , then enter trades on signal arrow and exit at the TP and SL levels. STATISTICS : Accuracy 1 : This is the percentage of the times price hits TP
YOU CAN NOW DOWNLOAD FREE VERSIONS OF OUR PAID INDICATORS . IT'S OUR WAY OF GIVING BACK TO THE COMMUNITY ! >>>    GO HERE TO DOWNLOAD This system is an Heiken Ashi system based on RSI calculations . The system is a free open source script originally published on TradingView by JayRogers . We have taken the liberty of converting the pine script to Mq4 indicator . We have also added a new feature which enables to filter signals and reduces noise on the arrow signals. Background HEIKEN ASHI Th
FREE
YOU CAN NOW DOWNLOAD FREE VERSIONS OF OUR PAID INDICATORS . IT'S OUR WAY OF GIVING BACK TO THE COMMUNITY ! >>>    GO HERE TO DOWNLOAD More About Advanced Currency Meter Every good forex system has the following basic components: Ability to recognize the trend direction. Ability to identify the strength of the trend and answer the basic question Is the market trending or is it in a range? Ability to identify safe entry points that will give a perfect risk to reward (RR) ratio on every position.
FREE
Volatility Ratio
Noiros Tech
4.27 (15)
YOU CAN NOW DOWNLOAD FREE VERSIONS OF OUR PAID INDICATORS . IT'S OUR WAY OF GIVING BACK TO THE COMMUNITY ! >>>    GO HERE TO DOWNLOAD The Volatility Ratio was developed by Jack D. Schwager to identify trading range and signal potential breakouts. The volatility ratio is defined as the current day's true range divided by the true range over a certain number of days N (i.e. N periods). The following formula is used to calculate the volatility ratio: Volatility Ratio (VR) = Today's True Range/Tru
FREE
YOU CAN NOW DOWNLOAD FREE VERSIONS OF OUR PAID INDICATORS . IT'S OUR WAY OF GIVING BACK TO THE COMMUNITY ! >>>    GO HERE TO DOWNLOAD This system is an Heiken Ashi system based on RSI calculations . The system is a free open source script originally published on TradingView by JayRogers . We have taken the liberty of converting the pine script to Mq4 indicator . We have also added a new feature which enables to filter signals and reduces noise on the arrow signals. Background HEIKEN ASHI Th
FREE
YOU CAN NOW DOWNLOAD FREE VERSIONS OF OUR PAID INDICATORS . IT'S OUR WAY OF GIVING BACK TO THE COMMUNITY ! >>>    GO HERE TO DOWNLOAD The   Volatility Ratio   was developed by Jack D. Schwager to identify trading range and signal potential breakouts. The volatility ratio is defined as the current day's true range divided by the true range over a certain number of days N (i.e. N periods). The following formula is used to calculate the volatility ratio: Volatility Ratio (VR) = Today's True Range
FREE
CONGESTION BREAKOUT PRO This indicator scans the breakout of congestion zones . This indicator unlike any other congestion indicator you will find in the market right now,  it uses an advanced algorithm not peculiar to most traditional congestion indicators available today . The advanced algorithm used to define the congestions  is greatly responsible for the high rate real congestion zones and low rate fake congestion zones spotted by this product. UNDERSTANDING CONGESTION Congestion are ar
FRM Half Trend
Noiros Tech
3.5 (2)
YOU CAN NOW DOWNLOAD FREE VERSIONS OF OUR PAID INDICATORS . IT'S OUR WAY OF GIVING BACK TO THE COMMUNITY ! >>>    GO HERE TO DOWNLOAD   The system is a free open source pine script originally published on TradingView by everget   . It was converted to Mt4 by Forex Robot Makers. This system is a  popular trend indicator based on ATR ( Average True Range ) , Moving Averages and the Donchian channel . System BackGround ATR The average true range is an indicator of the price volatility of an asse
FREE
Background :  Forex swing trading   is a short-to-medium-term strategy aiming to profit from price "swings" (short uptrends/downtrends) within larger market moves. This is a simple system that trades the rejection of a previous swing high/low . The system is non repaint and easy to use.Please use with discretion ,  it  gives a decent accuracy and would definitely improve your trades. You can use on any pair and timeframe
FREE
Volume Strength 28
Noiros Tech
3.75 (8)
Version 1.6 ! Volume Strength 28 is better , easier to use and more awesome ! Based on complaint we got from the reviews, we understood many don't know how to really use the time frame setting on the input menu thus they have complaints of volatility, thus we have designed an Automatic Time Frame selection system that is suitable for novice traders.! The design of the indicator has been changed along with some calculation metrics. Based on complaints of high volatility we have been getting ,we
YOU CAN NOW DOWNLOAD FREE VERSIONS OF OUR PAID INDICATORS . IT'S OUR WAY OF GIVING BACK TO THE COMMUNITY ! >>>    GO HERE TO DOWNLOAD Camarilla Pivots Historical plots the historical data of the camarilla pivot point levels on the chart. The Camarilla Pivot levels was originated in 1989 by Nick Scott. The levels are used as primary support and resistance levels by Intraday traders. The levels are calculated with the following formula: R4 = C + RANGE * 1.1/2 R3 = C + RANGE * 1.1/4 R2 = C + RANG
FREE
High Volume Turns
Noiros Tech
4.86 (7)
YOU CAN NOW DOWNLOAD FREE VERSIONS OF OUR PAID INDICATORS . IT'S OUR WAY OF GIVING BACK TO THE COMMUNITY ! >>>  GO HERE TO DOWNLOAD Most of the time, market reversals / pull backs usually follow volume and price spikes thus  these spikes could be the first indication of an exhaustion and possible reversal/pullback. High volume Turns is an indicator that scans the market for price and volume spikes around over-bought/over-sold market conditions. These spikes when spotted serves as the first indi
FREE
Good News ! Advanced Currency Meter is more awesome now ! If you have been a fan of the free version of Advanced Currency Meter then I will implore you not to be discourage because you will soon find that the new paid version is worth every dime. Unlike the free version the new paid version of Advanced Currency Meter now has a newly added panel called the “% Daily Range” . Why A Paid Version Now? We believe you like good things and many who has used Advanced Currency Meter over the years will te
YOU CAN NOW DOWNLOAD FREE VERSIONS OF OUR PAID INDICATORS . IT'S OUR WAY OF GIVING BACK TO THE COMMUNITY ! >>>    GO HERE TO DOWNLOAD The popular saying in forex  "The Trend is your friend"   has always stood the test of time because it is valid statement for every generation of traders and in every market. Most successful traders do not fight against the trend but lend to flow with it.  Sometimes finding the best pair to trade can be a daunting task even when you have a good strategy . Some
FREE
YOU CAN NOW DOWNLOAD FREE VERSIONS OF OUR PAID INDICATORS . IT'S OUR WAY OF GIVING BACK TO THE COMMUNITY ! >>>    GO HERE TO DOWNLOAD Momentum channel is a simple momentum based system yet with a great degree of accuracy in detecting turning points. The market momentum are defined by Average True Range Channels . When price breaks these channels most times , it is an indication of a shift in market momentum and thus a possible new trend formation. The system can be traded on any time frame and
FREE
YOU CAN NOW DOWNLOAD FREE VERSIONS OF OUR PAID INDICATORS . IT'S OUR WAY OF GIVING BACK TO THE COMMUNITY ! >>>    GO HERE TO DOWNLOAD V1 Scalper is an easy to use tool designed for trend scalping. It tries to spot good entry points in a major trend by using swing high and lows formed along the trend . This tool can be used on Fx Pairs , Indices , Commodities and stocks. Not often  but in some signals , the arrow might repaint on the current candle so extra confirmation tools are advised for tr
FREE
Ask any successful forex traders the secret of their success and they will tell you that the first key to a successful forex trading is proper trade management. Trade management is what differentiates the rookie from the pro in Forex. While the rookie trades based on emotions and greed, the pro trades based on certain logic and rules . These logic and rules are all embodied in a successful Trade Management System. Advanced Trade Manager is a combination of different trade management systems desi
This Currency Meter Calculates Strength Using a currency basket of 28 pairs? This Currency Meter uses a basket of 28 currency pair to define strength. This is very important because it gives an wholesome view of the strength of a currency by considering its reaction to all major currencies paired with it. This Currency Meter is Multi-timeframe!!! Majority of the currency strength indicators around the market today only has a single time frame view. Even with the so called multi-timeframe versi
Note : The slow loading of the indicator issue has been addressed . This new version loads fast and does not slow the platform. Version 1.3 : We have updated the indicator to include an historical bar scanning option . So instead of scanning all bars in the history (which can make the indicator slow sometimes ) , you can select the maximum number of bars it can scan which can increase the performance and make the indicator faster. This indicator scans the 1-3 Trendline pattern . The indicato
WOLFE WAVE PATTERNs First discovered by Bille Wolfe . The wolfe wave  is a 5 wave price action pattern that is formed by supply and demand in a market and the fight to reach equilibrium in the market . The entry spot of the pattern is defined by the breakout of the trend created by wave 1 and wave 3 . This pattern forms in any market where there is supply and demand thus it can also be used to trade commodities and stocks. Wolfe Waves are reversal patterns that usually carry a low risk margin. P
Swing Continuation
Noiros Tech
2.6 (5)
The swing continuation pattern happens in a trend direction after a short reversal / pull back . As the name suggests , these patterns occurs along the swing high and swing lows of a trend , this makes the patterns very low risk patterns with potential high rewards . The swing continuation indicator also combines Currency Meter as a filter for its execution. The idea is to go with both the price trend flow and currency trend flow. Which means the price action must be supported by the currency st
M W Pattern Pro
Noiros Tech
4.14 (7)
M & W Pattern Pro is an advanced scanner for M and W patters , it uses extra filters to ensure scanned patterns are profitable. The indicator can be used with all symbols and time frames. The indicator is a non repaint indicator with accurate statistics calculations. To use , simply scan the most profitable pair using the statistics dashboard accuracy , then enter trades on signal arrow and exit at the TP and SL levels. STATISTICS : Accuracy 1 : This is the percentage of the times price hits TP
Flag Pattern pro is a   Price Action (PA)   analytical tool that scans the   continuation patterns   known as   "Flag and Pennant Patterns"   . Flag and Pennant patterns are continuation patterns characterized by a move in a previous trend direction after a shallow retracement usually below 50% of the original move . Deep retracements can however be sometimes found at the 61.8 % levels. The original move is know as the   flag pole   and the   retracement   is called the flag.   Indicator Funda
Channel Vertex is a price action pattern formed by price Chanel and a triangle pattern . Price channels basically indicates possible support and resistance zones around a price movement and retracement    or breakout at these levels can indicate possible trend continuation or reversal .  Majority of the times price fluctuations forms triangle patterns defined by 3 vertexes , these triangle patterns most times defines a trend continuation.  A triangle pattern is a trend continuation pattern that
The market session currency meter is an advanced currency meter designed majorly for intra-day trading. The meter tracks price movements and volatilities across the different market sessions daily. With this market meter you will be able to see how price moved within the four (4) major market sessions ( SYDNEY , TOKYO , LONDON and NEW YORK ). The indicator comes with an inbuilt daily savers time adjuster that automatically adjusts the hours for each session when ever the daily savers time (DST)
This Currency Meter Calculates Strength Using a currency basket of 28 pairs? This Currency Meter uses a basket of 28 currency pair to define strength. This is very important because it gives an wholesome view of the strength of a currency by considering its reaction to all major currencies paired with it. This Currency Meter is Multi-timeframe!!! Majority of the currency strength indicators around the market today only has a single time frame view. Even with the so called multi-timeframe versio
Flag Pattern pro is a   Price Action (PA)   analytical tool that scans the   continuation patterns   known as   "Flag and Pennant Patterns"   . Flag and Pennant patterns are continuation patterns characterized by a move in a previous trend direction after a shallow retracement usually below 50% of the original move . Deep retracements can however be sometimes found at the 61.8 % levels. The original move is know as the   flag pole   and the   retracement   is called the flag. Indicator Fundam
This indicator scans the 1-3 Trendline pattern . The indicator is a 100 % non repaint low risk breakout system . The patterns are formed around swing high and swing lows which make them a low risk pattern with high reward. PATTERN BACKGROUND The 1-3 Trendline Breakout pattern is formed by four(4) points which are composed of three (3) primary points and the pattern neck. A trendline is always formed by the point 1 and the neck of the pattern . When price breaks out of the trendline formed , it
Channel Vertex is a price action pattern formed by price Chanel and a triangle pattern . Price channels basically indicates possible support and resistance zones around a price movement and retracement    or breakout at these levels can indicate possible trend continuation or reversal .  Majority of the times price fluctuations forms triangle patterns defined by 3 vertexes , these triangle patterns most times defines a trend continuation.  A triangle pattern is a trend continuation pattern that
CONGESTION BREAKOUT PRO This indicator scans the breakout of congestion zones . This indicator unlike any other congestion indicator you will find in the market right now,  it uses an advanced algorithm not peculiar to most traditional congestion indicators available today . The advanced algorithm used to define the congestions  is greatly responsible for the high rate real congestion zones and low rate fake congestion zones spotted by this product. UNDERSTANDING CONGESTION Congestion are ar
Filtro:
lauro1956
5742
lauro1956 2022.11.03 16:12 
 

O usuário não deixou nenhum comentário para sua avaliação

Aravind Kolanupaka
9924
Aravind Kolanupaka 2020.06.18 21:17 
 

Very Good

pnutfx503
1533
pnutfx503 2017.09.29 16:22 
 

O usuário não deixou nenhum comentário para sua avaliação

Responder ao comentário