Channel Vertex Pro
- Indicadores
- Versão: 1.2
- Atualizado: 24 janeiro 2025
- Ativações: 10

Channel Vertex is a price action pattern formed by price Chanel and a triangle pattern .
Price channels basically indicates possible support and resistance zones around a price movement and retracement or breakout at these levels can indicate possible trend continuation or reversal .
Majority of the times price fluctuations forms triangle patterns defined by 3 vertexes , these triangle patterns most times defines a trend continuation. A triangle pattern is a trend continuation pattern that forms as a result of the struggle between supply and demand in a market .
Combining a price channel and a triangle pattern makes it easy to spot positions where trend continuation are sustainable and less inclined to fail .
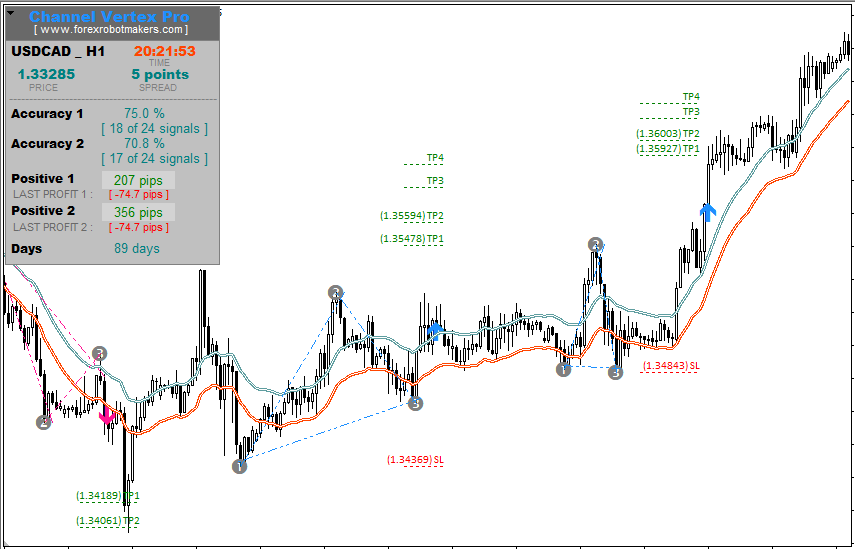
Channel vertex is a non repaint and non repaint indicator designed with accurate stats dashboard to inform the trader on profitability in terms of accuracy and pips .
Product Features
- Non repaint
- Non Backpaint
- Accurate statistics dashboard
- Profit in Accuracy percentage (%) calculated
- Profit in pips calculated
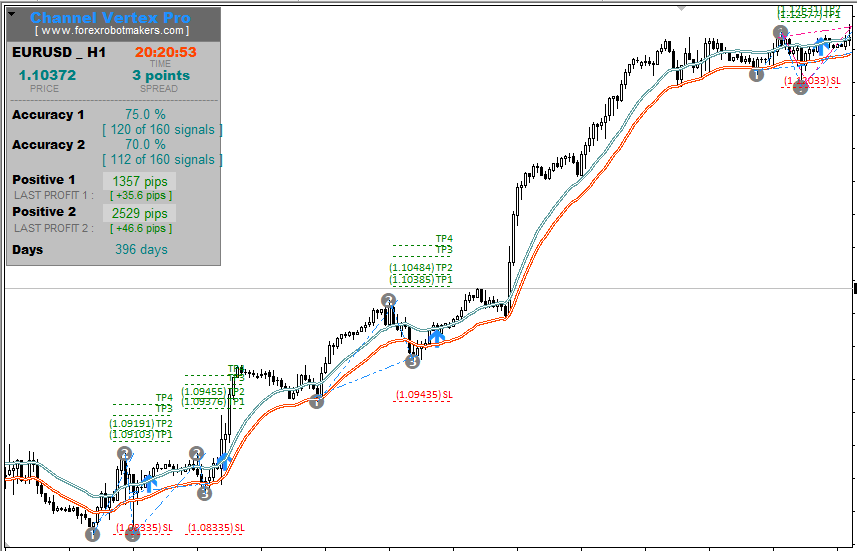
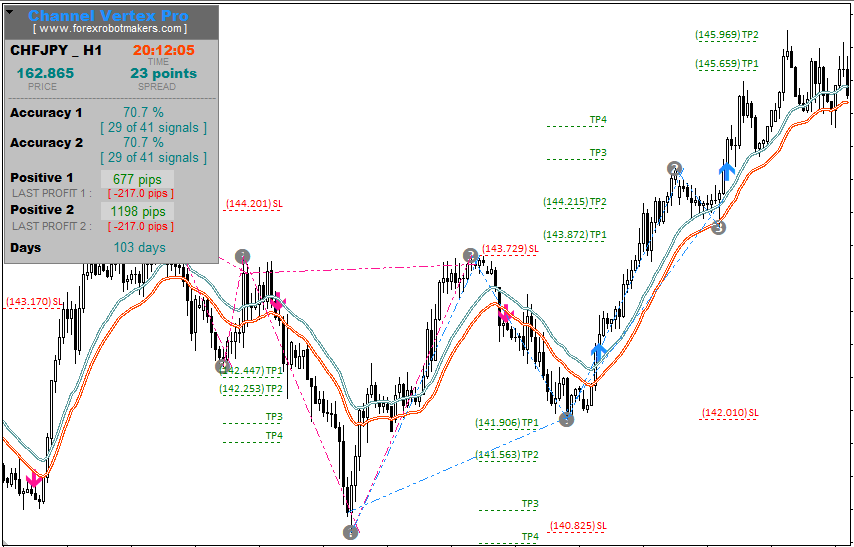
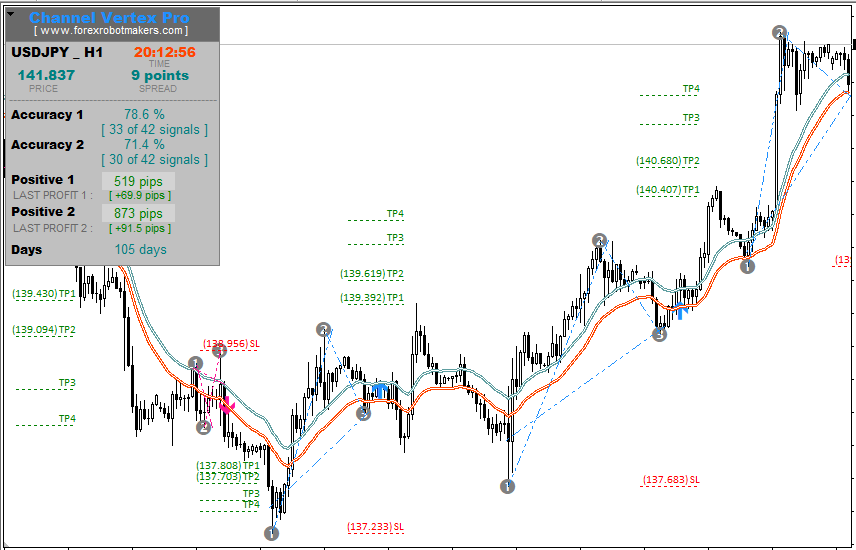
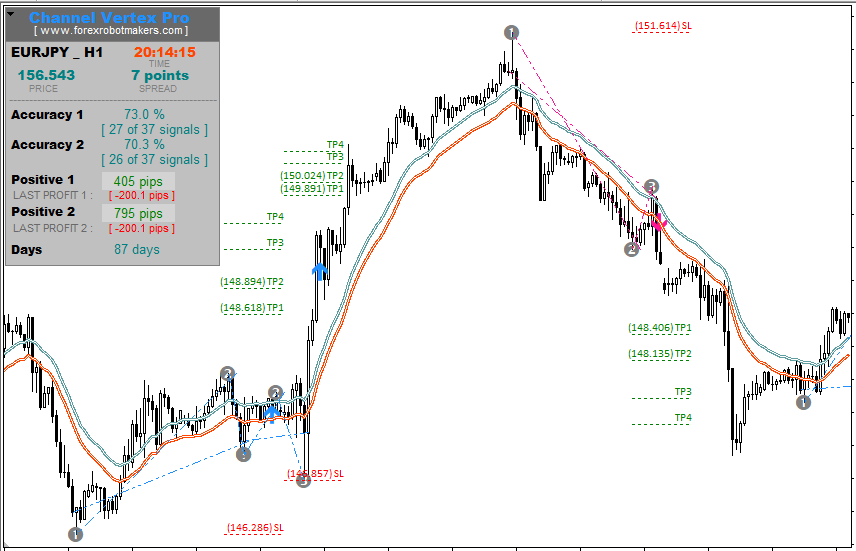
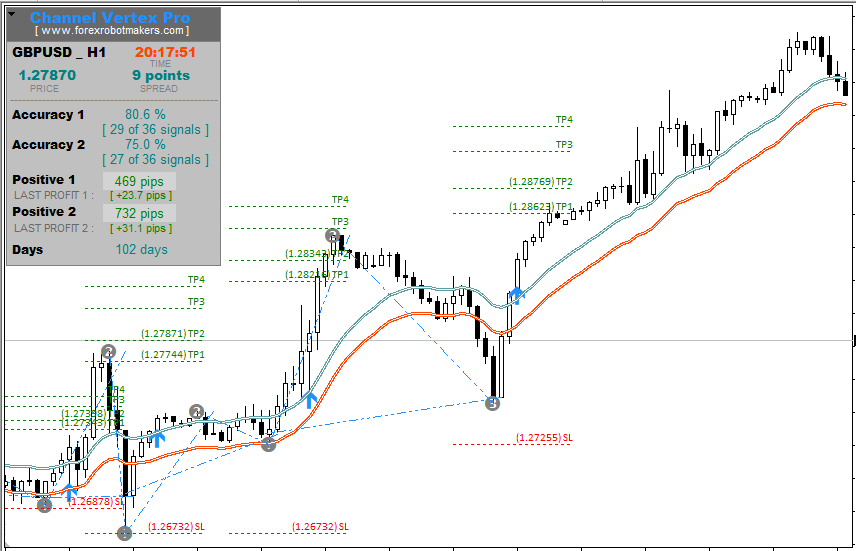
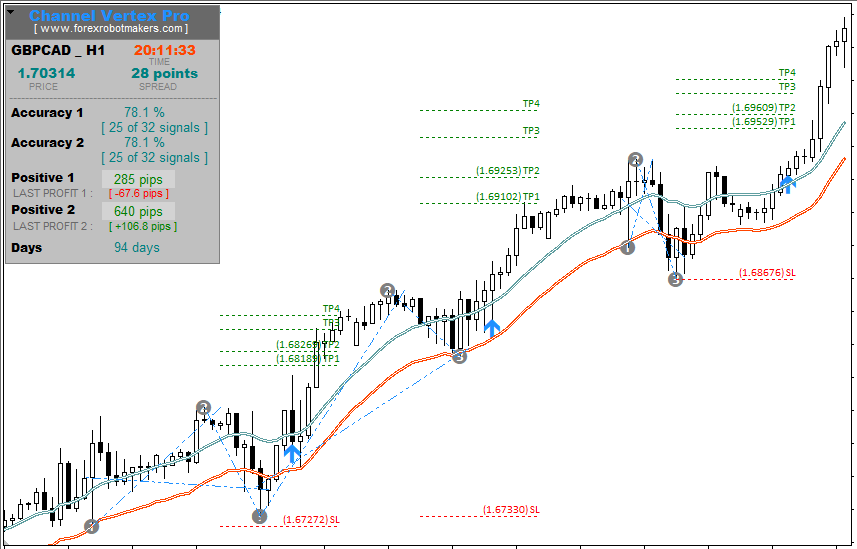
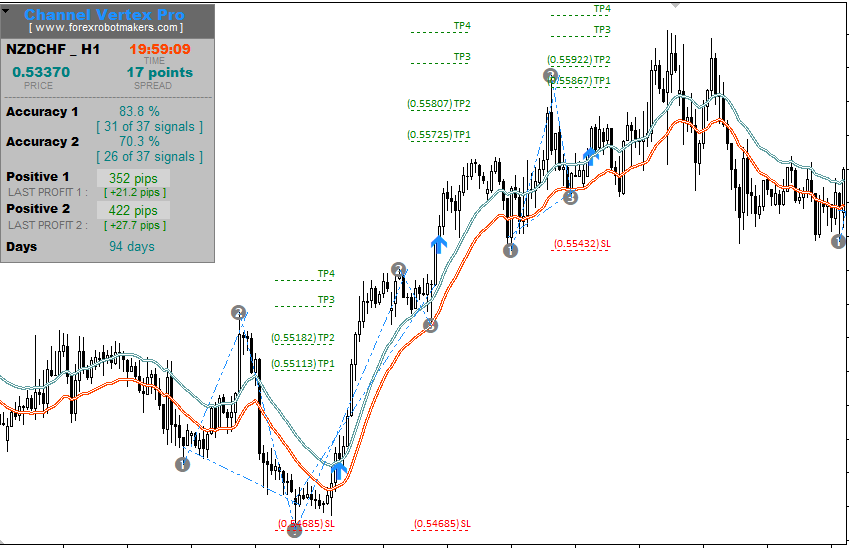
STATISTICS DASHBOARD INFORMTION
Some of the major information given by the statistics dashboard includes :
INPUT MENU SETTINGS1.) Current Stop Loss & Take Profit : The stop loss and take profit of the current pattern formed is shown on the stats.
2.) Accuracy : The accuracy of all signals is calculated as the percentage of the total signals that were profitable.
Accuracy = (Profitable Signals /Total Signals)*100
Also along with the accuracy calculated the profitable signals and the total signals counted are also displayed for transparency.
3.) Counted Days : Total number of trading days counted given the current history tested. With this information along with the Net Profit, traders can calculate their average daily profit.
The basic settings for the indicator are as follows :
- Chanel Period : The period value for the channel , the greater the period , the greater the accuracy
- Chanel Deviation : Deviation for the channel , the greater the deviation , the wider the channel becomes
- Ma Type : Channel Moving Average Type
- Pattern Amplitude : This is the period used to scan the triangle vertexes
- Pattern History : History to use for the display
- Show Dashboard : True / False
- First TP Fib : Fibonacci ratio for the first Take Profit
- Second TP Fib : Fibonacci ratio for the second Take Profit
- Minimum Retracement : The minimal retracement value for the second leg of the channel vertex
- Maximum Retracement : The maximal retracement value for the second leg of the channel vertex
YOU CAN NOW DOWNLOAD FREE VERSIONS OF OUR PAID INDICATORS . IT'S OUR WAY OF GIVING BACK TO THE COMMUNITY !
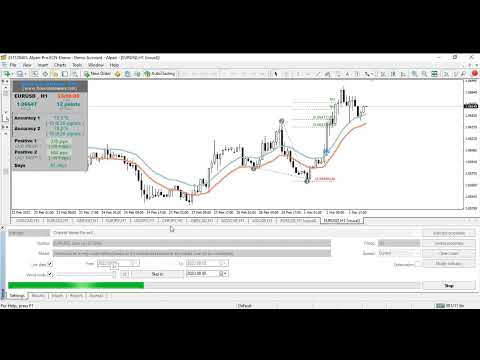
Seems good so far. Does the arrow redraw or repaint, once it is plotted? Or is the signal not valid until signal candle is closed?