Candle Clock Desk

What It Shows

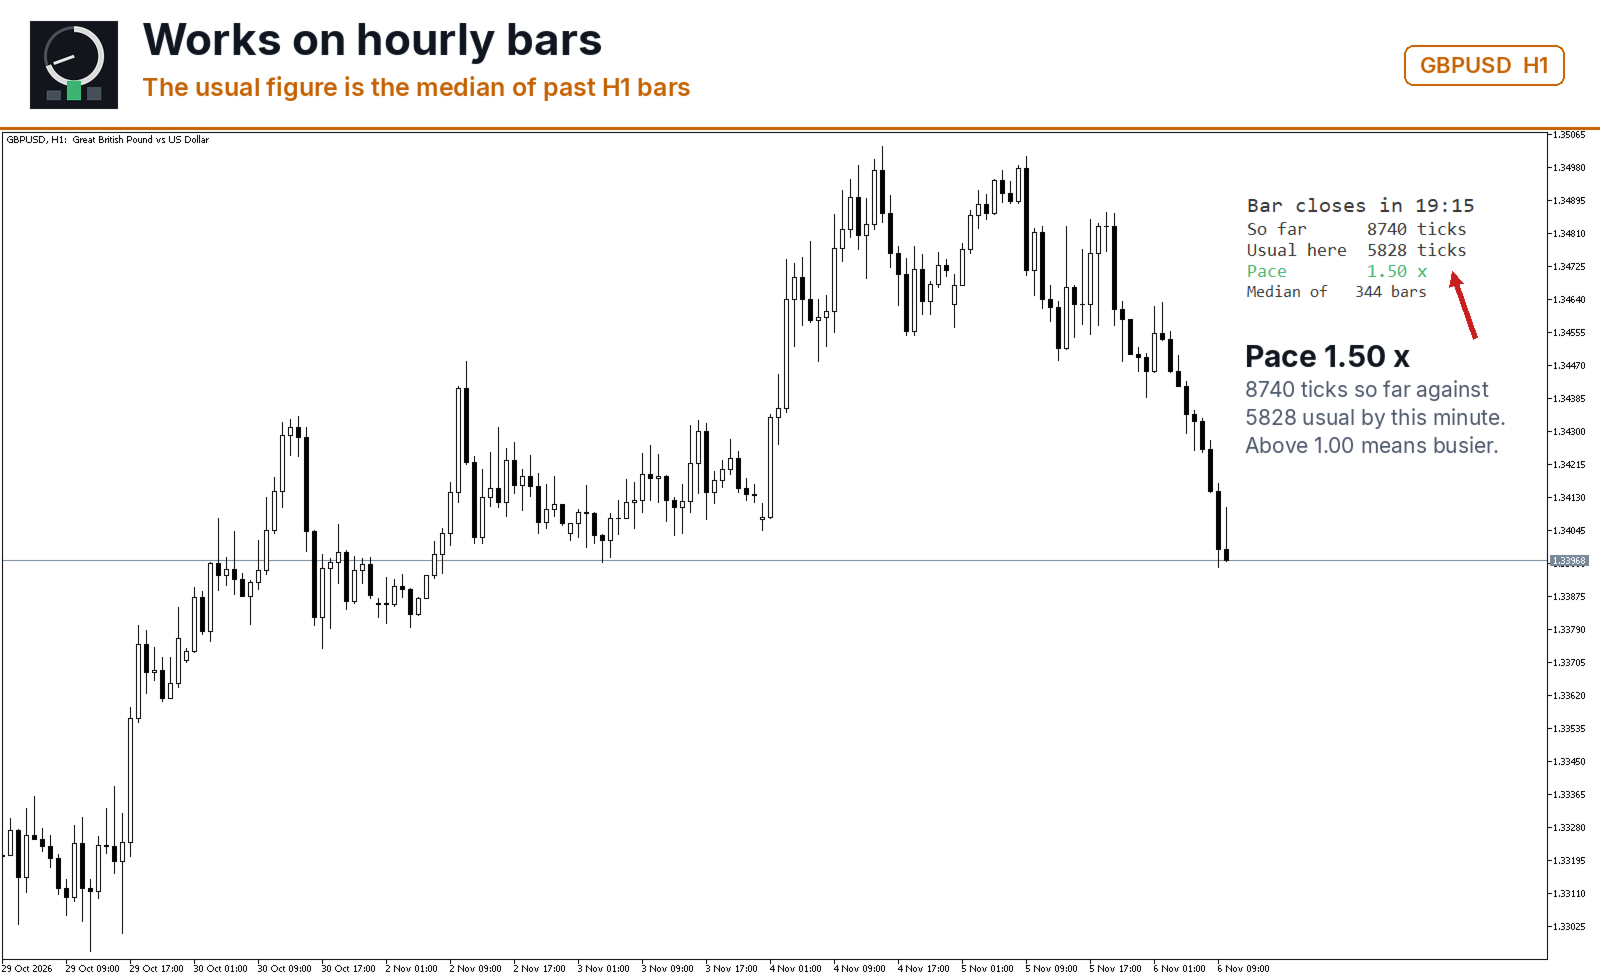
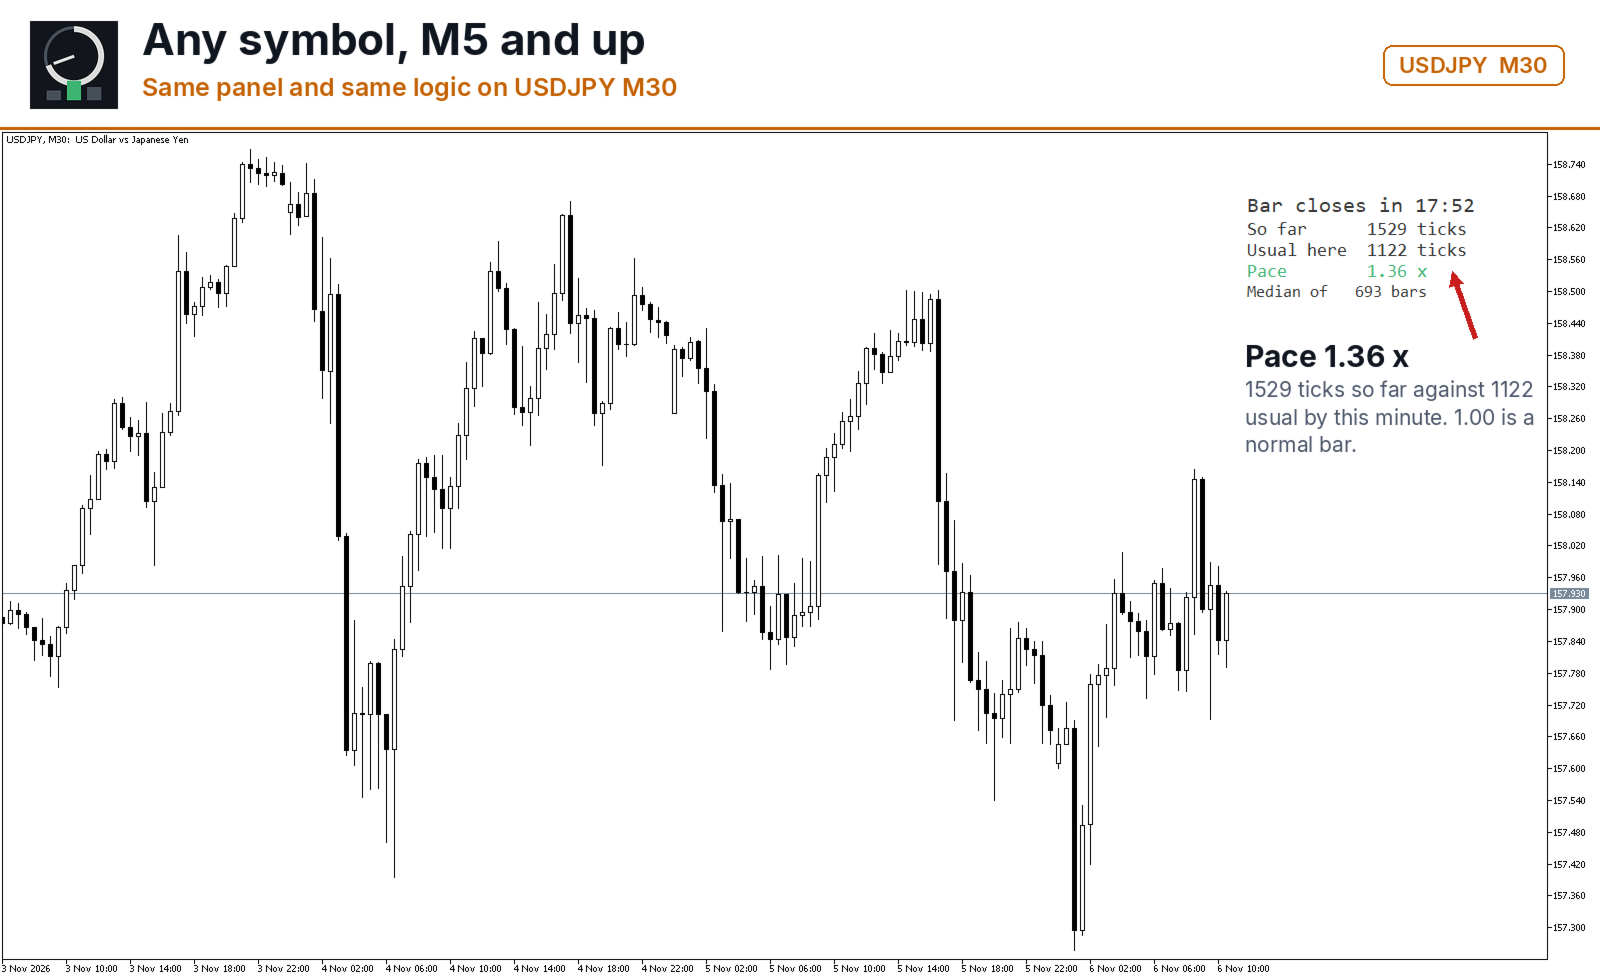
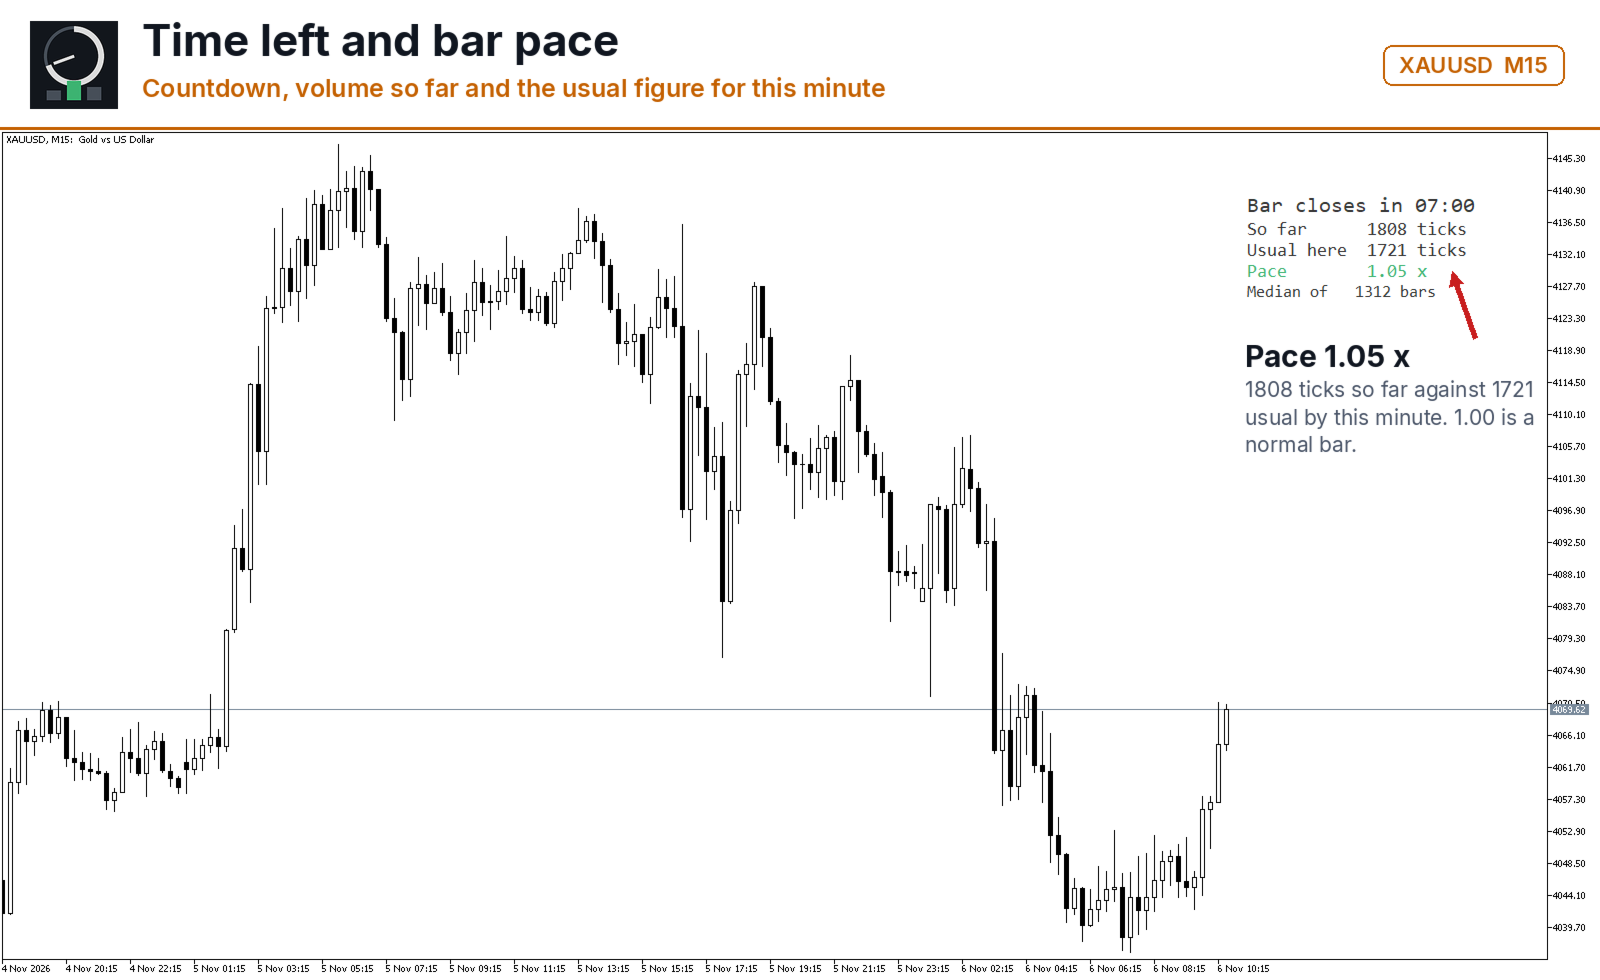
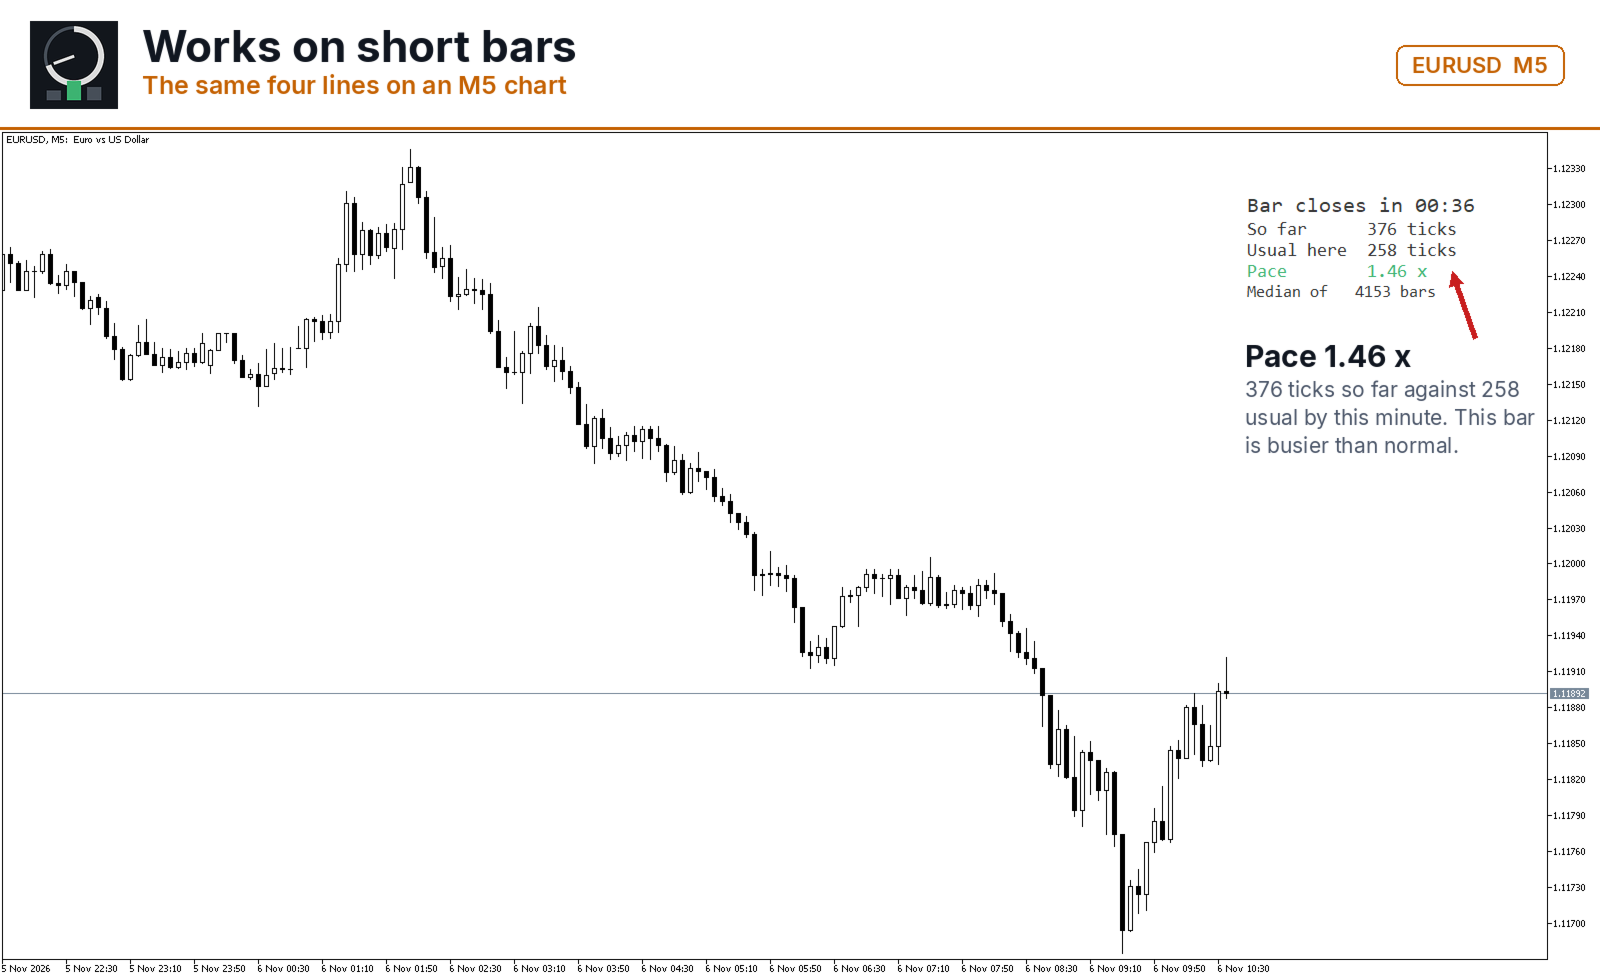
Candle Clock Desk puts four lines on the chart. The first is the time left until the current bar closes. The next three answer a question the clock alone cannot: is this bar unusually busy, or unusually quiet, right now.

  • Bar closes in - the countdown, in minutes and seconds
  • So far - volume this bar has accumulated since it opened
  • Usual here - what this symbol had accumulated by this same minute, in the past
  • Pace - the first divided by the second

The Pace Line

Pace of 1.00 means the bar is filling exactly as it normally does at this point. 2.00 means twice the usual volume has already arrived. 0.40 means the bar is running dry. The figure is not a signal and is not tied to direction: it says how much trading is happening, not where price is going.

Where The Usual Figure Comes From

The comparison is built from M1 bars your terminal already holds. Every M1 bar belongs to exactly one bar of the chart timeframe, and its position inside that bar is known from the timestamps. For each minute of the bar the panel takes the volume accumulated by that minute in every finished bar of the history window, and keeps the median.

A simpler method would be to take the volume of the whole bar and multiply it by the share of time elapsed. That method is wrong on every instrument with a session: volume does not arrive evenly. The open, the London and New York overlap and the minutes around a release carry far more of it than the middle of the bar. The median profile keeps that shape instead of flattening it.

The median, not the average, is used on purpose. One release day with ten times the normal volume moves an average for weeks; the median stays where the ordinary bars are.

Reading It During A Session

Open the chart, let the terminal pull its M1 history, and watch the Pace line through one session. It sits near 1.00 for long stretches and climbs when something arrives. Compare a reading above 2.00 with the Market Watch and with the news calendar for that minute: the panel and the tape describe the same event from two sides.

When the history window holds fewer finished bars than MinBarsForMedian for a given minute, the panel prints that the median is not available rather than showing a figure built on two samples.

Input Parameters

  • HistoryDays - days of M1 history the median is built from
  • VolumeSource - tick volume, or real volume where the broker supplies it
  • MinBarsForMedian - how many finished bars a minute needs before its median is shown
  • MaxM1BarsToScan - hard cap on how many M1 bars are read
  • ShowPanel - draw the panel or keep only the buffers
  • PanelCorner - corner of the chart, offsets, font size
  • ColorFast - colour used when the pace is at or above 1.00
  • ColorSlow - colour used when it is below
  • ObjectPrefix - prefix for every chart object created

Reading The Figures From An Expert Advisor

Four buffers are published and available through iCustom: buffer 0 is the seconds left in the current bar, buffer 1 is the volume accumulated so far, buffer 2 is the median for this minute, buffer 3 is the pace. Buffer 2 and buffer 3 return an empty value while the median is not available, so an expert advisor can tell "quiet" from "not measured yet".

Requirements

Any symbol and any timeframe from M5 upward; the profile is built from M1 history, so an M1 chart has nothing to compare against and the panel then shows the clock and the volume only. The indicator places no orders, writes nothing to disk and works the same on a demo and a live account of the same broker.

Support

Questions about a parameter, or a case where the panel and your terminal disagree: reply in the comments of this page with the symbol, the timeframe and the broker, and I will look into it. Ratings help other traders decide whether a free tool is worth their time, whichever way they go.
Produtos recomendados
Basic Theme Builder MT5
Mehran Sepah Mansoor
5 (2)
Basic Theme Builder: Simplifique a Personalização do Seu Gráfico Transforme sua experiência de negociação com o Basic Theme Builder , um indicador versátil projetado para simplificar a personalização da aparência do seu gráfico no MetaTrader 5. Este indicador intuitivo oferece um painel fácil de usar que permite alternar rapidamente entre vários temas e esquemas de cores, melhorando tanto o apelo visual quanto a funcionalidade do seu ambiente de negociação. Free MT4 version O Basic Theme Builde
FREE
THE TRADER SESSION LEVELS THE TRADER Session Levels is a free MetaTrader 5 indicator designed to visualize trading sessions, analyze intraday price ranges, and identify important session levels. The indicator helps traders monitor different periods of the trading day and use the Asian range high and low in their market analysis. Key Features Four Trading Sessions — Pacific, Asia, Europe, and New York. Color-Coded Session Areas displayed directly on the chart. ASIA HIGH / LOW — automatic calculat
FREE
Support And Resistance indicator that can display round levels and zones . It shows them directly on the chart, providing an easy help when you want to set stop-loss or take-profit level, or when you want to see the next market target.   If an asset price is moving down and bounces back up, the level is called support (think: price floor). If an asset price is moving upward and hits a level where it reverses downward, this is called resistance (think: price ceiling).
FREE
KF Market Structure — Smart Money Concepts Trend & Breakout Analyzer KF Market Structure is a clean, rule-based Smart Money Concepts (SMC) indicator for MetaTrader 5 that automatically detects and visualizes market structure: Swing Highs, Swing Lows, Break of Structure (BOS), and Change of Character (CHoCH). Built strictly for closed bar evaluation, it provides an objective structural baseline for Price Action traders and automated trading strategies without erratic signals. Whether you trade
FREE
Fabii Memory Support Resistance
Fabien Georges Andre Guillemaud
Pare de adivinhar quais zonas de suporte e resistência importam: cada uma mostra quantas vezes o preço a testou. No repaint. Qualquer par, qualquer timeframe. No seu gráfico em 2 minutos. Teste grátis no Strategy Tester. Get more indicators here Baselines, volatility filters and oscillators. No repaint. Por que você precisa Você desenha suporte e resistência à mão, e dois traders nunca desenham os mesmos níveis no mesmo gráfico. Você não sabe quais níveis merecem sua atenção. Você coloca um s
FREE
IQuantum
Evgeniy Scherbina
The indicator IQuantum shows trading signals for 10 symbols in the daily chart: AUDCAD, AUDUSD, EURUSD, GBPCAD, GBPCHF, GBPUSD, NZDUSD, USDCAD, USDCHF, and USDJPY. Signals of the indicator are produced by 2 neural models which were trained independently from one another. The inputs for the neural models are normalised prices of the symbols, as well as prices of Gold, Silver and markers of the current day. Each neural model was trained in 2 ways. The Ultimate mode is an overfitted neural model
FREE
=== Drawdown Peak Panel (free indicator) === Short description: Shows your account drawdown from its equity peak right on the chart. Display only. Description: Drawdown Peak Panel keeps track of your account equity peak and shows how far you are below it, in percent and in account currency. What you see on the chart - Current drawdown from the recorded equity peak (green below 10%, orange below 25%, red above) - Maximum drawdown recorded so far - Equity, balance and peak value - Optional ale
FREE
Apex Point
Marco Engstermann
Apex Point is a trend-following indicator for MetaTrader 5, transforming complex market data into signals for traders. It displays blue dots for uptrends, red dots for downtrends, and yellow crosses at potential reversals, helping users identify momentum shifts quickly. Key features include a confirmation system requiring multiple bars (default: 3) to validate changes, reducing false signals; dynamic ATR-based offsets for adaptive trailing, with instant ratcheting in the trend direction and smo
FREE
Domine o ritmo do mercado com o indicador Advanced Market Sessions. O timing é tudo no trading. Saber exatamente quando os principais centros financeiros abrem e fecham é a chave para entender a volatilidade do mercado, a liquidez e o viés direcional. Este indicador oferece visibilidade cristalina das três principais sessões de negociação: Ásia, Londres e Nova York. Ao mapear automaticamente a Máxima e a Mínima exatas de cada sessão em tempo real, esta ferramenta capacita você a negociar com o v
FREE
SpreadMeter OGT Free
Dmitriy Gurenko
5 (1)
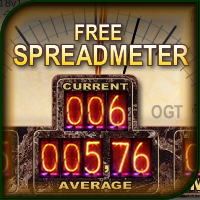
The indicator shows the current spread of the symbol, the minimum, average and maximum values for the current bar in the form of digital, analog and graphic indicators. Has two modes of operation: fixing the system spread, or calculating the spread as the difference between the "Bid" and "Ask" prices on each incoming tick. Parameters  The indicator has a single input parameter: Type of calculation  - type of spread calculation. It can take the following values:  System spread  - the spread value
FREE
VFI Quantum
Nikita Berdnikov
5 (1)
Introducing VFI (Volume Flow Indicator) – a trading indicator that analyzes the relationship between volume and price movement to identify key trading opportunities. The indicator displays the strength and direction of volume flow, providing clear signals about potential entry and exit points. Signals are formed based on zero line crossovers, crossovers between the VFI line and its exponential moving average (EMA), and when the indicator exits overbought and oversold zones. Attention! This stra
FREE
Aurum Flow Matrix
Hicham Mahmoud Almoustafa
Aurum Flow Matrix is an advanced XAUUSD volume intelligence indicator that detects buying, selling, and absorption zones. It displays zone strength, estimated flow, confidence, retest status, market bias, and the nearest active zone through a clean professional dashboard.                                                                                                                                        post Aurum Flow Matrix is a professional volume intelligence indicator developed for XAUUS
FREE
Most killzone indicators draw boxes. This one checks whether the boxes work. Asia, London open, New York open and London close drawn automatically A table on your chart measures how often the day's high or low really formed inside each killzone, next to what pure chance would give Free. Check the numbers before you trust any killzone strategy MT4 version (free) | ICT FVG Honest Stats (free) | ICT Liquidity Levels Honest Stats (free) | ICT SMT Divergence Honest Stats (free) | TrueRisk Trade Panel
FREE
Fractals MT5 FX
Diego Alejandro Guzman
Fractals MT5 FX   Fractales personalizables con período ajustable Descripción breve Indicador avanzado de fractales para MetaTrader 5 que permite definir el número de velas a ambos lados del pico o valle, y personalizar el símbolo de las flechas. Ideal para identificar niveles de soporte y resistencia dinámicos, así como puntos de inflexión en la tendencia. Características principales Período ajustable:   El parámetro "Número de velas" ( Fr_Period ) permite elegir cuántas velas a la izquierda y
FREE
Moving Spread
Jose Maria Molina Sanchez
Moving Spread – Monitor de Custo de Mercado em Tempo Real Monitore o spread médio em tempo real e evite operar em períodos de alto custo. O que este indicador faz? O Moving Spread mede o spread médio (em pontos) do mercado em tempo real, mostrando como ele varia ao longo do tempo. É uma ferramenta essencial para traders que querem entender quando o custo de entrada é muito alto, pois isso pode corroer seus lucros ainda antes da operação começar. Por que isso importa? Um spread alto signi
FREE
Strifor Lot Calculator — um indicador para MetaTrader 5 que ajuda traders a calcular o tamanho ideal do lote com base no risco e stop-loss definidos. Permite negociar de forma mais consciente, gerenciar riscos e economizar tempo em cálculos manuais. Vantagens Controle preciso de risco — cálculo automático do tamanho do lote baseado na porcentagem de risco escolhida. Dois modos de operação — entrada manual de parâmetros ou cálculo pelas linhas no gráfico. Suporte a instrumentos populares — pares
FREE
The "Support Resistance Dynamic" indicator is a powerful technical analysis tool for the MetaTrader 5 platform, designed to automatically identify and plot dynamic Support and Resistance zones on price charts. This indicator helps traders easily recognize important price levels, potential reversal points, or breakout areas, thereby enabling more informed trading decisions. 2. Key Features Dynamic S/R Identification : Automatically identifies support and resistance zones based on an advanced Pivo
FREE
Spread Monitor MT5
Fabio Cavalloni
3.5 (2)
This is a usefull utility for monitoring spread and also for recording informations to a file. (Files will be placed into "Common\Files\Spread Monitor"). There is the possibility to let the indicator calculate high/low into the past thanks to downloading ticks. (It's a slow and approsimate thing! The best way to use it is to attach to a chart and let it recording spread in real time). There is also a buffer with the average of spread in latest X periods. Easy and effective.
FREE
FVG Metrics
Kim Raphael Reitz
5 (1)
FVG Indicator (Current Timeframe Zones and Multi-Timeframe Count Panel) This indicator detects and draws Fair Value Gap zones on the current chart timeframe only. It also includes a multi-timeframe panel that shows how many active (unmitigated)  zones exist on selected timeframes. This indicator detects and draws Fair Value Gap zones on the current chart timeframe . It can also display a panel with the number of active zones on selected timeframes. The indicator shows bullish and bearish zone
FREE
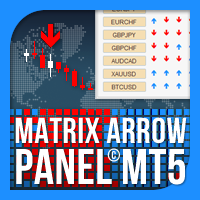
O Matrix Arrow Indicator Multi Timeframe Panel MT5 é um complemento gratuito e um grande trunfo para o seu Matrix Arrow Indicator MT5 . Ele mostra o sinal atual do Matrix Arrow Indicator MT5 para 5 intervalos de tempo personalizados pelo usuário e para 16 símbolos / instrumentos modificáveis ​​no total. O usuário tem a opção de habilitar / desabilitar qualquer um dos 10 indicadores padrão, que compõem o Indicador de Seta de Matriz MT5 . Todos os atributos dos 10 indicadores padrão também são aj
FREE
### RECOMMENDED SETTINGS & PAIR - **Primary Instrument:** XAUUSD (Gold) - **Timeframe:** M1 (1-Minute Scalping) - **Trading Style:** Smart Money Concepts (SMC) & Order Block Scalping - **Account Type:** ECN / Raw Spread / Low Spread Broker (Recommended for M1 execution) - **Recommended Sessions:** London & New York Sessions (Peak Liquidity & High Volatility) # XAUUSD M1 Precision Order Block Scalper Dashboard Unlock high-probability scalping entries on Gold (XAUUSD) with this advanced real-t
FREE
Algorion Bias Master Professional Multi-Timeframe Market Bias Indicator for MetaTrader 5 Algorion Bias Master is a professional multi-timeframe market bias indicator for MetaTrader 5 that helps traders identify the dominant market direction before entering a trade. Instead of generating simple Buy or Sell signals, the indicator evaluates market structure using multiple technical factors, including trend direction, trend strength, volatility, momentum, and breakout conditions, to produce a struc
FREE
True Risk
Oleksii Lishchenko
Seu lote pode arriscar mais do que o percentual que você definiu. O True Risk mostra o risco real da sua próxima operação antes de você abri-la. O problema As corretoras arredondam cada lote para baixo até um passo e nunca ficam abaixo do lote mínimo. Em uma conta pequena, só o lote mínimo pode ser muitas vezes o seu plano. Com 300 dólares e um stop no ouro a 25 dólares de distância, 0.01 lote já arrisca 25 dólares, ou seja, 8.3 por cento e não o 1 por cento que você definiu. O spread e a comiss
FREE
Show Pips for MT5
Roman Podpora
4.5 (32)
Este indicador de informação será útil para quem quer estar sempre atento à situação atual da conta. VERSION MT 4 -   More useful indicators O indicador exibe dados como lucro em pontos, porcentagem e moeda, bem como o spread do par atual e o tempo até o fechamento da barra no período atual. Existem várias opções para colocar a linha de informação no gráfico: À direita do preço (corre atrás do preço); Como comentário (no canto superior esquerdo do gráfico); No canto selecionado da tela. Também é
FREE
Duas linhas que medem a rotação real de um mercado em vez da forma de uma média móvel. Vortex Indicator MTF soma o movimento de vórtice ascendente e o descendente sobre uma janela, divide cada um pela amplitude verdadeira e tira o seu sinal do cruzamento do par resultante, ou seja de uma mudança de direção medida nas próprias velas. Ele não traz recursão alguma, então uma continuação a partir de qualquer vela é exata por construção. É gratuito: sem período de teste, sem funções bloqueadas, sem p
FREE
Dual Striker - um novo Expert Advisor para negociação de Ouro. Sinal ao vivo +150% ->   Conta Real Sem Martingale e sem averaging de posições Teste gratuitamente no seu terminal de negociação:   Expert Advisor Dual Striker True MACD Divergence — Indicador de Divergências MACD de Alta Qualidade A maioria dos indicadores de divergência gera sinais em praticamente todos os máximos e mínimos locais, fazendo com que o gráfico fique rapidamente repleto de divergências falsas ou pouco relevantes. True
FREE
The CV MACD Indicator is a modern and professional momentum indicator designed to analyze trend strength, market direction and potential reversals. By combining the MACD line, signal line and histogram, the indicator helps traders identify market momentum and high-quality trading opportunities with clarity and precision. Features: Precise MACD momentum analysis Early trend reversal detection Clear histogram for market strength visualization Adjustable Fast, Slow and Signal periods Visual Buy & S
FREE
Force Candle Pro
Samuel Henrique Almeida Ferreira
5 (2)
Force Candle Pro é um indicador avançado desenvolvido para identificar candles de forte impulso no mercado, ajudando o trader a detectar movimentos com maior probabilidade e possível atuação institucional. A ferramenta analisa a força dos candles com base no tamanho do corpo, volatilidade e consistência direcional, filtrando movimentos fracos e indecisos. Diferente de indicadores comuns, o Force Candle Pro foca no impulso do mercado, permitindo identificar momentos em que o preço realmente se
FREE
HCS SessionPulse
HADDEN CAPITAL SOLUTIONS LLC
HCS SessionPulse is a free, read-only global trading session monitor for MetaTrader 5. A compact on-chart panel shows the current status of the Sydney, Tokyo, London, and New York trading sessions and continuously counts down to upcoming session transitions. SessionPulse displays: • Sydney session OPEN/CLOSED status • Tokyo session OPEN/CLOSED status • London session OPEN/CLOSED status • New York session OPEN/CLOSED status • Time remaining until each session's next open or close • Currently
FREE
Sessions Indicateur
Marc Guy Verzotti
4 (2)
Sessions are very important in trading and often good area where to look for setup. In SMC, ICT we will look for Asian session to serve as liquidity This indicator displays: High & Low of the Asia session Midnight New York time opening line Congifuration Line Style, color Label position, size, color Start of the level (Start of the day, Start of the session, Highest or Lowest point in the session) Any questions or comments, send me a direct message here  https://www.mql5.com/en/users/mvonline
FREE
Os compradores deste produto também adquirem
Trend Sniper X
Sarvarbek Abduvoxobov
4.86 (44)
Trend Sniper X é um indicador de acompanhamento de tendência para múltiplos tempos gráficos no MetaTrader 5 que ajuda os traders a identificar a direção da tendência e potenciais pontos de reversão com clareza e precisão. para MT4: https://www.mql5.com/en/market/product/193245 Informações sobre o preço: O preço atual é promocional e está sujeito a alterações à medida que novas atualizações e funcionalidades forem lançadas. Oferta Bônus: Para obter o Auto-Trade Assistant EA GRATUITO para este in
Um novo Rei chegou à cidade - Indicador + Gestão de Ordens (TP1 + TP2 + TP3) + Enviador opcional de sinais para Telegram INCLUÍDO (GRÁTIS) (SISTEMA COMPLETO DE TRADING e SINAIS) Nosso melhor EA para Ouro: Gold Slayer Este indicador inclui uma estratégia avançada, um sistema de trading com gestão de ordens personalizável e um sistema de reversão à média que combina extensões de envelopes, apoiado por múltiplos filtros inteligentes de confirmação, como o RSI, para capturar entradas de reversão de
Smart Trend Trading System — MetaTrader 5 Após a compra, envie-me uma mensagem no MQL5 para receber Smart Universal Expert Advisor GRÁTIS, além do curso online, do manual em PDF e do acesso ao grupo privado. O STTS reúne a direção da tendência, sinais de entrada e saída, zonas de reversão e níveis de preço importantes diretamente no seu gráfico. Siga o sistema manualmente ou conecte um EA compatível separado para executar operações automaticamente com as configurações que você escolher. UM SISTE
Zoryk Gold
Reda El Koutbane
4.78 (18)
O desconto termina em 24 horas — próximo preço $ 69 ZORYK — Sistema avançado de sinais para XAUUSD no MetaTrader 5 Você conhece essa sensação. Você passa muito tempo analisando o ouro. Espera pela entrada certa. Finalmente abre a operação e o preço começa imediatamente a se mover contra você. Você fecha cedo demais, move o Stop Loss ou hesita por alguns segundos. Depois disso, o mercado alcança exatamente o destino que você esperava originalmente, mas sem você dentro da operação. O problema ne
O Entry Points Pro mostra onde entrar, onde colocar o stop e com qual lote operar — antes de você colocar a ordem. PREÇO Agora 149 USD, e esta é a última cópia por este preço. Depois o preço sobe para 199 USD, e o preço final é 349 USD. Eu ganho meu dinheiro operando nos mercados e mostro isso, por isso não preciso vender este indicador para todo mundo. É uma ferramenta para traders que pensam por conta própria, não um botão mágico. A seta aparece no fechamento da vela e não repinta. Duas confi
Tenha sua vantagem no trading à vista! M5 Sniper é um novo indicador da MeanFX. Ele combina sinais de trading precisos com níveis adaptativos de TP/SL — criando, como resultado, as melhores operações estatísticas possíveis! O preço aumenta a cada 5 compras, o próximo preço é de 69$ Envie-me uma mensagem após a compra para receber dicas/guia e um EA bônus O que o faz se destacar? Desempenho estatístico comprovado no Gold XAUUSD ( funciona em praticamente todos os ativos , com foco em dominar um ú
SuperScalp Pro
Van Minh Nguyen
4.54 (37)
SuperScalp Pro - Professional Multi-Layer Confluence Scalping System O SuperScalp Pro é um indicador avançado de scalping que aprimora o Supertrend clássico com vários filtros inteligentes de confirmação. Ele ajuda a identificar oportunidades de Buy/Sell com maior probabilidade de sucesso, reduzindo significativamente os sinais falsos. Setas claras de Buy e Sell aparecem diretamente no gráfico, juntamente com os níveis de Stop Loss e Take Profit baseados em ATR, calculados automaticamente em tem
Gold Trend Coach MT5
Cristhian Alexander Gaibor Cuasquer
4.2 (10)
Gold Trend Coach é um indicador de tendência para o ouro (XAUUSD) no MetaTrader 5 com sinais de compra e venda, stop loss e três take profit confirmados no fechamento da vela (não repinta), um coach que te guia da entrada até o TP3, um painel multi-timeframe e alertas no celular e no Telegram. Feito para scalping em M1 e M5 e intraday em M15 nas sessões de Londres e Nova York. BÔNUS: EA de auto-trading GRÁTIS para o Gold Trend Coach. Me envie uma mensagem depois da compra e eu envio o EA que ope
GoldenX Entry MT5
VividMind Digital Solutions
5 (17)
GoldenX Entry é um indicador para MT5 com um algoritmo adaptativo Smart Entry Trend, um sistema de pontuação de sinais, um detector de regime de mercado e um filtro de volatilidade. Cada sinal inclui um nível de entrada calculado, três níveis de Take-Profit (TP1, TP2, TP3) e um nível de Stop-Loss. Ele é construído sobre múltiplas camadas analíticas projetadas para se adaptar a diferentes condições de mercado, combinando um sistema analítico multicamadas com um otimizador integrado e um sistema d
SMC Intraday Formula
VividMind Digital Solutions
5 (26)
Vamos ser honestos primeiro. Nenhum indicador sozinho vai te tornar lucrativo. Se alguém te disser o contrário, está te vendendo um sonho. Qualquer indicador que mostre setas perfeitas de compra/venda pode ser feito para parecer impecável — basta dar zoom na parte certa da história e tirar um print das operações vencedoras. Nós não fazemos isso.  SMC Intraday Formula é uma ferramenta. Ela lê a estrutura do mercado para você, identifica as zonas de maior probabilidade de preço e mostra exatament
Gann Made Easy   é um sistema de negociação Forex profissional e fácil de usar, baseado nos melhores princípios de negociação usando a teoria do sr. W. D. Gann. O indicador fornece sinais precisos de COMPRA e VENDA, incluindo níveis de Stop Loss e Take Profit. Você pode negociar mesmo em movimento usando notificações PUSH. Entre em contato comigo após a compra para receber instruções de negociação e ótimos indicadores extras gratuitamente! Provavelmente você já ouviu muitas vezes sobre os método
Ultra Indicator
Ihor Otkydach
5 (1)
O ULTRA é um indicador técnico que funciona numa base «tudo-em-um» — analisa o mercado de forma independente, gera sinais de negociação, apresenta níveis para definir ordens de stop-loss e sugere quando encerrar as negociações para garantir lucros ou minimizar perdas. Por outras palavras, não importa se não sabe analisar o mercado, determinar níveis — onde definir o seu stop-loss — ou se tem dificuldades com a gestão do capital. O ULTRA fará tudo isso por si! BÓNUS PARA O COMPRADOR: Após adquiri
Boba Analysis Suite
Trade Ready Solutions LLC
5 (2)
Boba Analysis Suite O Boba Analysis Suite é um indicador de análise para o MetaTrader 5. Reúne a estrutura do mercado, as zonas de preço relevantes e o contexto geral do mercado numa única visualização do gráfico. Desenvolvido a partir da experiência prática como trader e formador de traders, apoia um processo de análise estruturado: avaliar a direção do mercado, identificar níveis importantes e analisar vários períodos gráficos em conjunto. Análise em contexto O significado de cada sinal depend
Próxima Atualização — Versão 2.52 em Breve! [NOVO] Prepare-se para 4 Grandes Novos Recursos Projetados para Aprimorar sua Análise de Mercado e seu Fluxo de Trabalho de Trading Estamos levando a análise de mercado a um novo nível com 4 novos recursos desenvolvidos para atender às suas necessidades de trading. Apresentamos: 1. TRADE OVERVIEW DASHBOARD 2. CONFLUENCE AT ZONE 3. STRONG & WEAK HIGH/LOW 4. OTE 1. TRADE OVERVIEW DASHBOARD Um painel que ajuda você a compreender mais facilmente o panoram
M1 Sniper MT5
Oleg Rodin
5 (7)
O   M1 SNIPER   é um sistema indicador de negociação fácil de usar. É um indicador de seta projetado para o período M1. O indicador pode ser usado como um sistema independente para scalping no período M1 e pode ser usado como parte do seu sistema de negociação existente. Embora este sistema de negociação tenha sido projetado especificamente para negociação no M1, ele também pode ser usado em outros períodos. Originalmente, desenvolvi este método para negociar XAUUSD e BTCUSD. Mas considero-o úti
Gold Entry Sniper
Tahir Mehmood
5 (23)
Gold Entry Sniper – Painel ATR Multi-Tempo Profissional para Scalping e Swing Trading em Ouro Gold Entry Sniper é um indicador avançado para MetaTrader 5 projetado para fornecer sinais de compra/venda precisos para XAUUSD e outros ativos, com base na lógica de Trailing Stop ATR e análise multi-tempo . Ideal tanto para scalpers quanto para swing traders. Principais Recursos e Vantagens Análise Multi-Tempo – Veja a tendência de M1, M5 e M15 em um único painel. Trailing Stop Baseado em ATR – Níveis
FiboSniper Pro
Van Minh Nguyen
5 (4)
FiboSniper Pro – Multi-Filter Fibonacci System with Auto SL/TP and Control Panel FiboSniper Pro é um indicador técnico que combina Fibonacci Envelopes dinâmicos com vários filtros de confirmação para gerar sinais seletivos de Buy e Sell. Os níveis de Fibonacci são calculados com base em Moving Average e ATR e, em seguida, filtrados por ADX, EMA, RSI, ATR, Volume, Time e estrutura das velas. O indicador exibe diretamente no gráfico os níveis automáticos de Stop Loss e Take Profit baseados em ATR,
ARICoins
Temirlan Kdyrkhan
ARICoin is a powerful trading companion designed to generate high-probability entry signals with dynamic TP/SL/DP levels based on volatility. Built-in performance tracking shows win/loss stats, PP1/PP2 hits, and success rates all updated live. Key Features: Buy/Sell signals with adaptive volatility bands Real-time TP/SL/DP levels based on ATR Built-in MA Filter with optional ATR/StdDev volatility Performance stats panel (Success, Profit/Loss, PP1/PP2) Alerts via popup, sound, push, or email Cust
ScalpPoint
Temirlan Kdyrkhan
ScalpPoint is a powerful trading companion designed to generate high-probability entry signals with dynamic TP/SL/DP levels based on volatility. Built-in performance tracking shows win/loss stats, PP1/PP2 hits, and success rates — all updated live. Key Features: Buy/Sell signals with adaptive volatility bands Real-time TP/SL/DP levels based on ATR Built-in MA Filter with optional ATR/StdDev volatility Performance stats panel (Success, Profit/Loss, PP1/PP2) Alerts via popup, sound, push, or emai
Auto Optimized SpeedAngle é um sistema de vetorização de momentum de nível institucional que elimina o sobreajuste ( curve-fitting ) por meio da otimização contínua de avanço ( Walk-Forward Optimization , WFO). Em vez de depender de entradas estáticas que se degradam quando os regimes de mercado mudam, o indicador recalibra dinamicamente seus parâmetros utilizando validação fora de amostra ( Out-of-Sample , OOS), garantindo que os sinais exibidos representem vantagens estatísticas genuínas e não
Adaptive Price Action Engine Compre um indicador, ganhe o EA de graça Análise Auto-Otimizada de Tendências e Padrões de Candlestick em Múltiplos Timeframes Os mercados estão em constante mudança, e nem todos os padrões de Price Action têm o mesmo valor em todas as condições de mercado. O Adaptive Price Action Engine foi desenvolvido para se adaptar às mudanças nas condições do mercado, combinando estrutura de tendência, análise Multi-Timeframe, padrões de candlestick e otimização estatística em
Crystal Heikin Ashi Signals
Muhammad Jawad Shabir
5 (5)
Crystal Heikin Ashi Signals—Professional Trend & Signal Detection Indicator Advanced Heikin Ashi Visualization with Intelligent Signal System for Manual & Automated Trading Final Price: $149 ---------> Price goes up $10 after every 10 sales . Limited slots available — act fast . Overview User Guide PDF Crystal Heikin Ashi Signals is a professional-grade MetaTrader 5 indicator that combines pure Heikin Ashi candle visualization with an advanced momentum-shift detection system. Designed for both m
O Scalper Vault é um sistema de negociação poderoso e completo, projetado para traders que buscam consistência em operações intraday. Este indicador de alta precisão funciona como um sistema de negociação autônomo, oferecendo análises de nível institucional tanto para o mercado Forex quanto para Opções Binárias. ENTRE EM CONTATO COMIGO APÓS A COMPRA PARA RECEBER DICAS DE NEGOCIAÇÃO E UM BÔNUS EXCLUSIVO! Ao eliminar suposições e análises manuais complexas, o Scalper Vault permite que você foque
Trend Catcher ind mt5
Ramil Minniakhmetov
5 (18)
INDICADOR TREND CATCHER O Indicador Trend Catcher analisa os movimentos de preços do mercado, utilizando uma combinação de indicadores de análise de tendências adaptativos, proprietários e personalizados pelo autor. Identifica a verdadeira direção do mercado, filtrando o ruído de curto prazo e focando a força do momentum subjacente, a expansão da volatilidade e o comportamento da estrutura de preços. Utiliza também uma combinação de indicadores personalizados de suavização e filtragem de tendê
Tokyo mt5 Indicator
Vasiliy Strukov
5 (15)
O Tokyo Indicator oferece uma visão geral visual clara da direção da tendência, de possíveis sinais de negociação e das condições de mercado. Sua linha de tendência em degraus e codificada por cores distingue as fases de alta (azul) das fases de baixa (magenta). Setas direcionais correspondentes destacam possíveis oportunidades de compra e venda quando a tendência exibida muda. Um painel integrado reúne o sinal atual, o viés de mercado, o momentum, a volatilidade e a qualidade do sinal em uma v
Atomic Analyst MT5
Issam Kassas
4.5 (64)
Atomic Analyst — MetaTrader 5 Após a compra, envie-me uma mensagem no MQL5 para receber Smart Universal Expert Advisor GRÁTIS, além do curso online, do manual em PDF e do acesso ao grupo privado. O Atomic Analyst reúne a ação do preço, a direção da tendência, sinais de entrada e saída, Stop Loss e vários níveis de Take Profit diretamente no seu gráfico. VEJA O SINAL. ENTENDA O CENÁRIO. O Atomic Analyst organiza sua análise em informações visuais claras: • Setas de compra e venda para identificar
Unix Scalper
Issam Kassas
4 (4)
Unix Scalper — MetaTrader 5 Após a compra, envie-me uma mensagem no MQL5 para receber Smart Universal Expert Advisor GRÁTIS, além do curso online, do manual em PDF e do acesso ao grupo privado. Identifique a oportunidade. Veja o plano. Escolha como operar. O UNIX Scalper reúne análise de mercado, decisões BUY/SELL/WAIT e níveis de Entry, Stop Loss, TP1 e TP2 em um painel organizado. VEJA O SINAL E O PLANO • Decisões claras: BUY, SELL ou WAIT. • Níveis definidos: Entry, Stop Loss, TP1 e TP2. •
SIO Oscillator: oscilador auto-otimizável de desequilíbrio de semivariância Compre o indicador e receba GRÁTIS o Expert Advisor (EA) baseado nele. A maioria dos osciladores trata todo movimento de preço da mesma forma. O SIO separa a pressão de alta da pressão de baixa e mede o desequilíbrio entre elas, mostrando qual lado realmente controla o mercado: compradores ou vendedores. Quando o desequilíbrio atinge um extremo, o SIO gera um sinal claro com níveis de entrada, Stop Loss e Take Profit. O
Volatility Master for MetaTrader is a real-time dashboard tool that scans up to  50 symbols  to identify high-volatility , trending markets instantly. With bullish/bearish signals, customizable alerts, and a user-friendly interface, it helps you avoid range-bound conditions and focus on high-probability trades. Clarity leads to confidence. Trade confidently and protect your capital effectively with this powerful dashboard. We don't offer free or bonus indicators in exchange of reviews from you.
Smc Pro ToolKit
Talal N Z Aljarusha
5 (14)
SMC PRO TOOLKIT — SMART MONEY ANALYSIS & STRUCTURED TRADE PLANNING SMC Pro ToolKit is a professional Smart Money Concepts analysis workspace for MetaTrader 5. It combines market structure, multi-timeframe analysis, institutional price zones, setup evaluation, confirmation tools, volume context, alerts, and risk planning inside one organized chart environment. One workspace. Multiple layers of confirmation. One structured trading plan. OPEN COMPLETE USER GUIDE MULTI-CONDITION SETUP ENGINE At
Mais do autor
Pivot Stop Gold
Vasilii Makarenko
O Pivot Stop Gold é construído em torno de uma situação no ouro: o preço vira em um swing e depois o atravessa. O EA não persegue o movimento. Uma ordem stop pendente já está esperando perto do swing, com seu stop e alvo anexados, antes de o preço chegar lá. As posições são curtas: no relatório abaixo a média durou cinco minutos. O Nível Pivô Em cada novo bar do seu timeframe de trabalho o EA constrói um ZigZag a partir dos últimos 300 bars e pega os dois pivôs mais recentes, nunca contando o ba
Swept Liquidity Pools
Vasilii Makarenko
5 (1)
A liquidity sweep is a bar that pushes past a prior swing high or swing low, where protective stop orders tend to rest, and then closes back on the inner side of that level. The same event is known under several names: a stop hunt, a stop run, a liquidity grab, a false breakout, a failed breakout, or a swing failure. Swept Liquidity Pools marks those levels and those bars on the chart. The indicator tracks liquidity pools - confirmed swing levels that have not yet been taken - and marks the exac
FREE
Auto Level Map
Vasilii Makarenko
What Gets Drawn Most level tools mark every swing they can find, and a chart with forty lines answers nothing. This one keeps a level only when price came back to it, and prints the evidence next to the line: the number of touches and the age in days. Lines above current price and lines below it are drawn in different colours, so the map reads at a glance without counting. What Puts A Level On The Chart A swing high is a bar whose high is not lower than its neighbours on both sides, within the n
FREE
Three Anchors On One Chart Most volume weighted average lines restart once a day. This one draws three at the same time: one anchored to the current trading session, one to the day, one to the week. Their spread tells you something a single line cannot. When the session line sits far under the weekly one, the week has been trading higher than today is; when all three sit together, the market has spent the week in one place. Why The Session Anchor Is Not Midnight The session line starts where the
FREE
Hourly Spread Map answers one question: at which hours does this symbol cost more to enter, and by how much. It reads the spread field that the terminal stores in every closed M1 bar of your own broker feed, sorts those measurements into 24 hours by 7 days of the week, and shows the result as a grid in the indicator sub-window. What It Measures Every closed M1 bar carries one spread measurement. The indicator collects them over the period you choose, groups them by the hour and weekday of the ba
FREE
Trade Risk Desk answers one question at the moment you need it answered: what volume makes this stop cost exactly what you decided to risk. Drag the stop line to where it belongs on the chart and the panel prints the volume, the money behind it, and the margin the position will hold. What It Answers Set the risk as a percent of balance or as a fixed amount in account currency. Put the stop where your idea says it belongs. The panel reads the symbol settings your broker publishes and prints: the
FREE
Swap is the part of the cost that is easy to forget, because it arrives once a day, quietly, and never appears in the spread. Swap Cost Calendar puts it on the chart as a number you can act on. What It Shows The panel reads what the broker publishes for the current symbol and shows four things. The cost of one night for a long position and for a short one, in your account currency or in points. The weekday line, showing how many nightly charges a position carries on each day of the week. The tri
FREE
Range Zones M30
Vasilii Makarenko
Range Zones M30 draws zones on your chart where price was pushed back hard on the 30-minute timeframe. It works on any symbol and any chart timeframe, and reads only the prices your terminal already has. It does not use any server, does not send anything out, and does not open or change orders. What It Shows A resistance zone above the market and a support zone below it, as filled rectangles that start at the open of the swing candle that formed them and run to the right. At any moment there is
Signal Confirm
Vasilii Makarenko
Signal Confirm watches one symbol and tells you when a trend setup has passed a fixed chain of checks. It works on any symbol and any chart timeframe. It reads only the M1 prices, the prices of the oscillator timeframe (M5 by default) and the daily prices your terminal already has, does not use any server, does not send anything out, and does not open, change or close orders. It shows what happened and when; the decision stays with you. What It Does When the chain below is complete, the indicato
Volatility Dots
Vasilii Makarenko
Volatility Dots puts a trailing line of dots on your chart. In an uptrend the dots sit under the price, in a downtrend above it, and they flip when price closes through the opposite band. It works on any symbol and any timeframe. It reads only the prices your terminal already has, does not use any server, does not send anything out, and does not open or change orders. What It Shows One dot per bar. White dots under the candles mark a rising trend, red dots above the candles mark a falling trend.
Daily Range Ladder draws six horizontal levels across the current trading day. The distances come from how far the symbol usually travels in a day, so the levels adapt to every symbol without any setting. It works on any symbol and any chart timeframe. It reads only the daily bars your terminal already has, does not use any server, does not send anything out, and does not open or change orders. What It Shows Three resistance levels above the day's low and three support levels below the day's hig
Um pool de liquidez é uma máxima ou mínima de swing confirmada que ainda não foi tomada. Um sweep de liquidez é a barra na qual o preço negocia além desse nível e depois fecha de volta dentro do intervalo - o mesmo evento que os traders também chamam de caça ao stop, corrida ao stop, captura de liquidez ou rompimento falso. O Liquidity Sweep Pools MTF marca tanto os pools quanto os sweeps de liquidez feitos sobre eles, no gráfico atual e em um timeframe superior que você escolher, e adiciona um
Structure Desk
Vasilii Makarenko
Um expert advisor para XAUUSD no MetaTrader 5. Ele trabalha com uma cesta por vez: abre em um conjunto fixo de horas do servidor, adiciona à posição enquanto o preço se move contra ela, e fecha a cesta inteira de uma vez. Não há stop loss e não há take profit nas posições individuais. Como Ele Negocia Um símbolo, XAUUSD, uma cesta por vez, até 5 ordens na mesma direção. As entradas são permitidas apenas em horas fixas do servidor, e apenas quando o preço está na borda do seu intervalo de quatro
Sarveon
Vasilii Makarenko
Sarveon é um expert advisor para XAUUSD no MetaTrader 5. Nove estratégias independentes rodam lado a lado em um único gráfico. Cada uma tem seu próprio magic number, seu próprio timeframe de entrada e seu próprio conjunto de distâncias, e nenhuma delas jamais adiciona a uma posição aberta por outra. Como Ele Negocia Cada estratégia varre os candles recentes de seu próprio timeframe de entrada em busca de um nível de swing: uma máxima que nenhum candle posterior superou, ou uma mínima que nenhum
Ridgeline
Vasilii Makarenko
Ridgeline espera nos níveis de preço que o ouro deixou em paz. Ele lê barras diárias, marca as máximas e mínimas que nenhuma barra posterior superou, e coloca uma ordem stop pendente ali. Sete conjuntos de regras procuram em diferentes profundidades do histórico, então um pode estar esperando em um nível formado na semana passada enquanto outro observa um de três meses atrás. Um conjunto que sofre uma perda fica de fora por dois dias antes de colocar qualquer coisa novamente. Cada conjunto carre
Sixfold Gold
Vasilii Makarenko
Sixfold Gold trades XAUUSD on the hourly chart. It looks for the points where the market turned and left an extreme behind, places a pending stop order a little inside that level, and attaches a stop loss and a take profit before the order is ever filled. Six zones do this independently, each with its own search depth, and between them they read three timeframes and four sessions, so the advisor is rarely committed to a single view of the market. A trade that goes wrong is closed by its stop. No
GhBreak
Vasilii Makarenko
O GhBreak baseia-se em uma ideia sobre o ouro: um rompimento de uma máxima ou mínima de swing que se manteve desde que se formou pode correr o suficiente para pagar pelos rompimentos que falham. O EA não persegue o rompimento. Uma ordem stop pendente já está esperando no nível, com seu stop e alvo anexados, antes de o preço chegar lá. As posições são mantidas por pouco tempo: no relatório abaixo a média durou 22 minutos. O Nível de Swing Cada conjunto de regras constrói suas próprias barras - H2
Um Painel Em Vez De Cinco Janelas Ler um mercado geralmente significa manter várias janelas abertas ao mesmo tempo: uma média móvel para a direção, um oscilador para o momento, um indicador de força para distinguir uma tendência de um intervalo, e mais alguma coisa para os níveis. Cada um responde à sua própria pergunta no seu próprio canto da tela. O Signal Compass Desk coloca essas leituras em um único bloco no canto do gráfico. Uma olhada diz para que lado o mercado está inclinado, se o movim
Tessera builds a footprint (cluster) chart from the trade ticks that your MetaTrader 5 terminal already receives from your broker. Prices, volumes and sides come from your own data feed; the indicator does not use any external server, does not send anything out and does not read or store your account details. What It Shows Buy and sell volume inside each bar, price by price, with numbers when they fit. Delta of the bar (the difference between buy and sell volume), cumulative delta and a delta st
What You See On The Chart Swing Percentile Desk places one table on one chart. Each row is a symbol from your watchlist and each column is a pullback size. A cell tells you what share of that symbol's earlier moves the current move has already outdone. A low number means a young move; a high number means the move is stretched compared with the history of the same symbol. Every symbol is compared only with itself, so a quiet pair and a restless pair are read on the same scale and no manual measur
Session Open Carry
Vasilii Makarenko
Session Open Carry is built on one idea: the side on which a session opened shows which way to hold a position until the next day. Once a day, at a set minute, the EA compares the last price with the open of the session. Price above the open - it buys. Price below the open - it sells. Price at the open - it stays out. The stop is placed at the extreme of the session, the position is carried overnight and it is closed at a set minute on a later day. The EA tests this idea on every session and doe
Gold Brackets
Vasilii Makarenko
O Gold Brackets é construído sobre uma ideia sobre o ouro: o preço que retorna a uma máxima ou mínima de swing que se manteve intacta frequentemente a atravessa com força, e uma ordem stop à espera no nível captura esse movimento sem persegui-lo. O EA coloca a ordem pendente antecipadamente, com o stop loss e o take profit já anexados, e a cancela quando o nível deixa de ser válido. O Nível de Swing Cada conjunto de regras observa barras horárias para a máxima e a mínima de swing mais próximas:
Filtro:
Sem comentários
Responder ao comentário