Candle Clock Desk

What It Shows

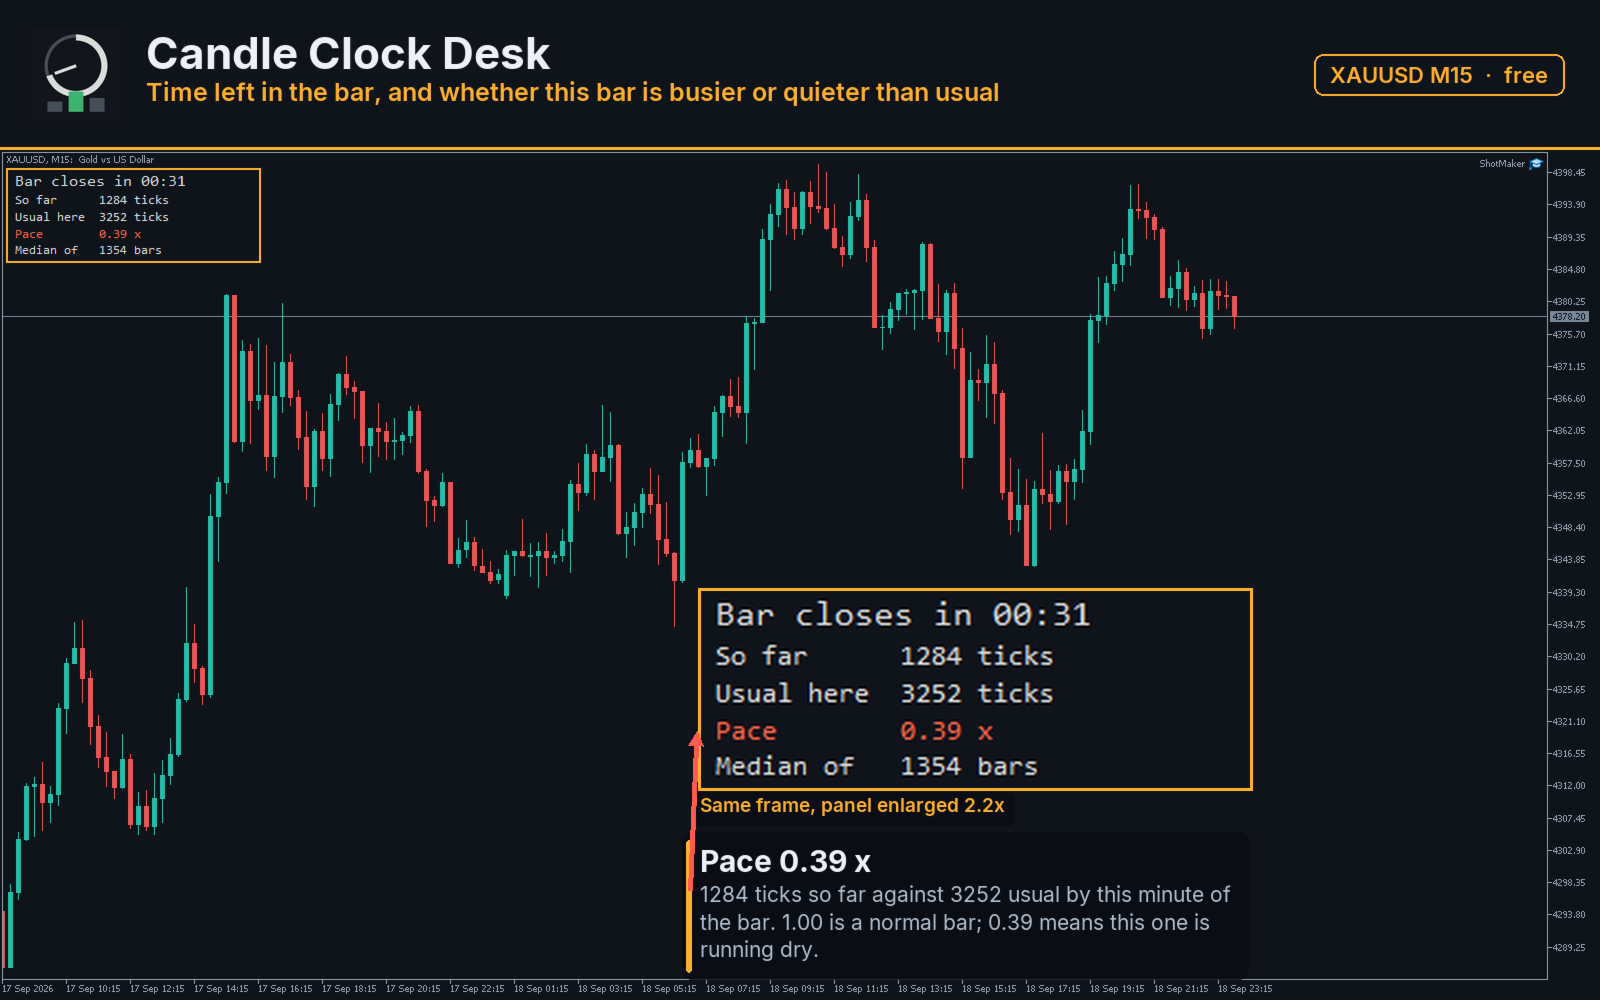
Candle Clock Desk puts four lines on the chart. The first is the time left until the current bar closes. The next three answer a question the clock alone cannot: is this bar unusually busy, or unusually quiet, right now.

  • Bar closes in - the countdown, in minutes and seconds
  • So far - volume this bar has accumulated since it opened
  • Usual here - what this symbol had accumulated by this same minute, in the past
  • Pace - the first divided by the second

The Pace Line

Pace of 1.00 means the bar is filling exactly as it normally does at this point. 2.00 means twice the usual volume has already arrived. 0.40 means the bar is running dry. The figure is not a signal and is not tied to direction: it says how much trading is happening, not where price is going.

Where The Usual Figure Comes From

The comparison is built from M1 bars your terminal already holds. Every M1 bar belongs to exactly one bar of the chart timeframe, and its position inside that bar is known from the timestamps. For each minute of the bar the panel takes the volume accumulated by that minute in every finished bar of the history window, and keeps the median.

A simpler method would be to take the volume of the whole bar and multiply it by the share of time elapsed. That method is wrong on every instrument with a session: volume does not arrive evenly. The open, the London and New York overlap and the minutes around a release carry far more of it than the middle of the bar. The median profile keeps that shape instead of flattening it.

The median, not the average, is used on purpose. One release day with ten times the normal volume moves an average for weeks; the median stays where the ordinary bars are.

Reading It During A Session

Open the chart, let the terminal pull its M1 history, and watch the Pace line through one session. It sits near 1.00 for long stretches and climbs when something arrives. Compare a reading above 2.00 with the Market Watch and with the news calendar for that minute: the panel and the tape describe the same event from two sides.

When the history window holds fewer finished bars than MinBarsForMedian for a given minute, the panel prints that the median is not available rather than showing a figure built on two samples.

Input Parameters

  • HistoryDays - days of M1 history the median is built from
  • VolumeSource - tick volume, or real volume where the broker supplies it
  • MinBarsForMedian - how many finished bars a minute needs before its median is shown
  • MaxM1BarsToScan - hard cap on how many M1 bars are read
  • ShowPanel - draw the panel or keep only the buffers
  • PanelCorner - corner of the chart, offsets, font size
  • ColorFast - colour used when the pace is at or above 1.00
  • ColorSlow - colour used when it is below
  • ObjectPrefix - prefix for every chart object created

Reading The Figures From An Expert Advisor

Four buffers are published and available through iCustom: buffer 0 is the seconds left in the current bar, buffer 1 is the volume accumulated so far, buffer 2 is the median for this minute, buffer 3 is the pace. Buffer 2 and buffer 3 return an empty value while the median is not available, so an expert advisor can tell "quiet" from "not measured yet".

Requirements

Any symbol and any timeframe from M5 upward; the profile is built from M1 history, so an M1 chart has nothing to compare against and the panel then shows the clock and the volume only. The indicator places no orders, writes nothing to disk and works the same on a demo and a live account of the same broker.

Support

Questions about a parameter, or a case where the panel and your terminal disagree: reply in the comments of this page with the symbol, the timeframe and the broker, and I will look into it. Ratings help other traders decide whether a free tool is worth their time, whichever way they go.

추천 제품
Basic Theme Builder MT5
Mehran Sepah Mansoor
5 (2)
Basic Theme Builder: 차트 맞춤화를 간편하게 Basic Theme Builder 지표로 거래 경험을 혁신하세요. 이 다용도 도구는 MetaTrader 5 에서 차트의 외관을 간편하게 사용자 맞춤화할 수 있도록 설계된 직관적인 패널을 제공합니다. 다양한 테마와 색상 스킴을 간단히 전환하여 거래 환경의 시각적 매력과 기능성을 향상시킬 수 있습니다. Free MT4 version Basic Theme Builder 지표는 MetaTrader 5 차트를 손쉽게 개인화하려는 거래자에게 최적의 도구입니다. 간단한 패널 인터페이스와 다양한 테마 프리셋을 통해 거래 스타일이나 기분에 맞게 차트의 외관을 빠르게 조정할 수 있습니다. 클래식한 룩부터 현대적인 미학까지, Basic Theme Builder는 시각적 경험을 향상시키고 집중력을 높이는 데 도움이 되는 다양한 옵션을 제공합니다. 오늘 이 실용적이고 사용하기 쉬운 지표로 거래 환경을 최적화하세요. 주요 기능: 간편한 테마 관
FREE
Support And Resistance Levels MT5
Abdelkhabir Yassine Alaoui
Support And Resistance indicator that can display round levels and zones . It shows them directly on the chart, providing an easy help when you want to set stop-loss or take-profit level, or when you want to see the next market target.   If an asset price is moving down and bounces back up, the level is called support (think: price floor). If an asset price is moving upward and hits a level where it reverses downward, this is called resistance (think: price ceiling).
FREE
IQuantum
Evgeniy Scherbina
The indicator IQuantum shows trading signals for 10 symbols in the daily chart: AUDCAD, AUDUSD, EURUSD, GBPCAD, GBPCHF, GBPUSD, NZDUSD, USDCAD, USDCHF, and USDJPY. Signals of the indicator are produced by 2 neural models which were trained independently from one another. The inputs for the neural models are normalised prices of the symbols, as well as prices of Gold, Silver and markers of the current day. Each neural model was trained in 2 ways. The Ultimate mode is an overfitted neural model
FREE
Advanced Market Sessions 지표로 시장의 리듬을 마스터하세요. 트레이딩에서 타이밍은 모든 것입니다. 주요 금융 센터가 언제 개장하고 마감하는지 정확히 아는 것은 시장 변동성, 유동성, 방향성 바이어스(directional bias)를 이해하는 열쇠입니다. 이 지표는 아시아, 런던, 뉴욕이라는 세 가지 주요 거래 세션에 대한 명확한 시각적 가시성을 제공합니다. 실시간으로 각 세션의 정확한 고가(High)와 저가(Low)를 자동으로 매핑함으로써, 이 도구는 진정한 기관의 맥락에서 거래할 수 있도록 역량을 부여합니다. 스마트 머니 컨셉(SMC), ICT, 돌파 전략, 평균 회귀 중 어떤 매매를 하든 세션의 경계를 아는 것은 고확률 트레이딩 셋업을 찾는 데 매우 중요합니다. 핵심 장점: 유동성 풀 식별: 세션 고가와 저가는 가격의 자연스러운 자석입니다. 유동성이 머무는 곳을 쉽게 찾아내고 잠재적인 돌파나 가짜 돌파(스탑 헌트)를 예측하세요. 세션 겹침(Overlaps) 활
FREE
SpreadMeter OGT Free
Dmitriy Gurenko
5 (1)
The indicator shows the current spread of the symbol, the minimum, average and maximum values for the current bar in the form of digital, analog and graphic indicators. Has two modes of operation: fixing the system spread, or calculating the spread as the difference between the "Bid" and "Ask" prices on each incoming tick. Parameters  The indicator has a single input parameter: Type of calculation  - type of spread calculation. It can take the following values:  System spread  - the spread value
FREE
VFI Quantum
Nikita Berdnikov
5 (1)
Introducing VFI (Volume Flow Indicator) – a trading indicator that analyzes the relationship between volume and price movement to identify key trading opportunities. The indicator displays the strength and direction of volume flow, providing clear signals about potential entry and exit points. Signals are formed based on zero line crossovers, crossovers between the VFI line and its exponential moving average (EMA), and when the indicator exits overbought and oversold zones. Attention! This stra
FREE
Fractals MT5 FX
Diego Alejandro Guzman
Fractals MT5 FX   Fractales personalizables con período ajustable Descripción breve Indicador avanzado de fractales para MetaTrader 5 que permite definir el número de velas a ambos lados del pico o valle, y personalizar el símbolo de las flechas. Ideal para identificar niveles de soporte y resistencia dinámicos, así como puntos de inflexión en la tendencia. Características principales Período ajustable:   El parámetro "Número de velas" ( Fr_Period ) permite elegir cuántas velas a la izquierda y
FREE
Moving Spread
Jose Maria Molina Sanchez
Moving Spread – 실시간 시장 비용 모니터 평균 스프레드를 실시간으로 모니터링하고 고비용 기간의 거래를 피하세요. 이 지표의 기능 Moving Spread 는 시간이 지남에 따라 시장의 평균 스프레드(포인트 단위) 를 측정하여 그 변동을 보여줍니다. 이는 진입 비용이 너무 높을 때를 파악하는 데 필수적인 도구입니다. 이러한 상황에서는 거래 시작 전에 이미 수익이 줄어들 수 있습니다. 왜 이것이 중요한가요? 높은 스프레드는 시장 진입 및 청산 시 더 많은 비용을 지불한다는 것을 의미합니다. 이 지표는 이러한 순간을 식별하고 비용이 과도할 때 거래를 피하는 데 도움을 줍니다. 작동 방식 별도의 창에서 현재 스프레드를 표시 하며, 평균값을 나타내는 빨간색 선이 있습니다. 스프레드가 정의된 임계값(예: > 0)을 초과하면 자동 알림 을 제공합니다. 스캘퍼 및 당일 트레이더에게 이상적 이며, "블리딩"(지속적인 손실)로 인한 숨겨진 손실을 방지하는 데 도움이 됩니
FREE
Strifor Lot Calculator — MetaTrader 5용 인디케이터로, 트레이더가 설정한 리스크와 스톱로스 기반으로 최적의 로트 크기를 계산할 수 있습니다. 더 의식적인 거래, 리스크 관리, 수동 계산 시간 절약에 유용합니다. 장점 정확한 리스크 관리 — 선택한 리스크 비율에 따라 로트 크기 자동 계산 두 가지 모드 — 수동 입력 또는 차트 라인 기반 계산 인기 상품 지원 — 통화쌍, 금(XAUUSD), 원유(USOIL/WTI), 지수(US500 등) 차트에서 빠른 시각적 거래 계획 실제 계좌 잔액 기반 로트 계산 입력 파라미터 Deposit — 수동 입금액 (또는 0 = 현재 계좌 잔액 사용) RiskPercent — 거래당 리스크 (%) StopLossPips — 스톱로스 (수동 모드만) Mode — true = 수동 모드, false = 라인 모드 작동 모드 수동 모드 Deposit, Risk, Stop-Loss 입력 → 최적 로트 계산 라인 모드 차트에 수평선
FREE
Support Resistance Dynamic
Quang Huy Quach
5 (2)
The "Support Resistance Dynamic" indicator is a powerful technical analysis tool for the MetaTrader 5 platform, designed to automatically identify and plot dynamic Support and Resistance zones on price charts. This indicator helps traders easily recognize important price levels, potential reversal points, or breakout areas, thereby enabling more informed trading decisions. 2. Key Features Dynamic S/R Identification : Automatically identifies support and resistance zones based on an advanced Pivo
FREE
Spread Monitor MT5
Fabio Cavalloni
5 (1)
This is a usefull utility for monitoring spread and also for recording informations to a file. (Files will be placed into "Common\Files\Spread Monitor"). There is the possibility to let the indicator calculate high/low into the past thanks to downloading ticks. (It's a slow and approsimate thing! The best way to use it is to attach to a chart and let it recording spread in real time). There is also a buffer with the average of spread in latest X periods. Easy and effective.
FREE
FVG Metrics
Kim Raphael Reitz
5 (1)
FVG Indicator (Current Timeframe Zones and Multi-Timeframe Count Panel) This indicator detects and draws Fair Value Gap zones on the current chart timeframe only. It also includes a multi-timeframe panel that shows how many active (unmitigated)  zones exist on selected timeframes. This indicator detects and draws Fair Value Gap zones on the current chart timeframe . It can also display a panel with the number of active zones on selected timeframes. The indicator shows bullish and bearish zone
FREE
Matrix Arrow Indicator Multi Timeframe Panel MT5 는 Matrix Arrow Indicator MT5 를 위한 무료 추가 기능이자 훌륭한 자산입니다. 5개의 사용자 맞춤형 타임프레임과 총 16개의 수정 가능한 기호/기기에 대한 현재 매트릭스 화살표 표시기 MT5 신호를 보여줍니다. 사용자는 Matrix Arrow Indicator MT5 로 구성된 10개의 표준 표시기를 활성화/비활성화할 수 있습니다. Matrix Arrow Indicator MT5 에서와 같이 10개의 모든 표준 지표 속성도 조정 가능합니다. 매트릭스 화살표 표시기 다중 시간 프레임 패널 MT5는 16개의 수정 가능한 기호 버튼 중 하나를 클릭하여 첨부된 현재 차트를 변경할 수 있는 옵션도 제공합니다. 이렇게 하면 다른 기호 간에 훨씬 빠르게 작업할 수 있고 다시는 거래 기회를 놓치지 않을 수 있습니다. 이 무료 Matrix Arrow Indicator Multi Timef
FREE
Algorion Bias Master Professional Multi-Timeframe Market Bias Indicator for MetaTrader 5 Algorion Bias Master is a professional multi-timeframe market bias indicator for MetaTrader 5 that helps traders identify the dominant market direction before entering a trade. Instead of generating simple Buy or Sell signals, the indicator evaluates market structure using multiple technical factors, including trend direction, trend strength, volatility, momentum, and breakout conditions, to produce a struc
FREE
Show Pips for MT5
Roman Podpora
4.5 (32)
이 정보 표시기는 계정의 현재 상황을 항상 알고 싶어하는 사람들에게 유용합니다. VERSION MT 4 -   More useful indicators 표시기는 포인트, 백분율, 통화 단위의 이익뿐만 아니라 현재 쌍의 스프레드와 현재 기간에서 막대가 마감될 때까지의 시간과 같은 데이터를 표시합니다. 차트에 정보선을 배치하는 데는 여러 가지 옵션이 있습니다. 가격 오른쪽(가격보다 뒤에 있음) 코멘트(차트의 왼쪽 상단) 화면의 선택된 모서리에 있습니다. 정보 구분 기호를 선택할 수도 있습니다. | / \ # 이 표시기는 사용하기 쉽고 매우 유익합니다. 설정에서 불필요한 정보 항목을 비활성화할 수 있습니다. 설정 외모의 종류       - 정보 라인 표시 유형. 세 가지 옵션이 있습니다: 가격을 따르세요       - 가격을 따르세요. 댓글로       - 코멘트로; 화면의 선택된 모서리에서       - 화면의 선택한 모서리에 있습니다. 첨부용 그래프 코너       - 화면의 선택한
FREE
Dual Striker - 금 거래를 위한 새로운 EA입니다. 실시간 시그널 +150% ->   실거래 계좌 마틴게일 없음, 물타기 없음 거래 플랫폼에서 무료로 테스트해 보세요:   Dual Striker EA True MACD Divergence — 고품질 MACD 다이버전스 지표 대부분의 다이버전스 지표는 거의 모든 국지적인 고점과 저점에서 신호를 생성하기 때문에 차트가 의미 없는 다이버전스와 잘못된 신호로 빠르게 가득 차게 됩니다. True MACD Divergence 는 가격 구조를 분석하는 독자적인 필터링 알고리즘을 사용하여 가장 신뢰도가 높은 다이버전스만 표시합니다. 이 지표의 목적은 가능한 한 많은 다이버전스를 찾는 것이 아니라, 트레이더가 실제로 중요한 시장 상황에 집중할 수 있도록 돕는 것입니다. 주요 기능 강세 및 약세 MACD 다이버전스를 자동으로 탐지합니다. 잘못된 신호를 지능적으로 필터링합니다. 확인된 다이버전스만 표시합니다. 모든 금융상품과 모든 시간대(T
FREE
The CV MACD Indicator is a modern and professional momentum indicator designed to analyze trend strength, market direction and potential reversals. By combining the MACD line, signal line and histogram, the indicator helps traders identify market momentum and high-quality trading opportunities with clarity and precision. Features: Precise MACD momentum analysis Early trend reversal detection Clear histogram for market strength visualization Adjustable Fast, Slow and Signal periods Visual Buy & S
FREE
Fabii Supertrend NMA
Fabien Georges Andre Guillemaud
A SuperTrend that stops whipsawing in ranges — its adaptive NMA center cuts the false flips. Any pair, any timeframe. No repaint — signals are final on bar close. Free. Test it in the Strategy Tester in seconds. THE PROBLEM A classic SuperTrend centers its bands on the raw median price. In a range, that center chases every wiggle, so the line flips color again and again and hands you a string of false reversals. You end up either overtrading the noise or distrusting the tool. WHAT
FREE
Force Candle Pro
Samuel Henrique Almeida Ferreira
5 (2)
Force Candle Pro is an advanced indicator designed to identify strong momentum candles in the market, helping traders detect high-probability movements and institutional activity. This tool analyzes candle strength based on body size, volatility, and directional consistency, filtering out weak and indecisive movements. Unlike common indicators, Force Candle Pro focuses on market impulse, allowing traders to identify when the market is truly moving with strength. MAIN FEATURES: - Detection o
FREE
HCS SessionPulse
HADDEN CAPITAL SOLUTIONS LLC
HCS SessionPulse is a free, read-only global trading session monitor for MetaTrader 5. A compact on-chart panel shows the current status of the Sydney, Tokyo, London, and New York trading sessions and continuously counts down to upcoming session transitions. SessionPulse displays: • Sydney session OPEN/CLOSED status • Tokyo session OPEN/CLOSED status • London session OPEN/CLOSED status • New York session OPEN/CLOSED status • Time remaining until each session's next open or close • Currently
FREE
Sessions Indicateur
Marc Guy Verzotti
4 (2)
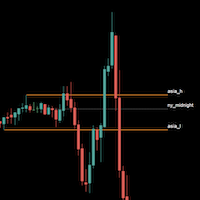
Sessions are very important in trading and often good area where to look for setup. In SMC, ICT we will look for Asian session to serve as liquidity This indicator displays: High & Low of the Asia session Midnight New York time opening line Congifuration Line Style, color Label position, size, color Start of the level (Start of the day, Start of the session, Highest or Lowest point in the session) Any questions or comments, send me a direct message here  https://www.mql5.com/en/users/mvonline
FREE
Average Position Price Monitor is a position information indicator designed for MetaTrader 5. When multiple BUY or SELL positions are open on the same symbol, the indicator automatically calculates the volume-weighted average entry price for each direction and displays important position, profit/loss, Stop Loss and Take Profit information directly on the chart. The indicator is designed to help traders manage multiple positions without checking every individual position manually. Main Features V
FREE
Coral Indi
Dinh Duong Luong
Coral trend is   a trend-following indicator that is widely popular among FOREX traders . It is usually used as a confluence with other indicators. It uses combinations of moving averages with complex smoothing formulas! It has two configurable parameters: Coefficient   - smoothing ratio (*) Applied price Calculation: Coral = (-0.064) * B6 + 0.672 * B5 - 2.352 * B4 + 2.744 * B3
FREE
ICT Killzones and Liquidity Levels is a clean chart tool that marks the main ICT killzones and key liquidity levels directly on your chart. It is designed for traders who follow Smart Money Concepts and ICT-style price action and want a simple, non-repainting reference on the chart. The indicator draws the Asian, London, New York and London Close killzones as boxes based on the session high and low. A vertical line marks the start of each killzone for the current day, so you can see when each se
FREE
ATR Dynamic Pivot Signals Indicator
SkyBlue Fintech Solutions LLP
Unlock Precision Trading: The ATR Dynamic Pivot System Download this free   ATR Pivot Signals   indicator and instantly gain an edge against market noise. This is the ultimate tool for traders who demand high-conviction entry points based on genuine market swing reversals, not guesswork. The   ATR Pivot Signals   system   is an innovative technical indicator that utilizes the Average True Range (ATR) to dynamically filter volatility, ensuring that a signal is triggered only when a price move is
FREE
ACI Bollinger Bands
Marat Sultanov
4 (3)
Tired of adjusting the indicator settings losing precious time? Tired of the uncertainty regarding their efficiency? Afraid of the uncertainty in their profitability? Then the indicator ACI (automatically calibrateable indicator) is designed exactly for you. Launching it, you can easily solve these three issues just performing the simplest action: clicking a single Calibrate button. To achieve the highest efficiency, you should perform another additional action: move the power slider to the maxi
FREE
Volatility Break Signals
Mahefa Raveloson
5 (1)
Volatility Break Signals Description: The  Volatility Break Signals  is an indicator designed to detect potential trend changes while partially filtering market noise. It uses an adaptive volatility measure based on the selected price (Close, Open, High, Low, etc.) and generates Buy and Sell signals when the price shows a reversal relative to the previous direction. How it works: Price Volatility Measurement The indicator calculates the absolute price changes from bar to bar ( |price - previous
FREE
Trade Behavior Mirror는 오직 자신의 계좌에서 이미 청산된 거래 이력만 읽어서, 손실이 확정된 직후에 평소보다 큰 랏으로 새 포지션을 여는 패턴 하나만을 셉니다. 이 도구는 아무것도 예측하지 않고 아무런 조언도 하지 않습니다. 패널에 나오는 모든 숫자는 이 계좌에서 이미 일어난 일입니다. 숫자가 만들어지는 방식: 모든 종목과 모든 매직 넘버를 대상으로 최대 31일치 청산된 거래를 읽습니다 - 이는 차트의 종목만이 아니라 계좌 전체에 대한 그림입니다. 오늘 이전 30일 동안의 일별 신규 진입 건수의 중앙값과, 그 진입들의 랏 크기 중앙값을 계산합니다. 평균이 아니라 중앙값을 쓰는 이유는, 유난히 큰 거래 하나가 전체 기준을 왜곡하지 않도록 하기 위해서입니다. 이 30일 구간 안에 진입이 5건 미만이면 공정한 기준을 세우기에 이력이 충분하지 않다고 보고, 너무 적은 데이터로 만든 숫자 대신 "Collecting history"를 표시합니다. 핵심 집계는 패널에서 En
FREE
Market Hours Pro
Musa Terrance Khosa
Market Hours Pro shows Tokyo, London, and New York trading sessions directly on your MT5 chart, including scheduled overlap periods. It’s designed to give you a clear view of global market timing so you can plan trades, spot high-activity periods, and align strategies with standard Forex hours. How It Works Displays scheduled session times visually on your chart. Highlights session overlaps for London/New York and Tokyo/London. Automatically adjusts times for your timezone or broker time. Shows
FREE
Fibomathe
Almaquio Ferreira De Souza Junior
Fibomathe Indicator: Support and Resistance Tool for MT5 The Fibomathe Indicator is a technical analysis tool designed for MetaTrader 5 (MT5) that assists traders in identifying support and resistance levels, take-profit zones, and additional price projection areas. It is suitable for traders who use structured approaches to analyze price action and manage trades. Key Features Support and Resistance Levels: Allows users to define and adjust support and resistance levels directly on the chart.
FREE
이 제품의 구매자들이 또한 구매함
SMART TREND TRADING SYSTEM — 특별 혜택 트레이딩 시스템, 자동매매 EA, 교육과 지원을 하나로. MT5용 Smart Trend Trading System을 99 USD에 구매하고, 시스템의 신호를 자동매매에 활용할 수 있는 Smart Universal Expert Advisor를 무료로 받으세요 . STTS는 추세 방향, 진입·청산 신호, 반전 구간, 주요 가격 수준을 차트에 모아 보여줍니다. 시스템을 참고해 수동으로 거래하거나, 포함된 EA를 연결하여 선택한 설정에 따라 자동으로 거래를 실행할 수 있습니다. 현재 가격인 99 USD는 앞으로 이루어지는 30건의 구매에 적용됩니다. 이후 가격은 149 USD로 인상됩니다. 전체 패키지 구성 구매 시 다음 항목이 포함됩니다. • MT5용 Smart Trend Trading System. • Smart Universal Expert Advisor — 무료. • 전체 STTS PDF 사용자 설명서. • STTS
Trend Sniper X
Sarvarbek Abduvoxobov
4.9 (39)
Trend Sniper X 는 트레이더가 추세 방향과 잠재적 반전 지점을 명확하고 정확하게 포착할 수 있도록 도와주는 MetaTrader 5용 멀티 타임프레임 추세 추종 지표입니다. MT4용: https://www.mql5.com/en/market/product/193245 가격 정보: 현재 가격은 프로모션 할인가이며, 향후 업데이트 및 새로운 기능이 출시됨에 따라 변동될 수 있습니다. 보너스 혜택: 본 지표 전용 무료 자동매매 Assistant EA를 받으시려면 구매 후 작성자에게 메시지를 보내주시기 바랍니다. Code2Profit 채널 멀티 타임프레임 분석으로 시장을 마스터하세요! Trend Sniper X로 승률을 극대화하는 방법: 핵심 규칙 및 세션 팁 기술 사양 플랫폼 MetaTrader 5 지표 유형 멀티 타임프레임 추세 지표 운용 타임프레임 모든 차트 타임프레임 지원, 독립적으로 선택 가능한 상위 타임프레임(M1–MN1) 주요 상품 외환, 금(XAUUSD) 및 기타 C
Neuro Poseidon MT5
Daria Rezueva
4.75 (53)
Neuro Poseidon is a new indicator by Daria Rezueva. It combines precise trading signals with adaptive TP/SL levels - creating best possible trades as a result! Message me and get  Neuro Poseidon Assistant  as a gift to automize your trading process! What makes it stand out? 1. Proven profitability on all assets and timeframes 2. Only confirmed BUY and SELL signals present on the chart 3. Adaptive TP & SL levels generated by the software for each trade 4. Easy to understand - suitable for al
Unix Scalper
Issam Kassas
5 (3)
UNIX SCALPER — 특별 혜택 매매 기회를 찾고, 거래 계획을 확인하고, 실행 방법을 선택하세요. MT5용 UNIX Scalper를 99 USD에 구매하면 신호 자동매매에 사용할 수 있는 Smart Universal Expert Advisor를 무료로 받으실 수 있습니다. UNIX Scalper는 시장 분석, BUY/SELL/WAIT 판단, Entry, Stop Loss, TP1 및 TP2 가격 수준을 하나의 정돈된 패널에 제공합니다. 거래 계획에 따라 수동으로 매매하거나, 포함된 EA를 연결하여 선택한 설정에 따라 자동으로 실행할 수 있습니다. 현재 가격인 99 USD는 앞으로 30건의 구매에 적용됩니다. 이후 가격은 149 USD로 인상됩니다. 전체 패키지 구성 구매 시 다음 항목이 포함됩니다. • MT5용 UNIX Scalper. • Smart Universal Expert Advisor — 무료. • UNIX Scalper 전체 PDF 사용자 매뉴얼. • UNIX
Zoryk Gold
Reda El Koutbane
5 (12)
ZORYK — MetaTrader 5용 XAUUSD 전문 신호 및 트레이드 플래닝 시스템 이런 경험이 있을 것입니다. 골드를 분석하고 진입을 기다린 뒤 마침내 포지션을 열었지만 가격이 곧바로 반대 방향으로 움직입니다. 너무 일찍 청산하거나 Stop Loss를 옮기거나 몇 초 동안 망설입니다. 그 후 시장은 내가 없이도 처음 예상했던 목표까지 정확히 움직입니다. 문제는 항상 방향이 아니었습니다. 진짜 문제는 불확실성이었습니다. 정확한 진입 위치를 몰랐습니다. 어느 지점에서 원래의 트레이드 아이디어가 무효가 되는지 몰랐습니다. 가까운 수익을 확보해야 할지 더 큰 움직임을 기다려야 할지 판단하기 어려웠습니다. 현재 setup이 정말 강한지 아니면 단지 새로운 거래를 억지로 찾고 있는지도 확신하기 어려웠습니다. 골드는 매우 빠르게 움직입니다. 명확한 계획이 없다면 좋은 분석도 몇 초 만에 나쁜 결정으로 바뀔 수 있습니다. ZORYK는 이 문제를 해결하기 위해 개발되었습니다.
SMC Intraday Formula
Kareem Abbas
5 (24)
먼저 솔직하게 말하겠습니다. 어떤 인디케이터도 단독으로 당신을 수익성 있게 만들어주지 않습니다. 누군가 그렇게 말한다면, 그는 당신에게 꿈을 파는 것입니다. 완벽한 매수/매도 화살표를 보여주는 모든 인디케이터는 완벽하게 보이도록 만들 수 있습니다 — 단지 올바른 과거 구간을 확대하고 승리한 거래만 캡처하면 됩니다. 우리는 그렇게 하지 않습니다.  SMC Intraday Formula는 도구입니다. 시장 구조를 읽고, 가장 높은 확률의 가격 구간을 표시하며, 현재 스마트 머니의 흐름이 어떻게 보이는지 아주 단순한 언어로 보여줍니다. 최종 결정은 여전히 당신이 합니다. 실행도 당신이 합니다. 하지만 이제는 희망이 아니라 정확성으로 거래하게 됩니다. 우리는 이 인디케이터를 지난 약 3년 동안 골드(XAUUSD) 및 주요 외환 통화쌍의 데이 트레이딩 스캘핑에 사용해 왔습니다. M1, M5, M15, M30에서 우리의 핵심 도구입니다. 이 도구는 미래를 예측하려 하지 않습니다 — 지금 형성
SuperScalp Pro
Van Minh Nguyen
4.65 (34)
SuperScalp Pro - Professional Multi-Layer Confluence Scalping System SuperScalp Pro는 클래식 Supertrend에 여러 지능형 확인 필터를 추가한 고급 스캘핑 지표입니다. 더 높은 확률의 Buy/Sell 거래 기회를 식별하는 데 도움을 주며, 잘못된 신호를 크게 줄이는 데 도움을 줍니다. 명확한 Buy 및 Sell 화살표가 차트에 직접 표시되며, ATR 기반 Stop Loss 및 Take Profit 수준이 실시간으로 자동 계산됩니다. 구매 후 설정 방법 및 권장 구성에 대한 안내가 필요하시면 저에게 문의해 주세요. SuperScalp Pro Auto Trader를 사용하여 신호를 쉽게 자동화할 수 있습니다: [Auto Trader] 권장 설정 파일 다운로드: [Set File] 전체 문서는 제품 블로그에서 확인할 수 있습니다: [User Guide] 업데이트를 확인하려면 공식 채널에 참여하세요: [Official C
M1 Sniper MT5
Oleg Rodin
5 (7)
M1 SNIPER 는 사용하기 쉬운 거래 지표 시스템입니다. M1 시간대에 맞춰 설계된 화살표 지표입니다. 이 지표는 M1 시간대 스캘핑을 위한 단독 시스템으로 사용할 수 있으며, 기존 거래 시스템의 일부로도 사용할 수 있습니다. 이 거래 시스템은 M1 시간대 거래용으로 특별히 설계되었지만, 다른 시간대에도 사용할 수 있습니다. 원래는 XAUUSD와 BTCUSD 거래를 위해 이 방법을 설계했지만, 다른 시장 거래에도 유용하다는 것을 알게 되었습니다. 이 지표의 신호는 추세 방향과 반대로 거래될 수 있습니다. 저는 지표의 신호를 활용하여 양방향으로 거래할 수 있도록 돕는 특별한 거래 기법을 알려드립니다. 이 방법은 특별한 동적 지지선과 저항선 가격 영역을 활용하는 것을 기반으로 합니다. 구매하시면 M1 SNIPER 화살표 지표를 바로 다운로드하실 수 있습니다. 또한, 아래 스크린샷에 표시된 Apollo Dynamic SR 지표는 M1 SNIPER 도구를 사용하는 모든 사용자에게 무료로
Reversion King Indicator
Eugen-alexandru Zibileanu
5 (9)
새로운 왕의 등장 - 인디케이터 + 주문 관리 표시(TP1 + TP2 + TP3) + 선택형 텔레그램 시그널 전송 기능 포함 (무료) (완전한 트레이딩 및 시그널 시스템) 골드를 위한 최고의 EA: Gold Slayer 이 인디케이터는 고급 전략, 사용자 지정 가능한 주문 관리 시스템, 그리고 엔벨로프 확장을 결합한 평균 회귀(mean reversion) 시스템을 포함하고 있습니다. 또한 RSI와 같은 여러 지능형 확인 필터를 통해 높은 확률의 반전 진입 구간을 포착하여 BUY 및 SELL 시그널을 제공합니다. 단순히 거래 방법만 배우는 것이 아니라, 여러 포지션을 효과적으로 관리하고 이전에 수익 중인 오픈 포지션으로 손실 거래를 커버하는 방법까지 익힐 수 있습니다. M5 전용으로 설계 및 최적화되었으며, 유동성이 풍부해 시그널이 더 깔끔하고 신뢰도 높은 BTCUSD와 XAUUSD에서 뛰어난 성능을 발휘합니다. 이 인디케이터는 ATR 기반으로 자동 계산된 진입가, 손절가, 익절가와
Gann Made Easy MT5
Oleg Rodin
5 (10)
Gann Made Easy 는 mr.의 이론을 사용하여 최고의 거래 원칙을 기반으로 하는 전문적이고 사용하기 쉬운 Forex 거래 시스템입니다. W.D. 간. 이 표시기는 Stop Loss 및 Take Profit Levels를 포함하여 정확한 BUY 및 SELL 신호를 제공합니다. PUSH 알림을 사용하여 이동 중에도 거래할 수 있습니다. 구매 후 거래 방법 안내 및 유용한 추가 지표를 무료로 받으시려면 저에게 연락주세요! 아마도 Gann 거래 방법에 대해 이미 여러 번 들었을 것입니다. 일반적으로 Gann의 이론은 초보자 거래자뿐만 아니라 이미 거래 경험이 있는 사람들에게도 매우 복잡한 것입니다. Gann의 거래 방식은 이론적으로 적용하기 쉽지 않기 때문입니다. 나는 그 지식을 연마하고 Forex 지표에 최고의 원칙을 적용하기 위해 몇 년을 보냈습니다. 표시기는 적용하기가 매우 쉽습니다. 차트에 첨부하고 간단한 거래 권장 사항을 따르기만 하면 됩니다. 지표는 지속적으로 시장 분석
GoldenX Entry MT5
Kareem Abbas
5 (16)
GoldenX Entry는 MT5용 인디케이터로, 적응형 Smart Entry Trend 알고리즘, 신호 스코어링 시스템, 시장 레짐 감지 기능, 그리고 변동성 필터를 포함합니다. 각 신호에는 계산된 진입 레벨, 3개의 익절(TP1, TP2, TP3) 레벨, 그리고 손절(Stop-Loss) 레벨이 포함됩니다. 이 인디케이터는 다양한 시장 환경에 적응하도록 설계된 다중 분석 레이어 구조 위에 구축되어 있으며, 내장 최적화기와 통계 추적 시스템을 결합합니다. 또한 Risk-to-Reward(RR) 지표와 과거 거래 행동 기반의 정량 분석을 제공합니다. 시작은 간단합니다 — 선택한 타임프레임에서 최적화기를 실행한 뒤 차트에서 바로 인디케이터를 사용하면 됩니다. 핵심 기능 GoldenX Entry는 하나의 차트에서 신호 엔진, 트레이드 관리 기능, 그리고 과거 통계 추적을 통합합니다: - 내장 최적화기: 최적화기는 차트에서 원클릭으로 실행됩니다. 200개의 파라미터 조합을 두 단계 탐색
Entry Points Pro for MT5
Yury Orlov
4.52 (151)
전설이 돌아왔습니다: Entry Points Pro 10. MQL5 마켓 Top-3 자리를 3년간 지켜온 전설적인 지표의 재출시입니다. 수백 개의 호평 리뷰(두 버전 합산 589개), 매일 이 지표로 거래하는 수천 명의 트레이더, 31,000회 이상의 데모 다운로드   MT4+MT5 . 지난 5년간 여러분이 남긴 리뷰를 하나도 빠짐없이 읽었고, 약속 대신 그 답을 버전 10에 담았습니다. 1999년부터 시장에서 활동하며 정직함과 자신의 평판, 그리고 고객을 소중히 여기는 개발자가 만들었습니다. Entry Points Pro의 진입 시그널은 절대 리페인팅되지 않습니다. 그리고 이번에는 개발자의 말뿐이 아니라 검증 가능한 사실입니다: 확정 시그널은 캔들 종가에서만 표시되며, 자동화 테스트에서 리페인팅 0건 이 확인되었습니다(EURUSD, XAUUSD, BTCUSD에서 2,486,568회의 불변조건 검사 — 위반 0건). 검증 방법은 공개되어 있으니 전략 테스터에서 직접 재현해 보실 수
Welcome to ENTRY IN THE ZONE AND SMC MULTI TIMEFRAME Entry In The Zone and SMC Multi Timeframe is a real-time market analysis tool based on Smart Money Concepts (SMC), designed to analyze market structure, price direction, and key trading zones. It supports both Single-Timeframe Analysis and Multi-Timeframe Analysis, providing a clearer view of the overall market structure across multiple timeframes, with real-time BUY / SELL signals that do not repaint. It is designed to help filter trading opp
Gold Entry Sniper
Tahir Mehmood
5 (20)
Gold Entry Sniper – 골드 스캘핑 & 스윙 트레이딩을 위한 전문 다중 시간 프레임 ATR 대시보드 Gold Entry Sniper 는 XAUUSD 및 기타 종목에 대해 정확한 매수/매도 신호 를 제공하는 고급 MetaTrader 5 지표입니다. ATR 트레일링 스톱 로직 과 다중 시간 프레임 분석 을 기반으로 설계되어 스캘핑과 스윙 트레이딩 모두에 적합합니다. 주요 기능 및 장점 다중 시간 프레임 분석 – M1, M5, M15 추세를 한눈에 확인. ATR 기반 트레일링 스톱 – 변동성에 따라 자동 조정. 전문 차트 대시보드 – 신호 상태, ATR 레벨, 회귀선, 매매 방향 표시. 명확한 매수/매도 마커 – 자동 화살표와 텍스트 라벨. 종료 알림 & 거래 관리 – 수익 보호를 위한 자동 종료 감지. 완전 사용자 설정 가능 – 대시보드 위치, 색상, ATR/회귀선 파라미터 조정. 골드(XAUUSD) 최적화 – M1~M15 스캘핑에 완벽, 외환/지수/암호화폐에도 적용 가능.
Tokyo mt5 Indicator
Vasiliy Strukov
5 (1)
Tokyo Indicator는 추세 방향, 잠재적 거래 신호 및 시장 상황을 명확하고 시각적으로 보여줍니다. 색상으로 구분된 계단식 추세선은 강세 구간(파란색)과 약세 구간(자홍색)을 명확히 구별해 줍니다. 추세가 전환될 때 나타나는 방향성 화살표는 잠재적인 매수 및 매도 기회를 강조하여 보여줍니다. 통합 대시보드는 현재 신호, 시장 성향(bias), 모멘텀, 변동성, 신호 품질 등의 정보를 한눈에 파악할 수 있도록 구성되어 있습니다. 이를 통해 트레이더는 별도의 패널을 오갈 필요 없이 가격 움직임(price action)과 지표의 데이터를 동시에 분석할 수 있습니다. 깔끔한 차트 화면과 간결한 시장 개요를 제공하는 Tokyo Indicator는 체계적인 추세 분석과 거래 결정을 지원합니다. 모든 시간대와 다양한 자산(특히 금)에서 활용할 수 있습니다. 추세 방향, 잠재적 거래 신호 및 시장 상황을 명확하고 시각적으로 보여줍니다. 색상으로 구분된 계단식 추세선은 강세 구간(파란색)
Market Structure Order Block Dashboard MT5는 시장 구조와 주요 가격 반응 구역을 차트에서 직접 읽고자 하는 트레이더를 위해 설계된 MT5 지표입니다. BOS, ChoCH, 오더 블록, Fair Value Gap (FVG), 유동성, Kill Zones, Volume Profile 그리고 빠른 분석을 위한 콤팩트한 대시보드를 결합합니다. 이 지표는 시장 구조, ICT 및 Smart Money 개념을 의사결정 프레임워크로 사용하는 트레이더를 대상으로 합니다. 추세 지속, 가능한 반전, 가격 불균형, 유동성 타겟 및 관심 구역을 보다 체계적으로 식별하는 데 도움을 줄 수 있습니다. 구매자를 위한 포함 리소스 구매 후 MQL5 개인 메시지로 요청하시면 완전한 PDF 사용 설명서와 파라미터 설정 팁을 제공해 드립니다. MQL5 개인 메시지를 통한 직접 기술 지원. 1.20 버전은 두 가지 주요 추가 기능을 제공합니다: Pending BOS / Pending
FiboSniper Pro
Van Minh Nguyen
5 (3)
FiboSniper Pro – Multi-Filter Fibonacci System with Auto SL/TP and Control Panel FiboSniper Pro는 동적 Fibonacci Envelopes와 여러 확인 필터를 결합하여 선별된 Buy 및 Sell 신호를 생성하는 기술적 지표입니다. Fibonacci 레벨은 Moving Average와 ATR을 기반으로 계산된 후 ADX, EMA, RSI, ATR, Volume, Time 및 Candle 구조를 통해 필터링됩니다. 이 지표는 ATR 기반의 자동 Stop Loss 및 Take Profit 레벨을 차트에 직접 표시하며, 빠른 설정 조정을 위한 인터랙티브 Control Panel을 제공합니다. 구매 후 권장 설정 파일과 자세한 사용 방법을 받으려면 저에게 문의해 주세요. Auto Trader X를 사용하여 FiboSniper Pro 신호를 자동화할 수 있습니다: [Auto Trader X] User Guide 및 Se
Adaptive Price Action Engine 지표를 구매하면 EA(자동매매 프로그램)가 무료 멀티 타임프레임 기반 자기 최적화 추세 & 캔들 패턴 분석 시스템 시장은 끊임없이 변화하며, 모든 Price Action 패턴이 모든 시장 환경에서 동일한 가치를 가지는 것은 아닙니다. Adaptive Price Action Engine 은 변화하는 시장 환경에 적응할 수 있도록 설계되었으며, 추세 구조, 멀티 타임프레임 분석, 캔들 패턴 및 통계적 최적화 를 하나의 분석 프레임워크로 결합합니다. 두 가지 적응형 모드 Dual Alpha Trend Mode 낮은 타임프레임과 높은 타임프레임에서 적합한 Alpha Trend 파라미터를 자동으로 탐색하여, 최근 시장 움직임에 맞춰 추세 분석을 조정합니다. Candlestick + Alpha Mode Alpha Trend를 통한 시장 국면 분석과 22개의 상승 및 하락 캔들 패턴 을 결합합니다. 모든 패턴을 동일하게 취급하는 대신, 다양
통화 강도 마법사는 성공적인 거래를 위한 올인원 솔루션을 제공하는 매우 강력한 지표입니다. 표시기는 여러 시간 프레임의 모든 통화 데이터를 사용하여 이 또는 해당 외환 쌍의 힘을 계산합니다. 이 데이터는 특정 통화의 힘을 확인하는 데 사용할 수 있는 사용하기 쉬운 통화 지수 및 통화 전력선의 형태로 표시됩니다. 필요한 것은 거래하려는 차트에 표시기를 부착하는 것뿐입니다. 표시기는 거래하는 통화의 실제 강세를 보여줍니다. 지표는 또한 추세와 거래할 때 유리하게 사용할 수 있는 구매 및 판매 거래량 압력의 극한값을 보여줍니다. 지표는 또한 피보나치에 기반한 가능한 대상을 보여줍니다. 표시기는 PUSH 알림을 포함한 모든 유형의 알림을 제공합니다. 구매 후 연락주세요. 나는 당신과 거래 팁을 공유하고 당신에게 무료로 훌륭한 보너스 지표를 줄 것입니다! 나는 당신에게 행복하고 유익한 거래를 기원합니다!
Divergence Bomber
Ihor Otkydach
4.89 (94)
이 지표를 구매하신 분께는 다음과 같은 혜택이 무료로 제공됩니다: 각 거래를 자동으로 관리하고, 손절/익절 수준을 설정하며, 전략 규칙에 따라 거래를 종료하는 전용 도우미 툴 "Bomber Utility" 다양한 자산에 맞게 지표를 설정할 수 있는 셋업 파일(Set Files) "최소 위험", "균형 잡힌 위험", "관망 전략" 모드로 설정 가능한 Bomber Utility의 셋업 파일 이 전략을 빠르게 설치, 설정, 시작할 수 있도록 돕는 단계별 영상 매뉴얼 주의: 위의 모든 보너스를 받기 위해서는 MQL5 개인 메시지 시스템을 통해 판매자에게 연락해 주세요. 독창적인 커스텀 지표인 “Divergence Bomber(다이버전스 봄버)”를 소개합니다. 이 지표는 MACD 다이버전스(괴리) 전략을 기반으로 한 올인원(All-in-One) 거래 시스템입니다. 이 기술 지표의 주요 목적은 가격과 MACD 지표 간의 다이버전스를 감지하고, **향후 가격이 어느 방향으로 움직일지를 알려주
Atomic Analyst MT5
Issam Kassas
4.45 (58)
ATOMIC ANALYST — 특별 혜택 시장 분석 도구, 자동매매 EA, 교육과 지원을 하나로. MT5용 Atomic Analyst를 99 USD에 구매하고, 지표의 신호를 자동매매에 활용할 수 있는 Smart Universal Expert Advisor를 무료로 받으세요 . Atomic Analyst는 가격 움직임 분석, 추세 방향, 진입·청산 신호, 손절 수준, 여러 익절 수준을 차트에 모아 보여줍니다. 분석을 참고해 수동으로 거래하거나, 포함된 EA를 연결하여 선택한 설정에 따라 자동으로 거래를 실행할 수 있습니다. 현재 가격인 99 USD는 앞으로 이루어지는 30건의 구매에 적용됩니다. 이후 가격은 149 USD로 인상됩니다. 전체 패키지 구성 구매 시 다음 항목이 포함됩니다. • MT5용 Atomic Analyst. • Smart Universal Expert Advisor — 무료. • 전체 Atomic Analyst PDF 사용자 설명서. • Atomic Ana
SMART PRICE ACTION CONCEPTS — 특별 혜택 구조를 확인하고, 구간을 파악하고, 거래 계획을 세우세요. MT5용 Smart Price Action Concepts를 49 USD에 구매하면 Smart Universal Expert Advisor를 무료로 받으실 수 있습니다. Smart Money Concepts(SMC), ICT 방식의 분석, 가격 행동 분석을 하나의 정돈된 차트에서 활용하세요. 시장 구조, 오더 블록, 유동성 참고 수준과 불균형을 파악하고, Smart Panel에서 표시할 요소를 선택할 수 있습니다. 현재 가격인 49 USD는 앞으로 30건의 구매에 적용됩니다. 이후 가격은 100 USD로 인상됩니다. 전체 패키지 구성 • MT5용 Smart Price Action Concepts. • Smart Universal Expert Advisor — 무료 보너스. • 전체 PDF 사용자 매뉴얼 및 공식 온라인 강좌. • 단계별 설치 및 설정 안내.
Axiom Matrix
Issam Kassas
5 (8)
Axiom Matrix — 특별 혜택 Axiom Matrix을 49 미국 달러에 구매하고 Smart Universal Expert Advisor를 무료로 받으세요. 시장을 탐색하세요. 기회를 비교하세요. 다음 차트를 선택하세요. Axiom Matrix는 여러 종목과 시간대의 분석을 하나의 대시보드에 모읍니다. 모든 차트를 따로 확인하지 않고 집중할 시장을 찾으세요. 종합시세 또는 선택한 종목을 여러 시간대에서 탐색. 추세, 모멘텀, 거래량, 변동성 및 시장 품질 정보 비교. Best Axiom Pick, 신호 상태 및 클릭 가능한 셀로 거래 조건 확인. Axiom Matrix는 분석 대시보드이며 거래를 실행하지 않습니다. 패키지 구성 Axiom Matrix Smart Universal Expert Advisor PDF 사용 설명서와 온라인 강좌. 설정 안내와 구매자 커뮤니티 이용 혜택. Smart Universal Expert Advisor는 별도의 보너스입니다. 이 제품의 직접적인
Superhero
Ihor Otkydach
5 (3)
SUPERHERO 지표는 “올인원” 방식으로 설계된 다중 통화 거래 시스템입니다. 이 지표는 시장을 독자적으로 분석하여 포지션을 개설하고 청산할 시점에 대한 신호를 제공합니다. 손절매(Stop Loss) 및 익절(Take Profit) 주문을 활용하며, 위험 대비 수익 비율(R:R)은 1:1입니다. 이 시스템은 스마트폰으로 푸시 알림을 전송할 수 있으므로, PC에 묶여 있을 필요 없이 “이동 중에도” 매매를 할 수 있습니다. 이는 자체 거래 전문 회사에 안성맞춤입니다. 모든 고객님께 드리는 특별 혜택: 이 지표를 구매하시는 모든 분께는 제가 특별히 준비한 유틸리티를 선물로 드릴 예정이며, 이 유틸리티는 다음과 같은 기능을 제공합니다: 손절매 및 익절 주문을 자동으로 설정합니다 가격이 목표 수준에 도달하면 자동으로 포지션을 청산합니다 미결제 주문 거래를 지원합니다 평균화 거래 모드를 지원합니다 이 훌륭하고 매우 편리한 유틸리티를 선물로 받고 싶으시다면, SUPERHERO 지표를 구매하
Volatility Master for MetaTrader is a real-time dashboard tool that scans up to  50 symbols  to identify high-volatility , trending markets instantly. With bullish/bearish signals, customizable alerts, and a user-friendly interface, it helps you avoid range-bound conditions and focus on high-probability trades. Clarity leads to confidence. Trade confidently and protect your capital effectively with this powerful dashboard. We don't offer free or bonus indicators in exchange of reviews from you.
CRT Candle Range Theory HTF MT5 - Ultimate CRT Indicator: 고급 ICT 개념 및 Malaysian SnR 트레이딩 시스템 가장 진보된 Candle Range Theory 지표로 마켓 메이커의 발자취를 마스터하십시오. Ultimate CRT Indicator를 사용하여 Smart Money Concepts(SMC)의 진정한 힘을 발휘하고 기관처럼 정확하게 거래하십시오. 진지한 트레이더를 위해 독점적으로 제작된 이 지표는 ICT Concepts(Inner Circle Trader)의 핵심 기둥인 매우 효과적인 Candle Range Theory(CRT)를 자동화하고 Malaysian Support and Resistance(SnR) 진입 방법과 FVG(Imbalance) 영역의 치명적인 정밀도로 이를 강화합니다. MT5에서 Forex, Crypto 또는 지수를 거래하든 이 알고리즘은 시장 소음을 제거하고 가짜 돌파(fakeout)를 필터링하며
Power Candles MT5
Daniel Stein
4.58 (12)
Power Candles V3 - 자체 최적화 강도 지표 파워 캔들 V3는 적용된 모든 차트에서 통화 및 상품의 강세를 실행 가능한 거래 계획으로 전환합니다. 단순히 캔들에 색상을 입히는 대신, 백그라운드에서 실시간 자동 최적화를 수행하여 현재 보고 있는 종목에 대한 최적의 손절매, 익절 및 신호 임계값을 제공합니다. 한 번의 클릭으로 실시간 거래에 적용할 수 있으며, 진입점, 손절매 및 익절 선이 정확한 가격에 맞춰 차트에 표시되고, 방향과 함께 알림이 발령됩니다. 이 도구는 Stein Investments 에코시스템의 일부입니다. 18개 이상의 도구와 함께 당신의 1대1 AI 트레이딩 멘토 Max.  항상 대기 중, 모든 인디케이터를 깊이 있게 이해, 무언가를 차근차근 생각해보고 싶은 순간에 도움을 줍니다.  https://stein.investments 에서 만나보세요 매 종가 바마다 3,000회 이상의 트레이딩 시뮬레이션. 9가지 강도 상태. 2가지 전략을 병렬로 테스트.
Trend Catcher ind mt5
Ramil Minniakhmetov
5 (18)
트렌드 캐처 인디케이터 트렌드 캐처 인디케이터는 개발자가 자체 개발한 맞춤형 적응형 트렌드 분석 지표들을 조합하여 시장 가격 움직임을 분석합니다. 단기적인 노이즈를 제거하고 근본적인 모멘텀 강도, 변동성 확대, 가격 구조 움직임에 집중하여 진정한 시장 방향을 파악합니다. 또한 이동 평균, RSI, 변동성 필터와 같은 맞춤형 지표들을 활용하여 가격을 평활화하고 트렌드를 필터링합니다. 실제 운영 모니터링 및 기타 제품은 다음 링크에서 확인하실 수 있습니다:   https://www.mql5.com/en/users/mechanic/seller 텔레그램에서는 EA나 설정 파일을 판매하지 않습니다. 사기이니 주의하세요. 모든 설정 파일은 블로그에서 무료로 제공됩니다. 중요! 구매 후 즉시 연락 주시면 사용 방법 및 보너스를 드립니다!
IQ FX Gann Levels a precision trading indicator based on W.D. Gann’s square root methods . It plots real-time, non-repainting support and resistance levels to help traders confidently spot intraday and scalping opportunities with high accuracy. William Delbert Gann (W.D. Gann) was an exceptional market analyst, whose trading technique was based on a complex blend of mathematics, geometry, astrology, and ancient mathematics which proved to be extremely accurate. We don't offer free or bonus indic
RelicusRoad Pro MT5
Relicus LLC
4.96 (24)
RelicusRoad Pro: 퀀트 시장 운영 체제 70% 할인 평생 이용권 (한정 시간) - 2,000명 이상의 트레이더와 함께하세요 왜 대부분의 트레이더는 "완벽한" 지표를 가지고도 실패할까요? 진공 상태에서 단일 개념 만으로 거래하기 때문입니다. 문맥 없는 신호는 도박입니다. 지속적인 승리를 위해서는 컨플루언스(중첩) 가 필요합니다. RelicusRoad Pro는 단순한 화살표 지표가 아닙니다. 완전한 퀀트 시장 생태계 입니다. 독점적인 변동성 모델링을 사용하여 가격이 이동하는 "공정 가치 로드"를 매핑하고, 단순 노이즈와 실제 구조적 돌파를 구분합니다. 추측은 그만두세요. 기관급 로드 로직으로 거래를 시작하세요. 핵심 엔진: "Road" 알고리즘 시스템의 중심에는 시장 상황에 실시간으로 적응하는 동적 변동성 채널인 Road Algo 가 있습니다. 세이프 라인(평형) 과 가격이 수학적으로 반전될 가능성이 높은 확장 레벨 을 투영합니다. Simple Road: 일반적인 시장을 위
제작자의 제품 더 보기
Swept Liquidity Pools
Vasilii Makarenko
5 (1)
A liquidity sweep is a bar that pushes past a prior swing high or swing low, where protective stop orders tend to rest, and then closes back on the inner side of that level. The same event is known under several names: a stop hunt, a stop run, a liquidity grab, a false breakout, a failed breakout, or a swing failure. Swept Liquidity Pools marks those levels and those bars on the chart. The indicator tracks liquidity pools - confirmed swing levels that have not yet been taken - and marks the exac
FREE
Auto Level Map
Vasilii Makarenko
What Gets Drawn Most level tools mark every swing they can find, and a chart with forty lines answers nothing. This one keeps a level only when price came back to it, and prints the evidence next to the line: the number of touches and the age in days. Lines above current price and lines below it are drawn in different colours, so the map reads at a glance without counting. What Puts A Level On The Chart A swing high is a bar whose high is not lower than its neighbours on both sides, within the n
FREE
Session Value Desk
Vasilii Makarenko
Three Anchors On One Chart Most volume weighted average lines restart once a day. This one draws three at the same time: one anchored to the current trading session, one to the day, one to the week. Their spread tells you something a single line cannot. When the session line sits far under the weekly one, the week has been trading higher than today is; when all three sit together, the market has spent the week in one place. Why The Session Anchor Is Not Midnight The session line starts where the
FREE
Hourly Spread Map
Vasilii Makarenko
Hourly Spread Map answers one question: at which hours does this symbol cost more to enter, and by how much. It reads the spread field that the terminal stores in every closed M1 bar of your own broker feed, sorts those measurements into 24 hours by 7 days of the week, and shows the result as a grid in the indicator sub-window. What It Measures Every closed M1 bar carries one spread measurement. The indicator collects them over the period you choose, groups them by the hour and weekday of the ba
FREE
Swap Cost Calendar
Vasilii Makarenko
Swap is the part of the cost that is easy to forget, because it arrives once a day, quietly, and never appears in the spread. Swap Cost Calendar puts it on the chart as a number you can act on. What It Shows The panel reads what the broker publishes for the current symbol and shows four things. The cost of one night for a long position and for a short one, in your account currency or in points. The weekday line, showing how many nightly charges a position carries on each day of the week. The tri
FREE
Trade Risk Desk answers one question at the moment you need it answered: what volume makes this stop cost exactly what you decided to risk. Drag the stop line to where it belongs on the chart and the panel prints the volume, the money behind it, and the margin the position will hold. What It Answers Set the risk as a percent of balance or as a fixed amount in account currency. Put the stop where your idea says it belongs. The panel reads the symbol settings your broker publishes and prints: the
FREE
유동성 풀은 아직 회수되지 않은 확정된 스윙 고점 또는 스윙 저점입니다. 유동성 스윕은 가격이 그 레벨을 넘어 거래된 후 다시 범위 안으로 종가를 형성하는 바로 그 봉입니다 - 트레이더들이 스톱 헌트, 스톱 런, 유동성 그랩 또는 거짓 돌파라고도 부르는 동일한 이벤트입니다. Liquidity Sweep Pools MTF는 현재 차트와 선택한 상위 타임프레임에서 풀과 그 풀에서 발생한 유동성 스윕을 모두 표시하며, 활성 풀의 실시간 패널, 풀 형성 시의 거래량 필터, 감지된 스윕의 CSV 내보내기를 추가합니다. 여기서 다중 타임프레임 확인이란 각 유동성 스윕을 눈앞의 차트를 떠나지 않고 상위 타임프레임의 풀과 대조하여 읽을 수 있다는 뜻이며, 두 레벨 세트가 각자의 색으로 나란히 그려집니다. 표시하는 것 한 가지, 정확히: 풀의 기하학입니다. 그리는 모든 풀은 가격 레벨, 방향, 거리, 나이를 가지며, 동일한 네 가지 값이 패널과 CSV 파일에 들어갑니다. 그것이 전체 어휘입니다. 그
Structure Desk
Vasilii Makarenko
MetaTrader 5용 XAUUSD 전문가 어드바이저입니다. 한 번에 하나의 바스켓으로 작동합니다: 고정된 서버 시간대에 진입하고, 가격이 불리하게 움직이는 동안 포지션에 추가하며, 바스켓 전체를 함께 청산합니다. 개별 포지션에는 손절매도 익절도 없습니다. 거래 방식 하나의 심볼, XAUUSD, 한 번에 하나의 바스켓, 같은 방향으로 최대 5개의 주문. 진입은 고정된 서버 시간대에만 허용되며, 가격이 4시간 범위의 가장자리에 있을 때만 가능합니다. 서버 시간 14:00에서 22:00 사이에는 진입이 차단됩니다. 가격이 바스켓에 불리하게 움직이는 동안, 전문가 어드바이저는 달러 단위의 고정된 거리에서 주문을 추가하며, 주문 사이에는 최소 60초의 일시 정지가 있습니다. 바스켓은 전체로 청산됩니다: 계좌 통화 기준 목표, 진입 시간에 따라 달라지는 가격 목표, 또는 목표가 설정된 후의 트레일링 반납에 의해 청산됩니다. 주문 볼륨은 계좌 잔고에 따라 조정됩니다. 추가된 주문은 동일한 볼
Sarveon
Vasilii Makarenko
Sarveon은 MetaTrader 5의 XAUUSD용 전문가 자문입니다. 하나의 차트에서 동시에 실행되는 아홉 개의 독립 전략이 있습니다. 각 전략은 고유한 매직 넘버, 고유한 진입 시간대 및 고유한 거리 집합을 가지고 있으며, 다른 전략이 연다 포지션에 절대 추가되지 않습니다. 거래 방식 각 전략은 자체 진입 시간대의 최근 바를 스캔하여 스윙 레벨을 찾습니다: 이후 바가 초과하지 않은 고점 또는 이후 바가 깨지 않은 저점. 이 레벨은 현재 가격으로부터 최소 거리 이상 떨어져 있어야 하며, 그렇지 않으면 무시됩니다. 진입은 해당 레벨에 고정된 달러 오프셋을 두고 대기 중인 스톱 주문으로 배치됩니다. 매수 스톱은 저항 레벨 위가 아니라 아래에 위치하므로, 가격이 레벨에 도달하고 있을 때 주문이 체결되고, 레벨을 돌파한 후가 아닙니다. 손절매와 이익실현은 주문이 배치될 때 첨부되며, 주문 가격을 기준으로 측정됩니다, 체결 가격이 아니라. 각 전략은 동시에 보유할 수 있는 대기 주문 수
Ridgeline
Vasilii Makarenko
Ridgeline은 금이 건드리지 않은 가격대에서 기다립니다. 일봉을 읽고, 이후 어떤 봉도 돌파하지 못한 고점과 저점을 표시하고, 그곳에 예약 스톱 주문을 둡니다. 일곱 개의 규칙 세트가 서로 다른 역사적 깊이에서 탐색하므로, 하나는 지난주에 형성된 레벨에서 기다리고 다른 하나는 석 달 전의 레벨을 지켜볼 수 있습니다. 손실을 본 세트는 이틀 동안 물러난 뒤에야 다시 주문을 넣습니다. 각 세트는 고유한 매직 넘버와 고유한 거리를 가지며, 어떤 세트도 다른 세트가 연 포지션에 추가하지 않습니다. 손실 거래는 스톱으로 청산되며, 절대 물타기하지 않고 절대 두 배로 늘리지 않습니다. 레벨을 찾는 방법 각 세트는 일봉을 읽고 한 가지를 찾습니다: 형성된 이후 시장이 돌파하지 않은 레벨입니다. 저항은 그 이후의 모든 봉보다 높고 바로 앞의 봉들보다도 높은 일봉 고점입니다. 지지는 그 거울상입니다. 가격이 이미 지나간 레벨은 더 이상 레벨이 아니며, 세트는 다음 레벨로 넘어갑니다. 레벨은 또
Sixfold Gold
Vasilii Makarenko
Sixfold Gold trades XAUUSD on the hourly chart. It looks for the points where the market turned and left an extreme behind, places a pending stop order a little inside that level, and attaches a stop loss and a take profit before the order is ever filled. Six zones do this independently, each with its own search depth, and between them they read three timeframes and four sessions, so the advisor is rarely committed to a single view of the market. A trade that goes wrong is closed by its stop. No
필터:
리뷰 없음
리뷰 답변