Candle Clock Desk

What It Shows

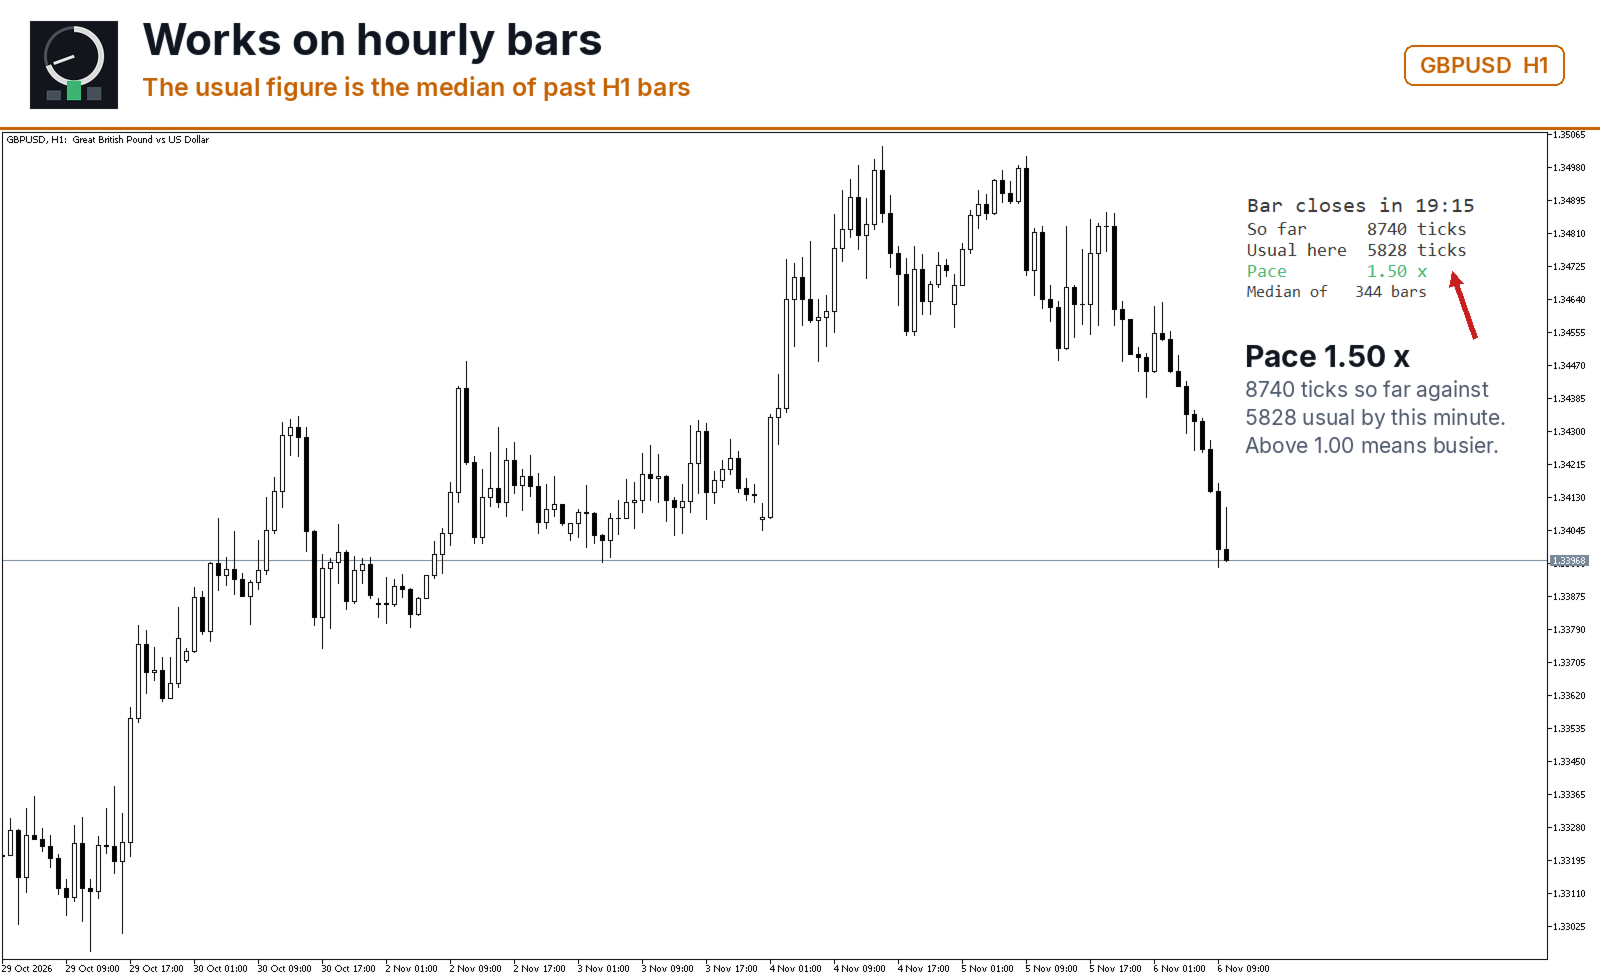
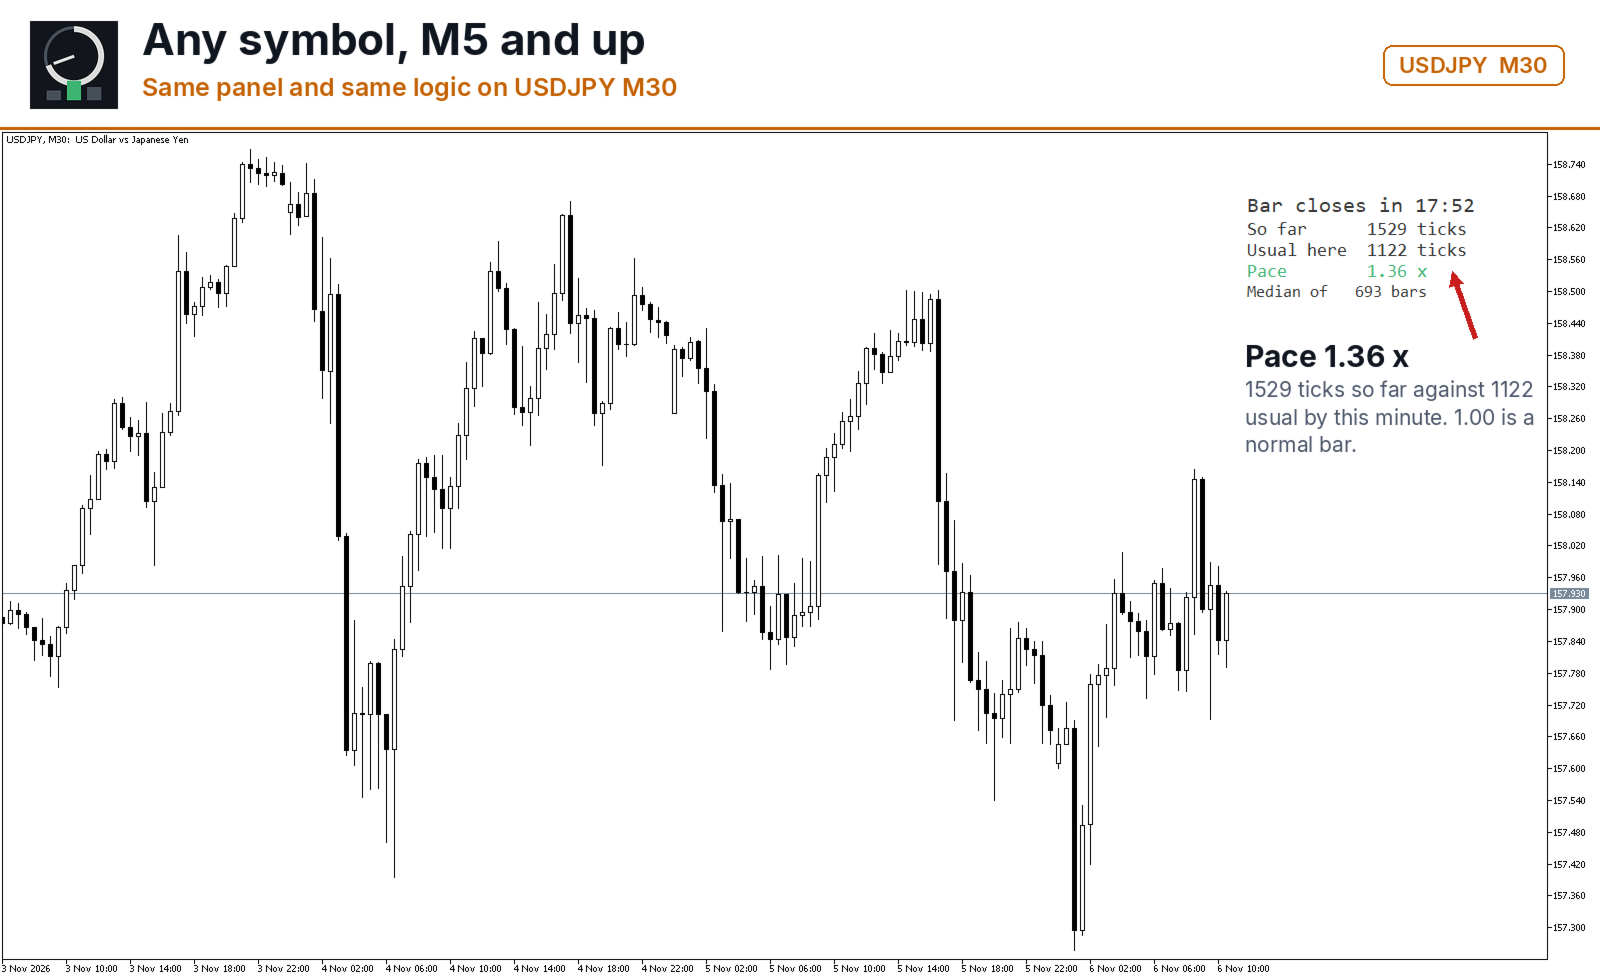
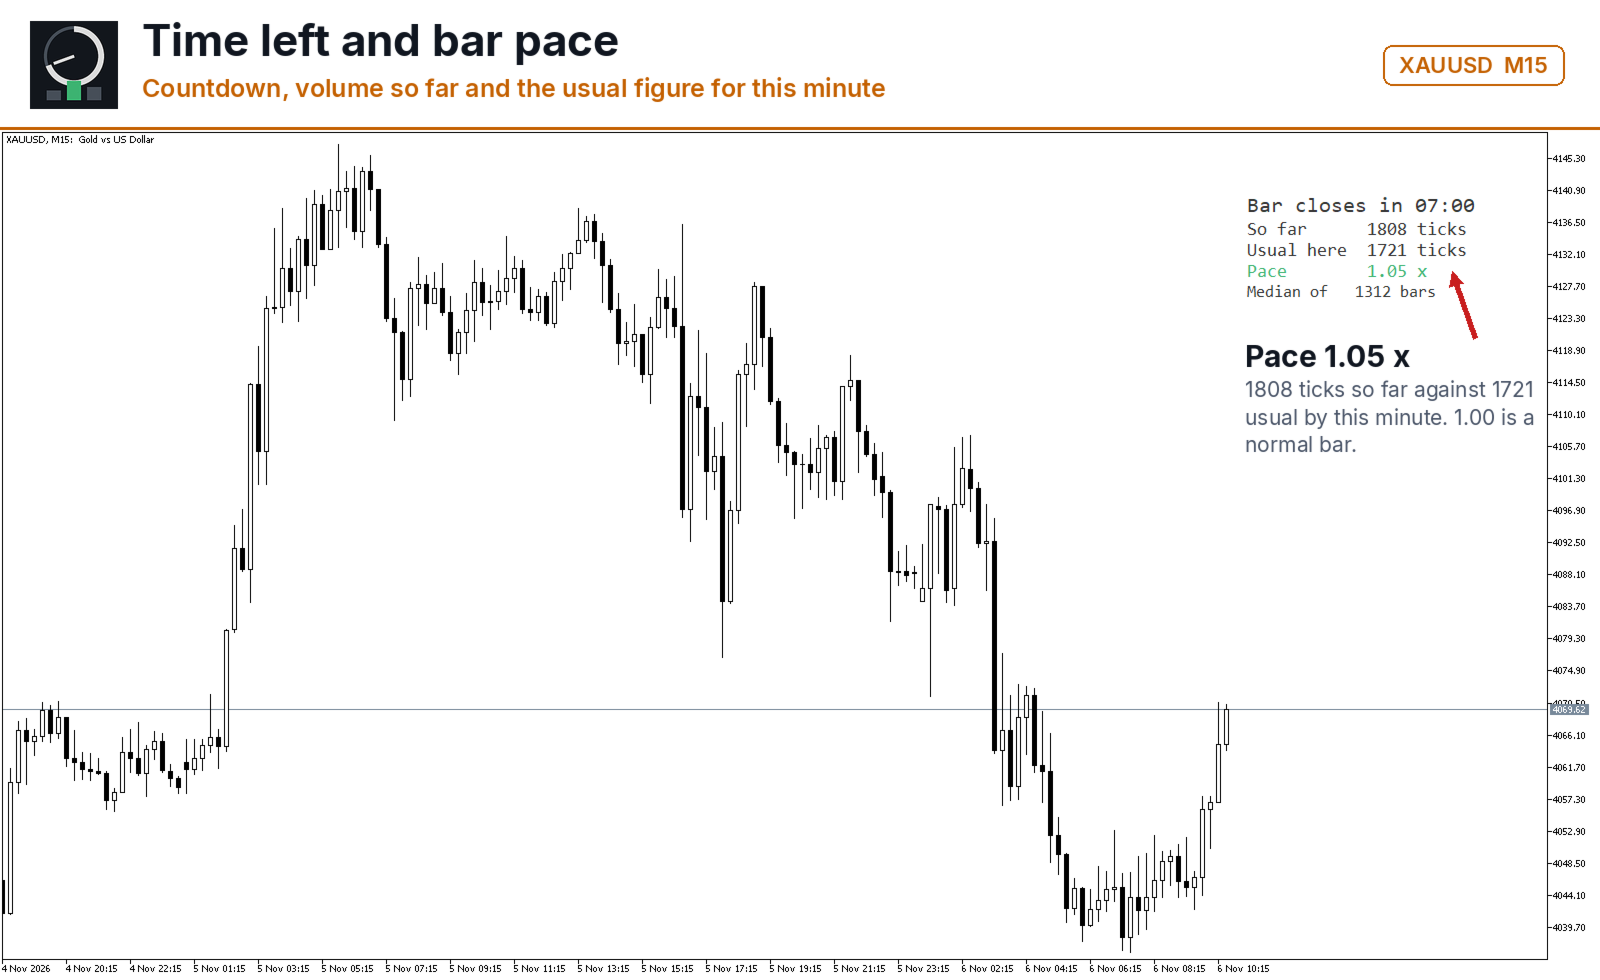
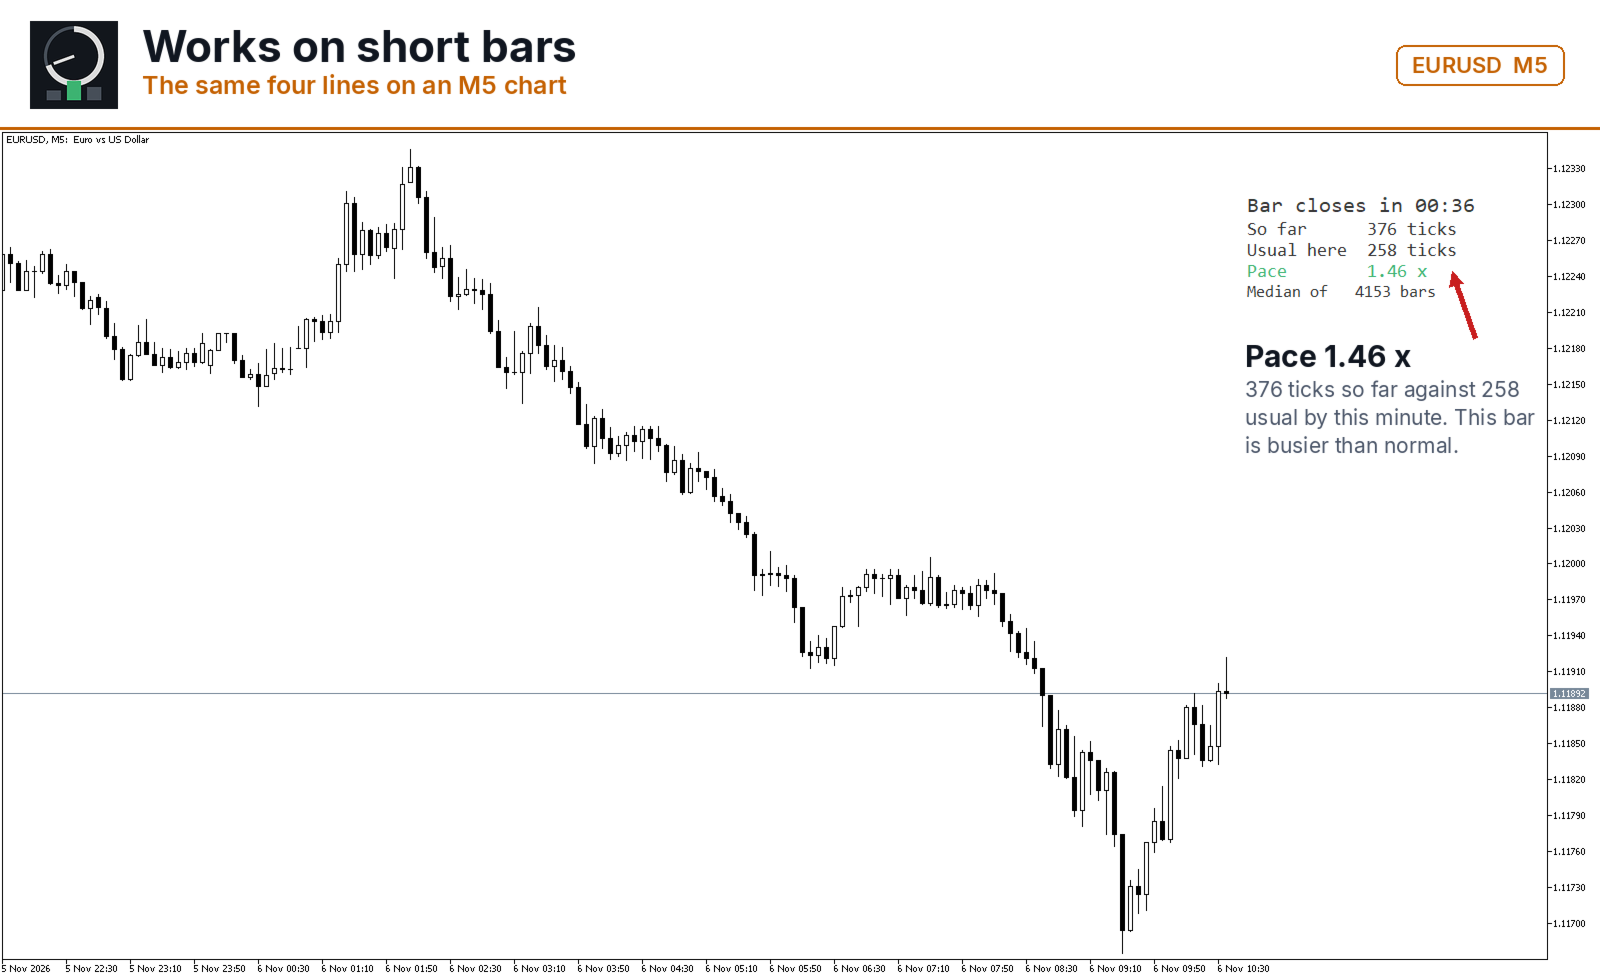
Candle Clock Desk puts four lines on the chart. The first is the time left until the current bar closes. The next three answer a question the clock alone cannot: is this bar unusually busy, or unusually quiet, right now.

  • Bar closes in - the countdown, in minutes and seconds
  • So far - volume this bar has accumulated since it opened
  • Usual here - what this symbol had accumulated by this same minute, in the past
  • Pace - the first divided by the second

The Pace Line

Pace of 1.00 means the bar is filling exactly as it normally does at this point. 2.00 means twice the usual volume has already arrived. 0.40 means the bar is running dry. The figure is not a signal and is not tied to direction: it says how much trading is happening, not where price is going.

Where The Usual Figure Comes From

The comparison is built from M1 bars your terminal already holds. Every M1 bar belongs to exactly one bar of the chart timeframe, and its position inside that bar is known from the timestamps. For each minute of the bar the panel takes the volume accumulated by that minute in every finished bar of the history window, and keeps the median.

A simpler method would be to take the volume of the whole bar and multiply it by the share of time elapsed. That method is wrong on every instrument with a session: volume does not arrive evenly. The open, the London and New York overlap and the minutes around a release carry far more of it than the middle of the bar. The median profile keeps that shape instead of flattening it.

The median, not the average, is used on purpose. One release day with ten times the normal volume moves an average for weeks; the median stays where the ordinary bars are.

Reading It During A Session

Open the chart, let the terminal pull its M1 history, and watch the Pace line through one session. It sits near 1.00 for long stretches and climbs when something arrives. Compare a reading above 2.00 with the Market Watch and with the news calendar for that minute: the panel and the tape describe the same event from two sides.

When the history window holds fewer finished bars than MinBarsForMedian for a given minute, the panel prints that the median is not available rather than showing a figure built on two samples.

Input Parameters

  • HistoryDays - days of M1 history the median is built from
  • VolumeSource - tick volume, or real volume where the broker supplies it
  • MinBarsForMedian - how many finished bars a minute needs before its median is shown
  • MaxM1BarsToScan - hard cap on how many M1 bars are read
  • ShowPanel - draw the panel or keep only the buffers
  • PanelCorner - corner of the chart, offsets, font size
  • ColorFast - colour used when the pace is at or above 1.00
  • ColorSlow - colour used when it is below
  • ObjectPrefix - prefix for every chart object created

Reading The Figures From An Expert Advisor

Four buffers are published and available through iCustom: buffer 0 is the seconds left in the current bar, buffer 1 is the volume accumulated so far, buffer 2 is the median for this minute, buffer 3 is the pace. Buffer 2 and buffer 3 return an empty value while the median is not available, so an expert advisor can tell "quiet" from "not measured yet".

Requirements

Any symbol and any timeframe from M5 upward; the profile is built from M1 history, so an M1 chart has nothing to compare against and the panel then shows the clock and the volume only. The indicator places no orders, writes nothing to disk and works the same on a demo and a live account of the same broker.

Support

Questions about a parameter, or a case where the panel and your terminal disagree: reply in the comments of this page with the symbol, the timeframe and the broker, and I will look into it. Ratings help other traders decide whether a free tool is worth their time, whichever way they go.
Önerilen ürünler
Basic Theme Builder MT5
Mehran Sepah Mansoor
5 (2)
Basic Theme Builder: Grafik Özelleştirmeyi Kolaylaştırın Ticaret deneyiminizi Basic Theme Builder göstergesi ile dönüştürün; MetaTrader 5'te grafik görünümünüzü basit bir panel aracılığıyla kişiselleştirmenizi sağlayan çok yönlü bir araçtır. Bu sezgisel gösterge, çeşitli temalar ve renk şemaları arasında zahmetsizce geçiş yapmanıza olanak tanır ve ticaret ortamınızın görsel çekiciliğini ve işlevselliğini artırır.  Free MT4 version Basic Theme Builder göstergesi, MetaTrader 5 grafiklerinizi zahm
FREE
THE TRADER SESSION LEVELS THE TRADER Session Levels is a free MetaTrader 5 indicator designed to visualize trading sessions, analyze intraday price ranges, and identify important session levels. The indicator helps traders monitor different periods of the trading day and use the Asian range high and low in their market analysis. Key Features Four Trading Sessions — Pacific, Asia, Europe, and New York. Color-Coded Session Areas displayed directly on the chart. ASIA HIGH / LOW — automatic calculat
FREE
Support And Resistance indicator that can display round levels and zones . It shows them directly on the chart, providing an easy help when you want to set stop-loss or take-profit level, or when you want to see the next market target.   If an asset price is moving down and bounces back up, the level is called support (think: price floor). If an asset price is moving upward and hits a level where it reverses downward, this is called resistance (think: price ceiling).
FREE
KF Market Structure — Smart Money Concepts Trend & Breakout Analyzer KF Market Structure is a clean, rule-based Smart Money Concepts (SMC) indicator for MetaTrader 5 that automatically detects and visualizes market structure: Swing Highs, Swing Lows, Break of Structure (BOS), and Change of Character (CHoCH). Built strictly for closed bar evaluation, it provides an objective structural baseline for Price Action traders and automated trading strategies without erratic signals. Whether you trade
FREE
Fabii Memory Support Resistance
Fabien Georges Andre Guillemaud
Hangi destek ve direnç bölgelerinin önemli olduğunu tahmin etmeyi bırakın: her bölge fiyatın onu kaç kez test ettiğini gösterir. No repaint. Her parite, her timeframe. 2 dakikada grafiğinizde. Strategy Tester'da ücretsiz test edilebilir. Get more indicators here Baselines, volatility filters and oscillators. No repaint. Neden ihtiyacınız var Destek ve direnci elle çizersiniz ve iki trader aynı grafikte asla aynı seviyeleri çizmez. Hangi seviyelerin dikkatinizi hak ettiğini bilmezsiniz. Fiyatı
FREE
IQuantum
Evgeniy Scherbina
The indicator IQuantum shows trading signals for 10 symbols in the daily chart: AUDCAD, AUDUSD, EURUSD, GBPCAD, GBPCHF, GBPUSD, NZDUSD, USDCAD, USDCHF, and USDJPY. Signals of the indicator are produced by 2 neural models which were trained independently from one another. The inputs for the neural models are normalised prices of the symbols, as well as prices of Gold, Silver and markers of the current day. Each neural model was trained in 2 ways. The Ultimate mode is an overfitted neural model
FREE
=== Drawdown Peak Panel (free indicator) === Short description: Shows your account drawdown from its equity peak right on the chart. Display only. Description: Drawdown Peak Panel keeps track of your account equity peak and shows how far you are below it, in percent and in account currency. What you see on the chart - Current drawdown from the recorded equity peak (green below 10%, orange below 25%, red above) - Maximum drawdown recorded so far - Equity, balance and peak value - Optional ale
FREE
Apex Point
Marco Engstermann
Apex Point is a trend-following indicator for MetaTrader 5, transforming complex market data into signals for traders. It displays blue dots for uptrends, red dots for downtrends, and yellow crosses at potential reversals, helping users identify momentum shifts quickly. Key features include a confirmation system requiring multiple bars (default: 3) to validate changes, reducing false signals; dynamic ATR-based offsets for adaptive trailing, with instant ratcheting in the trend direction and smo
FREE
Advanced Market Sessions göstergesi ile piyasa ritminde ustalaşın. Ticarette zamanlama her şeydir. Başlıca finans merkezlerinin tam olarak ne zaman açılıp kapandığını bilmek; piyasa oynaklığını (volatilitesini), likiditeyi ve yönsel eğilimi (directional bias) anlamanın anahtarıdır. Bu gösterge size üç ana işlem seansı olan Asya, Londra ve New York hakkında net bir görünürlük sağlar. Her seansın en yüksek ve en düşük seviyelerini gerçek zamanlı olarak otomatik bir şekilde haritalandıran bu araç,
FREE
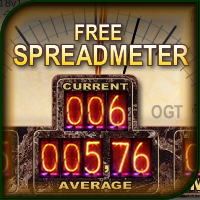
SpreadMeter OGT Free
Dmitriy Gurenko
5 (1)
The indicator shows the current spread of the symbol, the minimum, average and maximum values for the current bar in the form of digital, analog and graphic indicators. Has two modes of operation: fixing the system spread, or calculating the spread as the difference between the "Bid" and "Ask" prices on each incoming tick. Parameters  The indicator has a single input parameter: Type of calculation  - type of spread calculation. It can take the following values:  System spread  - the spread value
FREE
VFI Quantum
Nikita Berdnikov
5 (1)
Introducing VFI (Volume Flow Indicator) – a trading indicator that analyzes the relationship between volume and price movement to identify key trading opportunities. The indicator displays the strength and direction of volume flow, providing clear signals about potential entry and exit points. Signals are formed based on zero line crossovers, crossovers between the VFI line and its exponential moving average (EMA), and when the indicator exits overbought and oversold zones. Attention! This stra
FREE
Aurum Flow Matrix
Hicham Mahmoud Almoustafa
Aurum Flow Matrix is an advanced XAUUSD volume intelligence indicator that detects buying, selling, and absorption zones. It displays zone strength, estimated flow, confidence, retest status, market bias, and the nearest active zone through a clean professional dashboard.                                                                                                                                        post Aurum Flow Matrix is a professional volume intelligence indicator developed for XAUUS
FREE
Most killzone indicators draw boxes. This one checks whether the boxes work. Asia, London open, New York open and London close drawn automatically A table on your chart measures how often the day's high or low really formed inside each killzone, next to what pure chance would give Free. Check the numbers before you trust any killzone strategy MT4 version (free) | ICT FVG Honest Stats (free) | ICT Liquidity Levels Honest Stats (free) | ICT SMT Divergence Honest Stats (free) | TrueRisk Trade Panel
FREE
Fractals MT5 FX
Diego Alejandro Guzman
Fractals MT5 FX   Fractales personalizables con período ajustable Descripción breve Indicador avanzado de fractales para MetaTrader 5 que permite definir el número de velas a ambos lados del pico o valle, y personalizar el símbolo de las flechas. Ideal para identificar niveles de soporte y resistencia dinámicos, así como puntos de inflexión en la tendencia. Características principales Período ajustable:   El parámetro "Número de velas" ( Fr_Period ) permite elegir cuántas velas a la izquierda y
FREE
Moving Spread
Jose Maria Molina Sanchez
Moving Spread – Gerçek Zamanlı Piyasa Maliyeti İzleyicisi Ortalama spread’i gerçek zamanlı olarak izleyin ve yüksek maliyetli dönemlerde işlem yapmaktan kaçının. Bu göstergenin işlevi nedir? Moving Spread , piyasanın ortalama spread'ini (nokta cinsinden) gerçek zamanlı olarak ölçer ve bunun zaman içinde nasıl değiştiğini gösterir. Bir işlemin başlamasından önce bile kârlılığınızı azaltabilecek giriş maliyetinin ne zaman çok yüksek olduğunu anlamak isteyen trader'lar için vazgeçilmez bir araçt
FREE
Strifor Lot Calculator — MetaTrader 5 için bir gösterge olup, trader’ların belirlenen risk ve stop-loss’a göre optimal lot büyüklüğünü hesaplamasına yardımcı olur. Daha bilinçli işlem yapmayı, risk yönetimini sağlar ve manuel hesaplama süresini kısaltır. Avantajları Hassas risk kontrolü — seçilen risk yüzdesine göre otomatik lot hesaplama İki mod — manuel parametre girişi veya grafikteki çizgilere göre hesaplama Popüler enstrümanları destekler — döviz çiftleri, altın (XAUUSD), petrol (USOIL/WTI)
FREE
The "Support Resistance Dynamic" indicator is a powerful technical analysis tool for the MetaTrader 5 platform, designed to automatically identify and plot dynamic Support and Resistance zones on price charts. This indicator helps traders easily recognize important price levels, potential reversal points, or breakout areas, thereby enabling more informed trading decisions. 2. Key Features Dynamic S/R Identification : Automatically identifies support and resistance zones based on an advanced Pivo
FREE
Spread Monitor MT5
Fabio Cavalloni
3.5 (2)
This is a usefull utility for monitoring spread and also for recording informations to a file. (Files will be placed into "Common\Files\Spread Monitor"). There is the possibility to let the indicator calculate high/low into the past thanks to downloading ticks. (It's a slow and approsimate thing! The best way to use it is to attach to a chart and let it recording spread in real time). There is also a buffer with the average of spread in latest X periods. Easy and effective.
FREE
FVG Metrics
Kim Raphael Reitz
5 (1)
FVG Indicator (Current Timeframe Zones and Multi-Timeframe Count Panel) This indicator detects and draws Fair Value Gap zones on the current chart timeframe only. It also includes a multi-timeframe panel that shows how many active (unmitigated)  zones exist on selected timeframes. This indicator detects and draws Fair Value Gap zones on the current chart timeframe . It can also display a panel with the number of active zones on selected timeframes. The indicator shows bullish and bearish zone
FREE
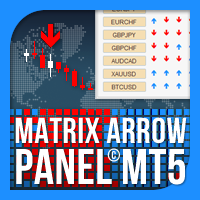
Matrix Arrow Indicator Çoklu Zaman Çerçevesi Paneli MT5 , Matrix Arrow Indicator MT5 için ücretsiz bir eklenti ve harika bir varlıktır. 5 kullanıcı tarafından özelleştirilmiş zaman çerçevesi ve toplamda 16 değiştirilebilir sembol/araç için mevcut Matrix Arrow Indicator MT5 sinyalini gösterir. Kullanıcı, Matrix Arrow Indicator MT5 'ün içerdiği 10 standart göstergeden herhangi birini etkinleştirme/devre dışı bırakma seçeneğine sahiptir. 10 standart gösterge özelliğinin tümü, Matrix Arrow Indicato
FREE
### RECOMMENDED SETTINGS & PAIR - **Primary Instrument:** XAUUSD (Gold) - **Timeframe:** M1 (1-Minute Scalping) - **Trading Style:** Smart Money Concepts (SMC) & Order Block Scalping - **Account Type:** ECN / Raw Spread / Low Spread Broker (Recommended for M1 execution) - **Recommended Sessions:** London & New York Sessions (Peak Liquidity & High Volatility) # XAUUSD M1 Precision Order Block Scalper Dashboard Unlock high-probability scalping entries on Gold (XAUUSD) with this advanced real-t
FREE
Algorion Bias Master Professional Multi-Timeframe Market Bias Indicator for MetaTrader 5 Algorion Bias Master is a professional multi-timeframe market bias indicator for MetaTrader 5 that helps traders identify the dominant market direction before entering a trade. Instead of generating simple Buy or Sell signals, the indicator evaluates market structure using multiple technical factors, including trend direction, trend strength, volatility, momentum, and breakout conditions, to produce a struc
FREE
True Risk
Oleksii Lishchenko
Lotunuz belirlediğiniz yüzdeden daha fazla risk taşıyor olabilir. True Risk, bir sonraki işleminizin gerçek riskini siz açmadan önce gösterir. Sorun Aracı kurumlar her lotu bir adıma aşağı yuvarlar ve asla minimum lotun altına inmez. Küçük bir hesapta yalnızca minimum lot bile planınızın kat kat üstünde olabilir. 300 dolarlık bir hesapta altın için stop 25 dolar uzaktaysa, 0.01 lot zaten 25 dolar, yani belirlediğiniz yüzde 1 değil yüzde 8.3 risk taşır. Spread ve komisyon da kaybın bir parçasıdır
FREE
Show Pips for MT5
Roman Podpora
4.5 (32)
Bu bilgi göstergesi her zaman hesaptaki güncel durumdan haberdar olmak isteyenler için faydalı olacaktır. VERSION MT 4 -   More useful indicators Gösterge, puan cinsinden kâr, yüzde ve para birimi gibi verilerin yanı sıra mevcut çiftin spreadini ve mevcut zaman diliminde çubuğun kapanmasına kadar geçen süreyi görüntüler. Bilgi satırını grafiğe yerleştirmek için birkaç seçenek vardır: Fiyatın sağında (fiyatın arkasında); Yorum olarak (grafiğin sol üst köşesinde); Ekranın seçilen köşesinde. Bilgi
FREE
Bir hareketli ortalamanın biçimini değil, bir piyasanın gerçek dönüşünü ölçen iki çizgi. Vortex Indicator MTF yukarı ve aşağı yönlü girdap hareketini bir pencere üzerinde toplar, her birini gerçek aralığa böler ve sinyalini ortaya çıkan çiftin kesişiminden alır, yani mumların kendisinden ölçülen bir yön değişiminden. İçinde hiç özyineleme yoktur, bu yüzden herhangi bir mumdan devam yapı gereği tamdır. Ücretsizdir: deneme süresi yok, kilitli işlev yok, yükseltme sayfası yok. Bir pencere üzerinde
FREE
True MACD Divergence — Yüksek Kaliteli MACD Uyumsuzluk Göstergesi Çoğu uyumsuzluk göstergesi, neredeyse her yerel tepe ve dip noktada sinyal üretir. Bu da grafiğin kısa sürede çok sayıda yanlış veya önemsiz uyumsuzluk sinyaliyle dolmasına neden olur. True MACD Divergence , fiyat yapısını analiz eden özel bir filtreleme algoritması kullanarak yalnızca en kaliteli sinyalleri gösterir. Göstergenin temel amacı mümkün olduğunca fazla uyumsuzluk bulmak değil, yatırımcının gerçekten önemli piyasa durum
FREE
The CV MACD Indicator is a modern and professional momentum indicator designed to analyze trend strength, market direction and potential reversals. By combining the MACD line, signal line and histogram, the indicator helps traders identify market momentum and high-quality trading opportunities with clarity and precision. Features: Precise MACD momentum analysis Early trend reversal detection Clear histogram for market strength visualization Adjustable Fast, Slow and Signal periods Visual Buy & S
FREE
Force Candle Pro
Samuel Henrique Almeida Ferreira
5 (2)
Force Candle Pro is an advanced indicator designed to identify strong momentum candles in the market, helping traders detect high-probability movements and institutional activity. This tool analyzes candle strength based on body size, volatility, and directional consistency, filtering out weak and indecisive movements. Unlike common indicators, Force Candle Pro focuses on market impulse, allowing traders to identify when the market is truly moving with strength. MAIN FEATURES: - Detection o
FREE
HCS SessionPulse
HADDEN CAPITAL SOLUTIONS LLC
HCS SessionPulse is a free, read-only global trading session monitor for MetaTrader 5. A compact on-chart panel shows the current status of the Sydney, Tokyo, London, and New York trading sessions and continuously counts down to upcoming session transitions. SessionPulse displays: • Sydney session OPEN/CLOSED status • Tokyo session OPEN/CLOSED status • London session OPEN/CLOSED status • New York session OPEN/CLOSED status • Time remaining until each session's next open or close • Currently
FREE
Sessions Indicateur
Marc Guy Verzotti
4 (2)
Sessions are very important in trading and often good area where to look for setup. In SMC, ICT we will look for Asian session to serve as liquidity This indicator displays: High & Low of the Asia session Midnight New York time opening line Congifuration Line Style, color Label position, size, color Start of the level (Start of the day, Start of the session, Highest or Lowest point in the session) Any questions or comments, send me a direct message here  https://www.mql5.com/en/users/mvonline
FREE
Bu ürünün alıcıları ayrıca şunları da satın alıyor
Trend Sniper X
Sarvarbek Abduvoxobov
4.86 (44)
Trend Sniper X , tüccarların trend yönünü ve olası dönüş noktalarını netlik ve hassasiyetle belirlemelerine yardımcı olan MetaTrader 5 için çoklu zaman dilimli bir trend takip göstergesidir. MT4 için: https://www.mql5.com/en/market/product/193245 Fiyat Bilgisi: Mevcut fiyat tanıtım amaçlıdır ve gelecek güncellemeler ile yeni özellikler yayınlandıkça değişebilir. Bonus Fırsatı: Bu indikatör için ÜCRETSİZ Oto-Trade Assistant EA'yı almak için lütfen satın aldıktan sonra yazara mesaj gönderin. Code
Şehre yeni bir Kral geldi - Gösterge + Emir Yönetimi göstergeleri (TP1 + TP2 + TP3) + Opsiyonel Telegram Sinyal Gönderici DAHİL (ÜCRETSİZ) (TAM TRADING ve SİNYAL SİSTEMİ) Altın için en iyi EA’mız: Gold Slayer Bu gösterge; gelişmiş bir strateji, özelleştirilebilir emir yönetimine sahip bir trading sistemi ve envelope uzantılarını birleştiren bir mean reversion sistemi içerir. Ayrıca RSI gibi birçok akıllı onay filtresiyle desteklenerek yüksek olasılıklı dönüş girişlerini AL ve SAT sinyalleriyle y
Smart Trend Trading System — MetaTrader 5 Satın aldıktan sonra Smart Universal Expert Advisor'ı ÜCRETSİZ edinmek ve beraberinde çevrimiçi kurs, PDF kılavuzu ve özel gruba erişim almak için MQL5 üzerinden bana mesaj gönderin. STTS; trend yönünü, giriş ve çıkış sinyallerini, dönüş bölgelerini ve önemli fiyat seviyelerini doğrudan grafiğinizde bir araya getirir. Sistemi manuel işlemler için kullanabilir veya ayrı bir uyumlu EA’yı bağlayarak seçtiğiniz ayarlarla otomatik işlem gerçekleştirebilirsini
Zoryk Gold
Reda El Koutbane
4.78 (18)
ZORYK — MetaTrader 5 İçin Gelişmiş XAUUSD Sinyal Sistemi Bu hissi biliyorsunuz. Altını analiz etmek için uzun zaman harcarsınız. Doğru giriş noktasını beklersiniz. Sonunda işlemi açarsınız ve fiyat hemen aleyhinize hareket etmeye başlar. İşlemi çok erken kapatırsınız, Stop Loss seviyesini değiştirirsiniz veya birkaç saniye tereddüt edersiniz. Daha sonra piyasa, başlangıçta beklediğiniz hedefe tam olarak ulaşır; ancak siz artık işlemin içinde değilsinizdir. Sorun her zaman yön değildi. Asıl sorun
Entry Points Pro, emri vermeden önce nereden gireceğinizi, stopu nereye koyacağınızı ve hangi lotla işlem yapacağınızı gösterir. FİYAT Şu anda 149 USD ve bu fiyattan satılan son kopya. Sonrasında fiyat 199 USD'ye çıkacak, nihai fiyat ise 349 USD. Paramı piyasalarda işlem yaparak kazanıyorum ve bunu gösteriyorum, bu yüzden bu indikatörü herkese satmak zorunda değilim. Bu, kendi kafasıyla düşünen traderlar için bir araç, sihirli bir düğme değil. Ok mum kapanışında belirir ve repaint olmaz. İki ay
İşlem avantajınızı görüş alanınıza alın! M5 Sniper , MeanFX tarafından geliştirilen yeni bir indikatördür. Hassas işlem sinyallerini adaptif TP/SL seviyeleriyle birleştirir — bunun sonucunda mümkün olan en iyi istatistiksel işlemleri oluşturur! Fiyat her 5 satın alımda bir artar, bir sonraki fiyat 69$ olacaktır. Satın aldıktan sonra ipuçları/rehber ve bonus EA almak için bana mesaj gönderin. Onu öne çıkaran nedir? Kanıtlanmış istatistiksel performans Gold XAUUSD üzerinde ( neredeyse her varlıkta
SuperScalp Pro
Van Minh Nguyen
4.54 (37)
SuperScalp Pro - Professional Multi-Layer Confluence Scalping System SuperScalp Pro, klasik Supertrend sistemini birden fazla akıllı doğrulama filtresiyle geliştiren ileri düzey bir scalping göstergesidir. Yanlış sinyalleri önemli ölçüde azaltırken başarı olasılığı daha yüksek Buy/Sell işlem fırsatlarını belirlemenize yardımcı olur. Buy ve Sell okları doğrudan grafik üzerinde net bir şekilde görüntülenir. ATR tabanlı Stop Loss ve Take Profit seviyeleri de gerçek zamanlı olarak otomatik hesaplanı
Gold Trend Coach MT5
Cristhian Alexander Gaibor Cuasquer
4.2 (10)
Gold Trend Coach, MetaTrader 5 için altın (XAUUSD) trend göstergesidir: mum kapanışında onaylanan (repaint yok) alış ve satış sinyalleri, stop loss ve üç take profit, sizi girişten TP3'e kadar yönlendiren bir koç, çoklu zaman dilimi paneli ve telefonunuza ve Telegram'a uyarılar. Londra ve New York seanslarında M1 ve M5 scalping ve M15 gün içi işlem için yapıldı. BONUS: Gold Trend Coach için ÜCRETSİZ otomatik işlem EA. Satın aldıktan sonra bana yazın, göstergenin sinyallerini kendisi işleyen EA'y
GoldenX Entry MT5
VividMind Digital Solutions
5 (17)
GoldenX Entry, adaptif Smart Entry Trend algoritmasına, sinyal skorlaması sistemine, piyasa rejimi algılayıcısına ve volatilite filtresine sahip bir MT5 indikatörüdür. Her sinyal; hesaplanmış bir giriş seviyesi, üç adet Take-Profit seviyesi (TP1, TP2, TP3) ve bir Stop-Loss seviyesi içerir. Farklı piyasa koşullarına uyum sağlamak için tasarlanmış çok katmanlı analitik yapı üzerine kuruludur ve yerleşik optimizasyon aracı ile istatistik takip sistemini birleştirir. Risk-ödül (RR) metrikleri ve geç
SMC Intraday Formula
VividMind Digital Solutions
5 (26)
Önce dürüst olalım. Hiçbir gösterge tek başına sizi kârlı yapmaz. Eğer biri size aksini söylüyorsa, size bir hayal satıyordur. Mükemmel al/sat okları gösteren her gösterge, kusursuzmuş gibi görünecek şekilde yapılabilir — sadece geçmişin doğru bir bölümünü yakınlaştırıp kazanan işlemleri ekran görüntüsü almanız yeterlidir. Biz bunu yapmıyoruz.  SMC Intraday Formula bir araçtır. Piyasa yapısını sizin için okur, en yüksek olasılıklı fiyat bölgelerini belirler ve şu anda akıllı paranın izinin nası
Gann Made Easy , bay teorisini kullanarak ticaretin en iyi ilkelerine dayanan, profesyonel ve kullanımı kolay bir Forex ticaret sistemidir. WD Gann. Gösterge, Zararı Durdur ve Kâr Al Seviyeleri dahil olmak üzere doğru SATIN AL ve SAT sinyalleri sağlar. PUSH bildirimlerini kullanarak hareket halindeyken bile işlem yapabilirsiniz. Satın alma işleminden sonra, alım satım talimatlarını ve harika ek göstergeleri ücretsiz olarak almak için lütfen benimle iletişime geçin! Muhtemelen Gann ticaret yöntem
Ultra Indicator
Ihor Otkydach
5 (1)
ULTRA, “hepsi bir arada” prensibiyle çalışan bir teknik göstergedir; piyasayı bağımsız olarak analiz eder, işlem sinyalleri üretir, stop-loss emirlerinin verileceği seviyeleri gösterir ve kârı garantilemek ya da zararı en aza indirmek için işlemlerin ne zaman kapatılması gerektiğini önerir. Başka bir deyişle, piyasayı nasıl analiz edeceğinizi bilmeseniz, seviyeleri (stop-loss'unuzu nereye koyacağınızı) belirleyemeseniz ya da para yönetimi konusunda zorluk yaşasanız da fark etmez. ULTRA tüm bunla
Boba Analysis Suite
Trade Ready Solutions LLC
5 (2)
Boba Analysis Suite Boba Analysis Suite, MetaTrader 5 için geliştirilmiş bir analiz göstergesidir. Piyasa yapısını, önemli fiyat bölgelerini ve genel piyasa bağlamını tek bir grafik görünümünde bir araya getirir. Trader ve trading eğitmeni olarak edinilen uygulamalı deneyimden yola çıkarak geliştirilmiştir. Piyasanın yönünü değerlendirme, önemli seviyeleri belirleme ve birden fazla zaman dilimini birlikte inceleme gibi adımlardan oluşan sistematik bir analiz sürecini destekler. Piyasa Bağlamını
Sonraki Güncelleme — Sürüm 2.52 Çok Yakında! [YENİ] Piyasa Analizinizi ve İşlem Sürecinizi Geliştirmek İçin Tasarlanmış 4 Büyük Yeni Özelliğe Hazır Olun İşlem ihtiyaçlarınızı karşılamak üzere tasarlanmış 4 yeni özellikle piyasa analizini bir üst seviyeye taşıyoruz. İşte yeni özellikler: 1. TRADE OVERVIEW DASHBOARD 2. CONFLUENCE AT ZONE 3. STRONG & WEAK HIGH/LOW 4. OTE 1. TRADE OVERVIEW DASHBOARD Piyasanın genel görünümünü daha kolay anlamanıza yardımcı olan, işlem kararlarınızı desteklemek için
M1 Sniper MT5
Oleg Rodin
5 (7)
M1 SNIPER   kullanımı kolay bir işlem göstergesi sistemidir. M1 zaman dilimi için tasarlanmış bir ok göstergesidir. Gösterge, M1 zaman diliminde scalping için bağımsız bir sistem olarak kullanılabilir ve mevcut işlem sisteminizin bir parçası olarak kullanılabilir. Bu işlem sistemi özellikle M1'de işlem yapmak için tasarlanmış olsa da, diğer zaman dilimleriyle de kullanılabilir. Başlangıçta bu yöntemi XAUUSD ve BTCUSD ticareti için tasarladım. Ancak bu yöntemi diğer piyasalarda işlem yaparken de
Gold Entry Sniper
Tahir Mehmood
5 (23)
Gold Entry Sniper – Altın Scalping & Swing Trading için Profesyonel Çoklu Zaman Çerçeveli ATR Paneli Gold Entry Sniper , XAUUSD ve diğer enstrümanlar için doğru al/sat sinyalleri veren, ATR Trailing Stop mantığı ve çoklu zaman çerçevesi analizi ile geliştirilmiş gelişmiş bir MetaTrader 5 göstergesidir. Temel Özellikler ve Avantajlar Çoklu Zaman Çerçevesi Analizi – M1, M5, M15 trendlerini tek panelde gösterir. ATR Tabanlı Trailing Stop – Volatiliteye göre dinamik olarak ayarlanır. Profesyonel Gra
FiboSniper Pro
Van Minh Nguyen
5 (4)
FiboSniper Pro – Multi-Filter Fibonacci System with Auto SL/TP and Control Panel FiboSniper Pro, seçilmiş Buy ve Sell sinyalleri üretmek için dinamik Fibonacci Envelopes ile birden fazla doğrulama filtresini birleştiren teknik bir göstergedir. Fibonacci seviyeleri Moving Average ve ATR temel alınarak hesaplanır ve ardından ADX, EMA, RSI, ATR, Volume, Time ve Candle yapısı ile filtrelenir. Gösterge, ATR tabanlı otomatik Stop Loss ve Take Profit seviyelerini doğrudan grafik üzerinde görüntüler ve
ARICoins
Temirlan Kdyrkhan
ARICoin is a powerful trading companion designed to generate high-probability entry signals with dynamic TP/SL/DP levels based on volatility. Built-in performance tracking shows win/loss stats, PP1/PP2 hits, and success rates all updated live. Key Features: Buy/Sell signals with adaptive volatility bands Real-time TP/SL/DP levels based on ATR Built-in MA Filter with optional ATR/StdDev volatility Performance stats panel (Success, Profit/Loss, PP1/PP2) Alerts via popup, sound, push, or email Cust
ScalpPoint
Temirlan Kdyrkhan
ScalpPoint is a powerful trading companion designed to generate high-probability entry signals with dynamic TP/SL/DP levels based on volatility. Built-in performance tracking shows win/loss stats, PP1/PP2 hits, and success rates — all updated live. Key Features: Buy/Sell signals with adaptive volatility bands Real-time TP/SL/DP levels based on ATR Built-in MA Filter with optional ATR/StdDev volatility Performance stats panel (Success, Profit/Loss, PP1/PP2) Alerts via popup, sound, push, or emai
Auto Optimized SpeedAngle , sürekli İleriye Dönük Optimizasyon (Walk-Forward Optimization, WFO) yoluyla eğri uydurmayı (curve-fitting) ortadan kaldıran kurumsal düzeyde bir momentum vektörleme sistemidir. Piyasa rejimleri değiştiğinde etkinliğini yitiren statik girdilere güvenmek yerine, gösterge, örneklem dışı (Out-of-Sample, OOS) doğrulama kullanarak parametrelerini dinamik olarak yeniden kalibre eder ve böylece gösterilen sinyallerin geçmişteki rastgele anomalileri değil, gerçek bir istatisti
Adaptive Price Action Engine Göstergeyi al, EA'sı (Uzman Danışman) bedava gelsin Kendi Kendini Optimize Eden Multi-Timeframe Trend ve Mum Formasyonu Analizi Piyasalar sürekli değişir ve her Price Action formasyonu her piyasa koşulunda aynı değere sahip değildir. Adaptive Price Action Engine , değişen piyasa koşullarına uyum sağlamak amacıyla trend yapısını, Multi-Timeframe analizini, mum formasyonlarını ve istatistiksel optimizasyonu tek bir analiz sistemi içerisinde birleştirir. İki Adaptif Mod
Crystal Heikin Ashi Signals
Muhammad Jawad Shabir
5 (5)
Crystal Heikin Ashi Signals—Professional Trend & Signal Detection Indicator Advanced Heikin Ashi Visualization with Intelligent Signal System for Manual & Automated Trading Final Price: $149 ---------> Price goes up $10 after every 10 sales . Limited slots available — act fast . Overview User Guide PDF Crystal Heikin Ashi Signals is a professional-grade MetaTrader 5 indicator that combines pure Heikin Ashi candle visualization with an advanced momentum-shift detection system. Designed for both m
Scalper Vault, gün içi işlemlerde istikrar yakalamak isteyen yatırımcılar için tasarlanmış, güçlü ve tam donanımlı bir alım satım sistemidir. Bu yüksek hassasiyetli gösterge; hem Forex hem de İkili Opsiyon yatırımcıları için kurumsal düzeyde analizler sunan, bağımsız ve eksiksiz bir alım satım sistemi işlevi görür. SATIN ALIM İŞLEMİNDEN SONRA BENİMLE İLETİŞİME GEÇİN; ALIM SATIM İPUÇLARIMI VE HARİKA BİR BONUSU ALIN! Tahmin yürütme zorunluluğunu ve karmaşık manuel analiz süreçlerini ortadan kaldı
Trend Catcher ind mt5
Ramil Minniakhmetov
5 (18)
TREND YAKALAYICI GÖSTERGE Trend Yakalayıcı Gösterge, yazarın tescilli ve özelleştirilmiş uyarlanabilir trend analiz göstergelerinin bir kombinasyonunu kullanarak piyasa fiyat hareketlerini analiz eder. Kısa vadeli gürültüyü filtreleyerek ve temel momentum gücüne, volatilite genişlemesine ve fiyat yapısı davranışına odaklanarak gerçek piyasa yönünü belirler. Ayrıca, hareketli ortalamalar, RSI ve volatilite filtreleri gibi yumuşatma ve trend filtreleme özelleştirilmiş göstergelerinin bir kombina
Tokyo mt5 Indicator
Vasiliy Strukov
5 (15)
Tokyo Indicator; trend yönü, potansiyel işlem sinyalleri ve piyasa koşulları hakkında net ve görsel bir genel bakış sunar. Renk kodlu ve kademeli trend çizgisi, yükseliş evrelerini (mavi) düşüş evrelerinden (macenta) ayırt eder. Trend değiştiğinde, buna karşılık gelen yön okları potansiyel alım ve satım fırsatlarını vurgular. Entegre bir panel; mevcut sinyali, piyasa eğilimini, momentumu, volatiliteyi ve sinyal kalitesini tek bir kullanışlı görünümde bir araya getirir. Bu sayede yatırımcılar, fa
Atomic Analyst MT5
Issam Kassas
4.5 (64)
Atomic Analyst — MetaTrader 5 Satın aldıktan sonra Smart Universal Expert Advisor'ı ÜCRETSİZ edinmek ve beraberinde çevrimiçi kurs, PDF kılavuzu ve özel gruba erişim almak için MQL5 üzerinden bana mesaj gönderin. Atomic Analyst; fiyat hareketini, trend yönünü, giriş ve çıkış sinyallerini, Stop Loss ve birden fazla Take Profit seviyesini doğrudan grafiğinizde bir araya getirir. SİNYALİ GÖRÜN. İŞLEM KOŞULLARINI ANLAYIN. Atomic Analyst, analizini anlaşılır görsel bilgiler halinde sunar: • Olası gir
Unix Scalper
Issam Kassas
4 (4)
Unix Scalper — MetaTrader 5 Satın aldıktan sonra Smart Universal Expert Advisor'ı ÜCRETSİZ edinmek ve beraberinde çevrimiçi kurs, PDF kılavuzu ve özel gruba erişim almak için MQL5 üzerinden bana mesaj gönderin. İşlem fırsatını belirleyin. Planı görün. Nasıl işlem yapacağınıza karar verin. UNIX Scalper; piyasa analizini, BUY/SELL/WAIT kararlarını ve Entry, Stop Loss, TP1 ve TP2 seviyelerini düzenli bir panelde bir araya getirir. SİNYALİ VE PLANI GÖRÜN • Net kararlar: BUY, SELL veya WAIT. • Belir
SIO Oscillator: Kendi Kendini Optimize Eden Yarı Varyans Dengesizlik Osilatörü İndikatörü satın alın, ona dayalı Uzman Danışmanı (EA) ÜCRETSİZ edinin. Çoğu osilatör, tüm fiyat hareketlerini aynı şekilde değerlendirir. SIO ise yükseliş ve düşüş baskısını birbirinden ayırır ve aralarındaki dengesizliği ölçerek piyasayı gerçekte kimin kontrol ettiğini gösterir: alıcılar mı, satıcılar mı. Dengesizlik bir uç noktaya ulaştığında SIO, giriş, Stop Loss ve Take Profit seviyeleriyle birlikte net bir sinya
Volatility Master for MetaTrader is a real-time dashboard tool that scans up to  50 symbols  to identify high-volatility , trending markets instantly. With bullish/bearish signals, customizable alerts, and a user-friendly interface, it helps you avoid range-bound conditions and focus on high-probability trades. Clarity leads to confidence. Trade confidently and protect your capital effectively with this powerful dashboard. We don't offer free or bonus indicators in exchange of reviews from you.
Smc Pro ToolKit
Talal N Z Aljarusha
5 (14)
SMC PRO TOOLKIT — SMART MONEY ANALYSIS & STRUCTURED TRADE PLANNING SMC Pro ToolKit is a professional Smart Money Concepts analysis workspace for MetaTrader 5. It combines market structure, multi-timeframe analysis, institutional price zones, setup evaluation, confirmation tools, volume context, alerts, and risk planning inside one organized chart environment. One workspace. Multiple layers of confirmation. One structured trading plan. OPEN COMPLETE USER GUIDE MULTI-CONDITION SETUP ENGINE At
Yazarın diğer ürünleri
Pivot Stop Gold
Vasilii Makarenko
Pivot Stop Gold, altın üzerinde tek bir durum etrafında kurulmuştur: fiyat bir swing seviyesinde döner ve sonra oradan geçer. EA bu hareketin peşinden gitmez. Fiyat oraya varmadan önce, swing seviyesinin yakınında stop ve hedefi bağlı bir bekleyen stop emri zaten beklemektedir. Pozisyonlar kısadır: aşağıdaki raporda ortalama pozisyon beş dakika sürmüştür. Pivot Seviyesi Çalışma zaman diliminin her yeni barında EA son 300 bardan bir ZigZag oluşturur ve en son iki pivotu alır, hala oluşmakta olan
Swept Liquidity Pools
Vasilii Makarenko
5 (1)
A liquidity sweep is a bar that pushes past a prior swing high or swing low, where protective stop orders tend to rest, and then closes back on the inner side of that level. The same event is known under several names: a stop hunt, a stop run, a liquidity grab, a false breakout, a failed breakout, or a swing failure. Swept Liquidity Pools marks those levels and those bars on the chart. The indicator tracks liquidity pools - confirmed swing levels that have not yet been taken - and marks the exac
FREE
Auto Level Map
Vasilii Makarenko
What Gets Drawn Most level tools mark every swing they can find, and a chart with forty lines answers nothing. This one keeps a level only when price came back to it, and prints the evidence next to the line: the number of touches and the age in days. Lines above current price and lines below it are drawn in different colours, so the map reads at a glance without counting. What Puts A Level On The Chart A swing high is a bar whose high is not lower than its neighbours on both sides, within the n
FREE
Three Anchors On One Chart Most volume weighted average lines restart once a day. This one draws three at the same time: one anchored to the current trading session, one to the day, one to the week. Their spread tells you something a single line cannot. When the session line sits far under the weekly one, the week has been trading higher than today is; when all three sit together, the market has spent the week in one place. Why The Session Anchor Is Not Midnight The session line starts where the
FREE
Hourly Spread Map answers one question: at which hours does this symbol cost more to enter, and by how much. It reads the spread field that the terminal stores in every closed M1 bar of your own broker feed, sorts those measurements into 24 hours by 7 days of the week, and shows the result as a grid in the indicator sub-window. What It Measures Every closed M1 bar carries one spread measurement. The indicator collects them over the period you choose, groups them by the hour and weekday of the ba
FREE
Trade Risk Desk answers one question at the moment you need it answered: what volume makes this stop cost exactly what you decided to risk. Drag the stop line to where it belongs on the chart and the panel prints the volume, the money behind it, and the margin the position will hold. What It Answers Set the risk as a percent of balance or as a fixed amount in account currency. Put the stop where your idea says it belongs. The panel reads the symbol settings your broker publishes and prints: the
FREE
Swap is the part of the cost that is easy to forget, because it arrives once a day, quietly, and never appears in the spread. Swap Cost Calendar puts it on the chart as a number you can act on. What It Shows The panel reads what the broker publishes for the current symbol and shows four things. The cost of one night for a long position and for a short one, in your account currency or in points. The weekday line, showing how many nightly charges a position carries on each day of the week. The tri
FREE
Range Zones M30 draws zones on your chart where price was pushed back hard on the 30-minute timeframe. It works on any symbol and any chart timeframe, and reads only the prices your terminal already has. It does not use any server, does not send anything out, and does not open or change orders. What It Shows A resistance zone above the market and a support zone below it, as filled rectangles that start at the open of the swing candle that formed them and run to the right. At any moment there is
Signal Confirm
Vasilii Makarenko
Signal Confirm watches one symbol and tells you when a trend setup has passed a fixed chain of checks. It works on any symbol and any chart timeframe. It reads only the M1 prices, the prices of the oscillator timeframe (M5 by default) and the daily prices your terminal already has, does not use any server, does not send anything out, and does not open, change or close orders. It shows what happened and when; the decision stays with you. What It Does When the chain below is complete, the indicato
Volatility Dots puts a trailing line of dots on your chart. In an uptrend the dots sit under the price, in a downtrend above it, and they flip when price closes through the opposite band. It works on any symbol and any timeframe. It reads only the prices your terminal already has, does not use any server, does not send anything out, and does not open or change orders. What It Shows One dot per bar. White dots under the candles mark a rising trend, red dots above the candles mark a falling trend.
Daily Range Ladder draws six horizontal levels across the current trading day. The distances come from how far the symbol usually travels in a day, so the levels adapt to every symbol without any setting. It works on any symbol and any chart timeframe. It reads only the daily bars your terminal already has, does not use any server, does not send anything out, and does not open or change orders. What It Shows Three resistance levels above the day's low and three support levels below the day's hig
Bir likidite havuzu, henüz alınmamış onaylanmış bir salınım yükseği veya salınım düşüğüdür. Bir likidite süpürmesi, fiyatın o seviyenin ötesinde işlem gördüğü ve ardından aralığın içine geri kapandığı bardır - yatırımcıların aynı olaya stop avı, stop çalıştırma, likidite kapma veya sahte kırılım da dediği olay. Liquidity Sweep Pools MTF, hem havuzları hem de üzerlerinde alınan likidite süpürmelerini, mevcut grafikte ve seçtiğiniz daha yüksek bir zaman diliminde işaretler ve aktif havuzlardan olu
Structure Desk
Vasilii Makarenko
XAUUSD için MetaTrader 5 üzerinde çalışan bir uzman danışman. Aynı anda tek bir sepetle çalışır: sabit sunucu saatlerinde açar, fiyat pozisyona karşı hareket ederken pozisyona ekleme yapar ve tüm sepeti birlikte kapatır. Tek tek pozisyonlarda stop loss ve take profit yoktur. Nasıl İşlem Yapar Tek sembol, XAUUSD, aynı anda tek sepet, aynı yönde en fazla 5 emir. Girişlere yalnızca sabit sunucu saatlerinde izin verilir ve yalnızca fiyat dört saatlik aralığının kenarında olduğunda. Sunucu saatiyle 1
Sarveon
Vasilii Makarenko
Sarveon, MetaTrader 5 üzerinde XAUUSD için bir uzman danışmandır. Dokuz bağımsız strateji tek bir grafikte yan yana çalışır. Her birinin kendi magic number'ı, kendi giriş zaman dilimi ve kendi mesafe seti vardır ve hiçbiri bir başkasının açtığı pozisyona asla ekleme yapmaz. Nasıl İşlem Yapar Her strateji, kendi giriş zaman dilimindeki son barları bir swing seviyesi için tarar: sonraki hiçbir barın aşmadığı bir yüksek veya sonraki hiçbir barın kırmadığı bir düşük. Seviye, mevcut fiyattan minimum
Ridgeline
Vasilii Makarenko
Ridgeline, altının dokunmadığı fiyat seviyelerinde bekler. Günlük barları okur, sonraki hiçbir barın geçmediği yüksek ve düşükleri işaretler ve oraya bekleyen bir stop emri yerleştirir. Yedi kural seti tarihin farklı derinliklerinde arar, böylece biri geçen hafta oluşmuş bir seviyede beklerken bir diğeri üç ay öncesinden bir seviyeyi izler. Zarar eden bir set, yeniden bir şey yerleştirmeden önce iki gün devre dışı kalır. Her set kendi sihirli numarasını ve kendi mesafelerini taşır ve hiçbir set
Sixfold Gold
Vasilii Makarenko
Sixfold Gold trades XAUUSD on the hourly chart. It looks for the points where the market turned and left an extreme behind, places a pending stop order a little inside that level, and attaches a stop loss and a take profit before the order is ever filled. Six zones do this independently, each with its own search depth, and between them they read three timeframes and four sessions, so the advisor is rarely committed to a single view of the market. A trade that goes wrong is closed by its stop. No
GhBreak
Vasilii Makarenko
GhBreak tek bir altın fikri üzerine kuruludur: oluştuğundan beri korunan bir salınım yükseğinin veya düşüğünün kırılması, başarısız olan kırılmaların bedelini karşılayacak kadar uzağa gidebilir. EA kırılmanın peşinden gitmez. Fiyat oraya varmadan önce, seviyede bekleyen bir stop emri, stopu ve hedefi ekli olarak zaten beklemektedir. Pozisyonlar kısa süre tutulur: aşağıdaki raporda ortalama olan 22 dakika sürdü. Salınım Seviyesi Her kural seti saatlik verilerden kendi barlarını - H2, H4 veya D1 -
Beş Pencere Yerine Tek Panel Piyasayı okumak genellikle aynı anda birkaç pencere açık tutmak anlamına gelir: yön için bir hareketli ortalama, momentum için bir osilatör, trendi aralıktan ayırt etmek için bir güç göstergesi ve seviyeler için yine başka bir şey. Her biri kendi sorusunu ekranın kendi köşesinde yanıtlar. Signal Compass Desk bu okumaları grafiğin köşesinde tek bir blokta toplar. Tek bir bakış piyasanın hangi yöne meylettiğini, hareketin momentum kazanıp kaybetmediğini, arkasında güç
Tessera builds a footprint (cluster) chart from the trade ticks that your MetaTrader 5 terminal already receives from your broker. Prices, volumes and sides come from your own data feed; the indicator does not use any external server, does not send anything out and does not read or store your account details. What It Shows Buy and sell volume inside each bar, price by price, with numbers when they fit. Delta of the bar (the difference between buy and sell volume), cumulative delta and a delta st
What You See On The Chart Swing Percentile Desk places one table on one chart. Each row is a symbol from your watchlist and each column is a pullback size. A cell tells you what share of that symbol's earlier moves the current move has already outdone. A low number means a young move; a high number means the move is stretched compared with the history of the same symbol. Every symbol is compared only with itself, so a quiet pair and a restless pair are read on the same scale and no manual measur
Session Open Carry
Vasilii Makarenko
Session Open Carry is built on one idea: the side on which a session opened shows which way to hold a position until the next day. Once a day, at a set minute, the EA compares the last price with the open of the session. Price above the open - it buys. Price below the open - it sells. Price at the open - it stays out. The stop is placed at the extreme of the session, the position is carried overnight and it is closed at a set minute on a later day. The EA tests this idea on every session and doe
Gold Brackets
Vasilii Makarenko
Gold Brackets, bir altın hakkındaki tek bir fikre dayanır: kırılmadan duran bir salınım yükseğine veya düşüğüne geri dönen fiyat, genellikle o seviyeden kuvvetle geçer ve seviyede bekleyen bir stop emri, o hareketi kovalamadan yakalar. EA, bekleyen emri önceden, stop loss ve take profit zaten eklenmiş olarak yerleştirir ve seviye geçerliliğini yitirdiğinde emri iptal eder. Salınım Seviyesi Her kural seti, en yakın salınım yükseği ve salınım düşüğü için saatlik barlara bakar: yükseği (veya düşüğü
Filtrele:
Değerlendirme yok
Değerlendirmeye yanıt