Daily Range Ladder
- Indicadores
- Versão: 1.0
- Ativações: 20

Daily Range Ladder draws six horizontal levels across the current trading day. The distances come from how far the symbol usually travels in a day, so the levels adapt to every symbol without any setting. It works on any symbol and any chart timeframe. It reads only the daily bars your terminal already has, does not use any server, does not send anything out, and does not open or change orders.
What It Shows
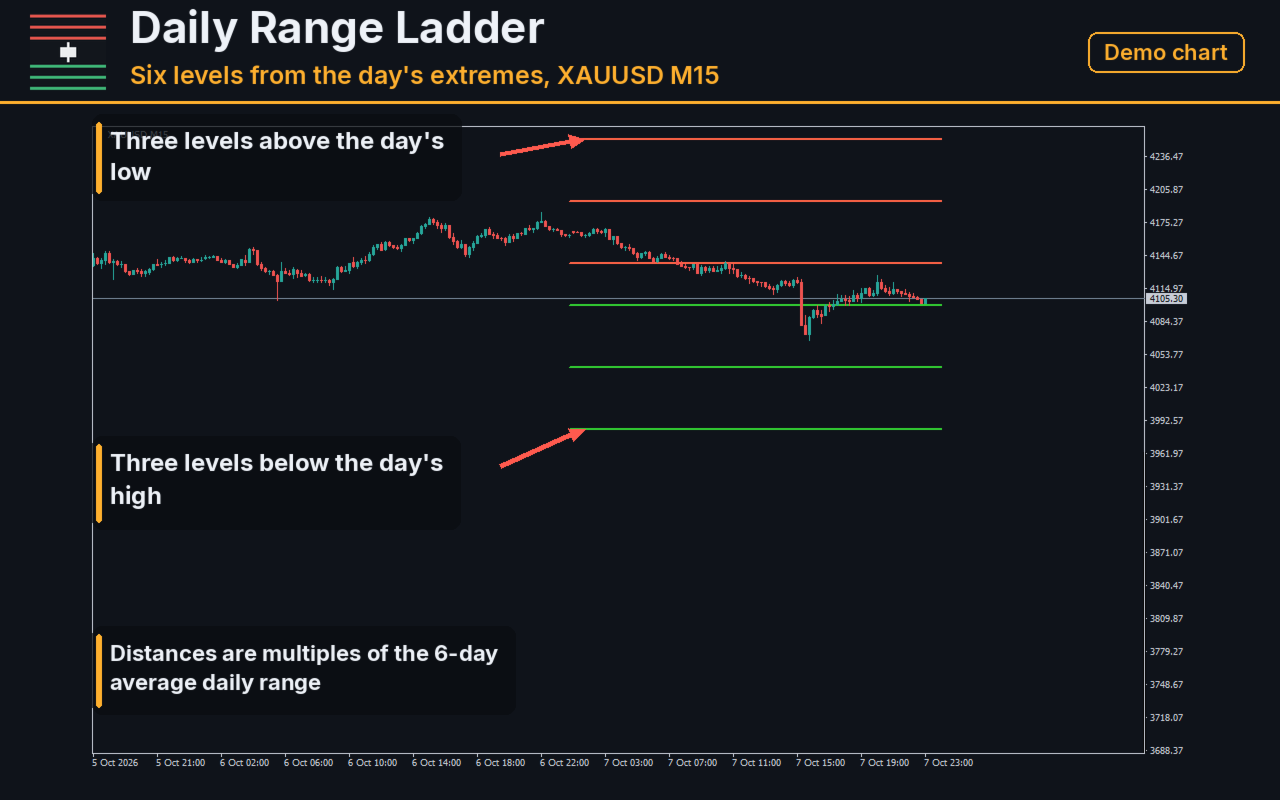
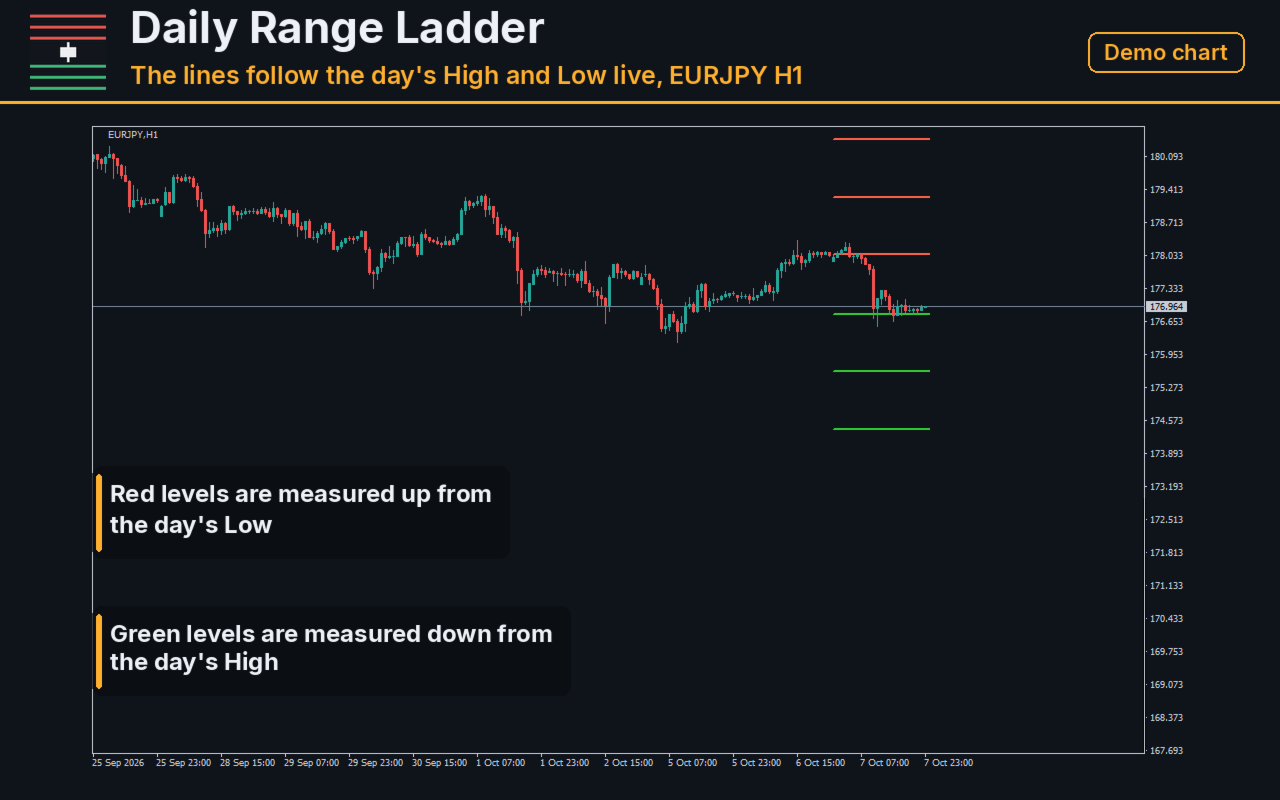
Three resistance levels above the day's low and three support levels below the day's high. All six move live: when the day sets a new low the three upper levels move down with it, when the day sets a new high the three lower levels move up with it. Each line spans the whole day and carries the prefix VolLevels_ in its name. On daily and weekly charts one day is a single candle, so the indicator is meant for intraday charts.
How The Levels Are Calculated
The average daily range A is the simple average of the true range of the last six finished daily bars (true range uses the previous close). The resistance levels are the day's low plus 1.0, 1.8 and 2.6 times A. The support levels are the day's high minus 1.0, 1.8 and 2.6 times A. Prices are rounded to the digits of the symbol.
Reading The Chart
Red lines are the upper levels, green lines the lower levels. Early in the day, when the range so far is small, the levels sit far from the market; as the range grows the nearest levels come closer. The three multiples give a ladder of distances measured in the symbol's own typical daily movement rather than in fixed points.
Input Parameters
AtrDays - the number of finished daily bars in the average (6 by default). Mult1, Mult2 and Mult3 - the three multiples (1.0, 1.8 and 2.6). ColorRes, ColorSup and LineWidth - the look of the lines. ExtendDay - the line spans the whole day (default) or only 30 minutes around the latest tick.
Code Check
The released build was checked against a separate recalculation of the daily bars, written in Python, on 12 charts of 12 symbols with two, three, four and five decimal places and chart timeframes from M1 to W1. All 72 lines equalled that recalculation, rounded to the digits of the symbol, and the terminal journal showed no errors from the indicator.
What This Product Is Not
It is not a trading signal service, it does not predict the market and it does not promise any result. The levels are nothing more than distances scaled to the symbol's typical daily movement, and whether price respects them on any given day is yours to judge.
Notes
No trading functions, no network access, no files. Screenshots in this listing show the indicator on a demo symbol.
Support
Questions and bug reports through the product page comments. Please attach the symbol, the chart timeframe and the broker server time of the problem.