Candle Clock Desk
- Indicatori
- Versione: 1.0

What It Shows
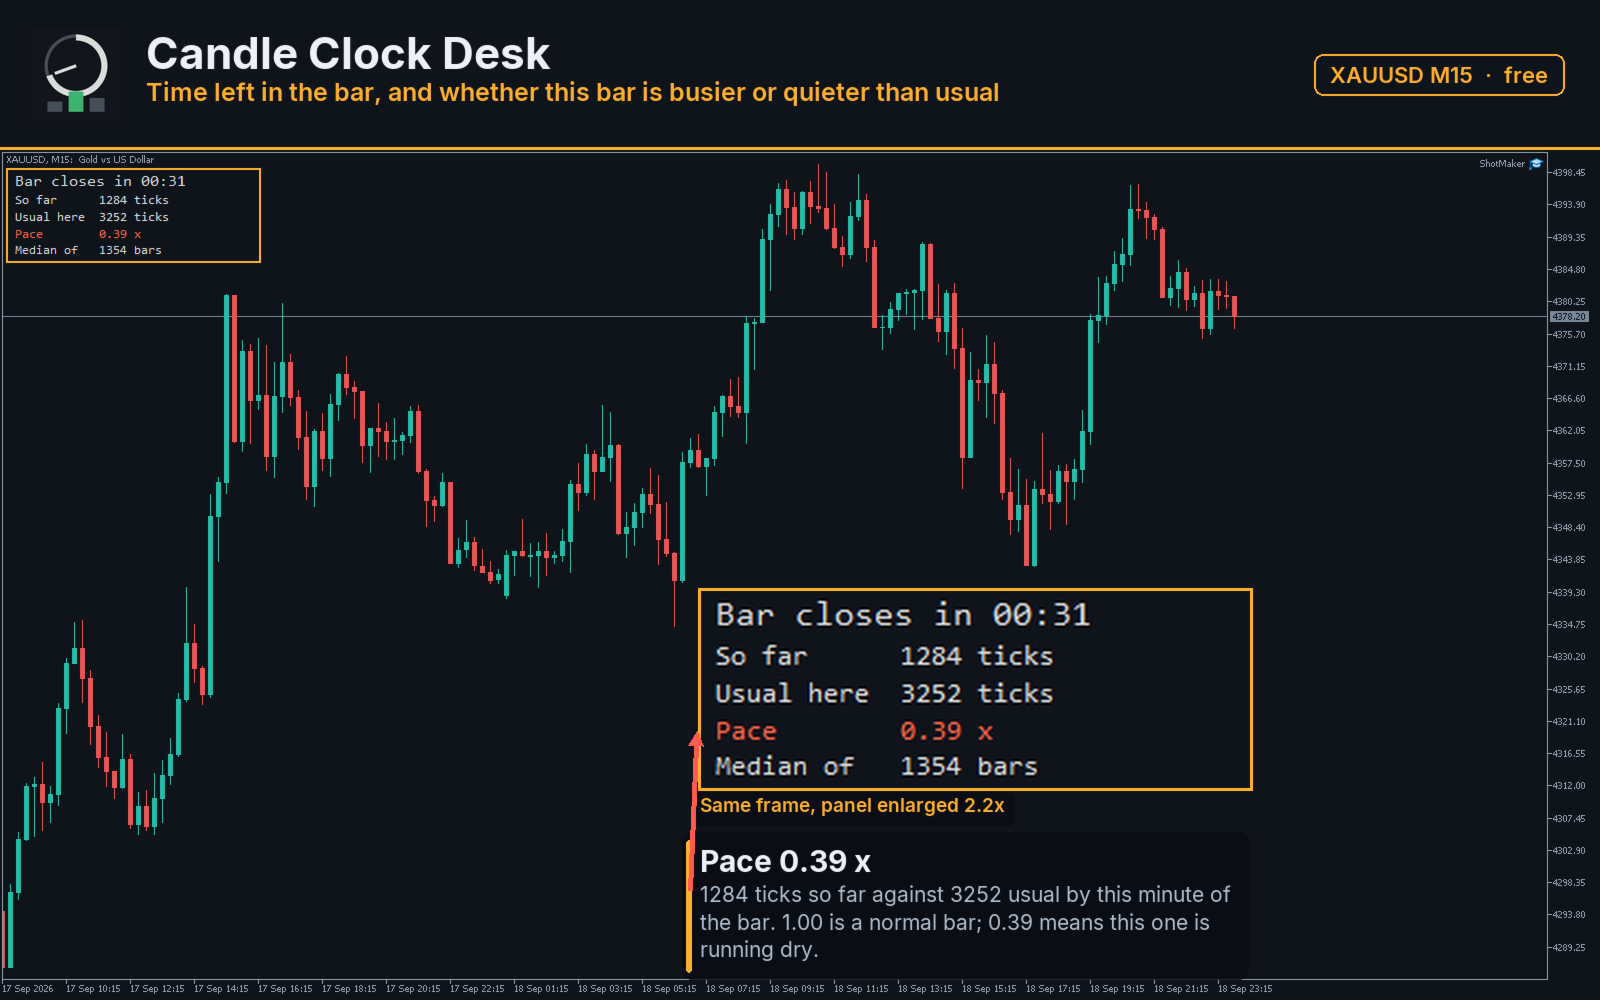
Candle Clock Desk puts four lines on the chart. The first is the time left until the current bar closes. The next three answer a question the clock alone cannot: is this bar unusually busy, or unusually quiet, right now.
- Bar closes in - the countdown, in minutes and seconds
- So far - volume this bar has accumulated since it opened
- Usual here - what this symbol had accumulated by this same minute, in the past
- Pace - the first divided by the second
The Pace Line
Pace of 1.00 means the bar is filling exactly as it normally does at this point. 2.00 means twice the usual volume has already arrived. 0.40 means the bar is running dry. The figure is not a signal and is not tied to direction: it says how much trading is happening, not where price is going.
Where The Usual Figure Comes From
The comparison is built from M1 bars your terminal already holds. Every M1 bar belongs to exactly one bar of the chart timeframe, and its position inside that bar is known from the timestamps. For each minute of the bar the panel takes the volume accumulated by that minute in every finished bar of the history window, and keeps the median.
A simpler method would be to take the volume of the whole bar and multiply it by the share of time elapsed. That method is wrong on every instrument with a session: volume does not arrive evenly. The open, the London and New York overlap and the minutes around a release carry far more of it than the middle of the bar. The median profile keeps that shape instead of flattening it.
The median, not the average, is used on purpose. One release day with ten times the normal volume moves an average for weeks; the median stays where the ordinary bars are.
Reading It During A Session
Open the chart, let the terminal pull its M1 history, and watch the Pace line through one session. It sits near 1.00 for long stretches and climbs when something arrives. Compare a reading above 2.00 with the Market Watch and with the news calendar for that minute: the panel and the tape describe the same event from two sides.
When the history window holds fewer finished bars than MinBarsForMedian for a given minute, the panel prints that the median is not available rather than showing a figure built on two samples.
Input Parameters
- HistoryDays - days of M1 history the median is built from
- VolumeSource - tick volume, or real volume where the broker supplies it
- MinBarsForMedian - how many finished bars a minute needs before its median is shown
- MaxM1BarsToScan - hard cap on how many M1 bars are read
- ShowPanel - draw the panel or keep only the buffers
- PanelCorner - corner of the chart, offsets, font size
- ColorFast - colour used when the pace is at or above 1.00
- ColorSlow - colour used when it is below
- ObjectPrefix - prefix for every chart object created
Reading The Figures From An Expert Advisor
Four buffers are published and available through iCustom: buffer 0 is the seconds left in the current bar, buffer 1 is the volume accumulated so far, buffer 2 is the median for this minute, buffer 3 is the pace. Buffer 2 and buffer 3 return an empty value while the median is not available, so an expert advisor can tell "quiet" from "not measured yet".
Requirements
Any symbol and any timeframe from M5 upward; the profile is built from M1 history, so an M1 chart has nothing to compare against and the panel then shows the clock and the volume only. The indicator places no orders, writes nothing to disk and works the same on a demo and a live account of the same broker.
Support
Questions about a parameter, or a case where the panel and your terminal disagree: reply in the comments of this page with the symbol, the timeframe and the broker, and I will look into it. Ratings help other traders decide whether a free tool is worth their time, whichever way they go.