Cs Fixed Range Volume Profile
- Indicadores
- Versão: 1.0
- Ativações: 10

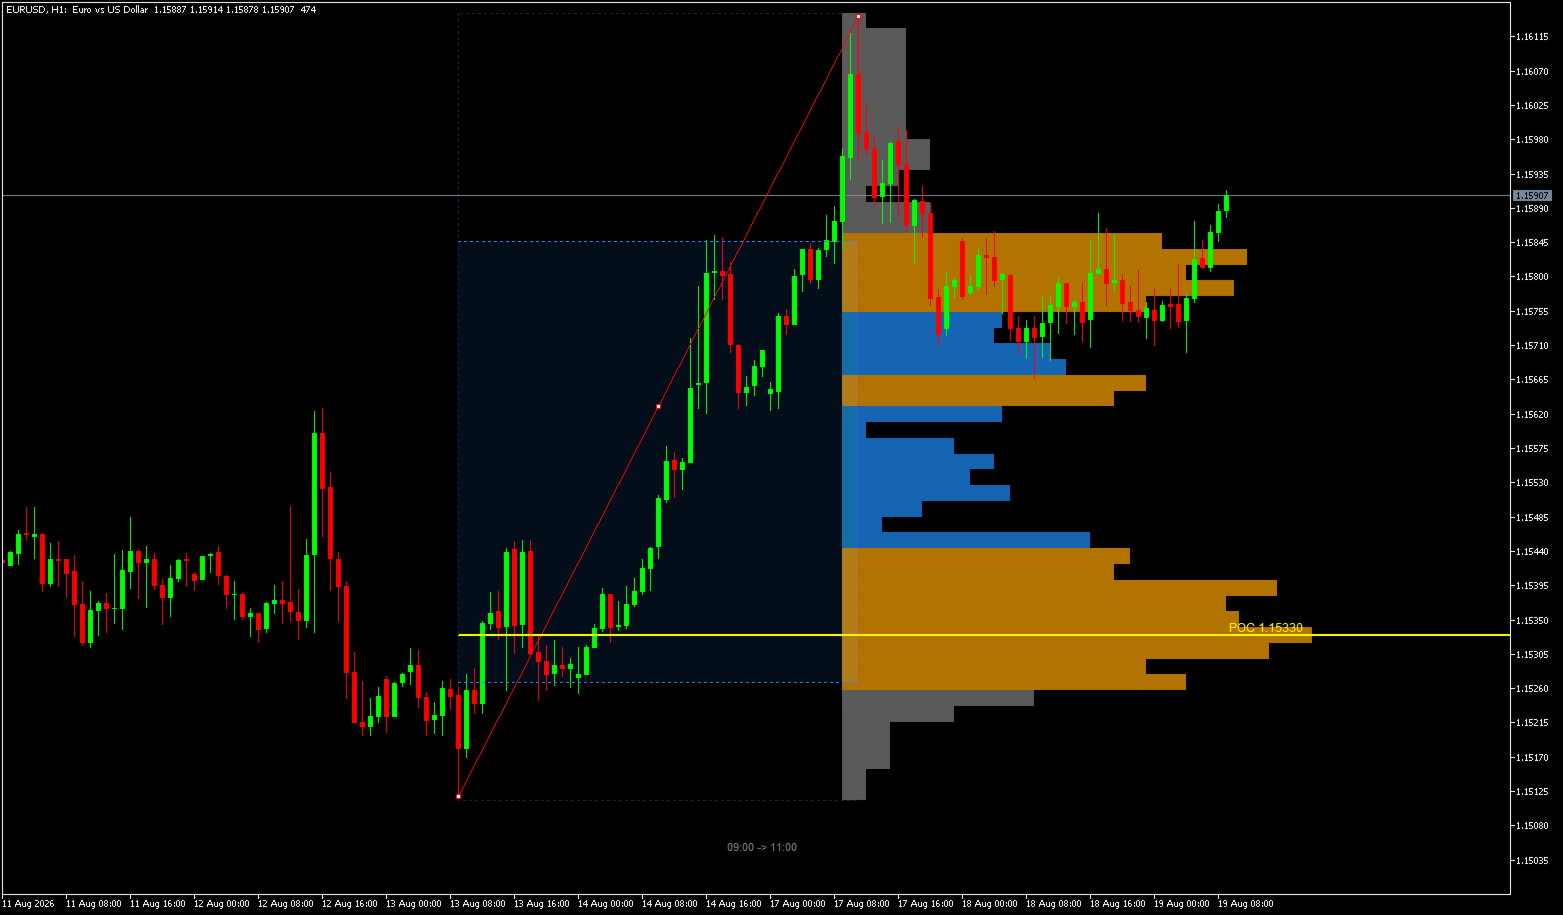
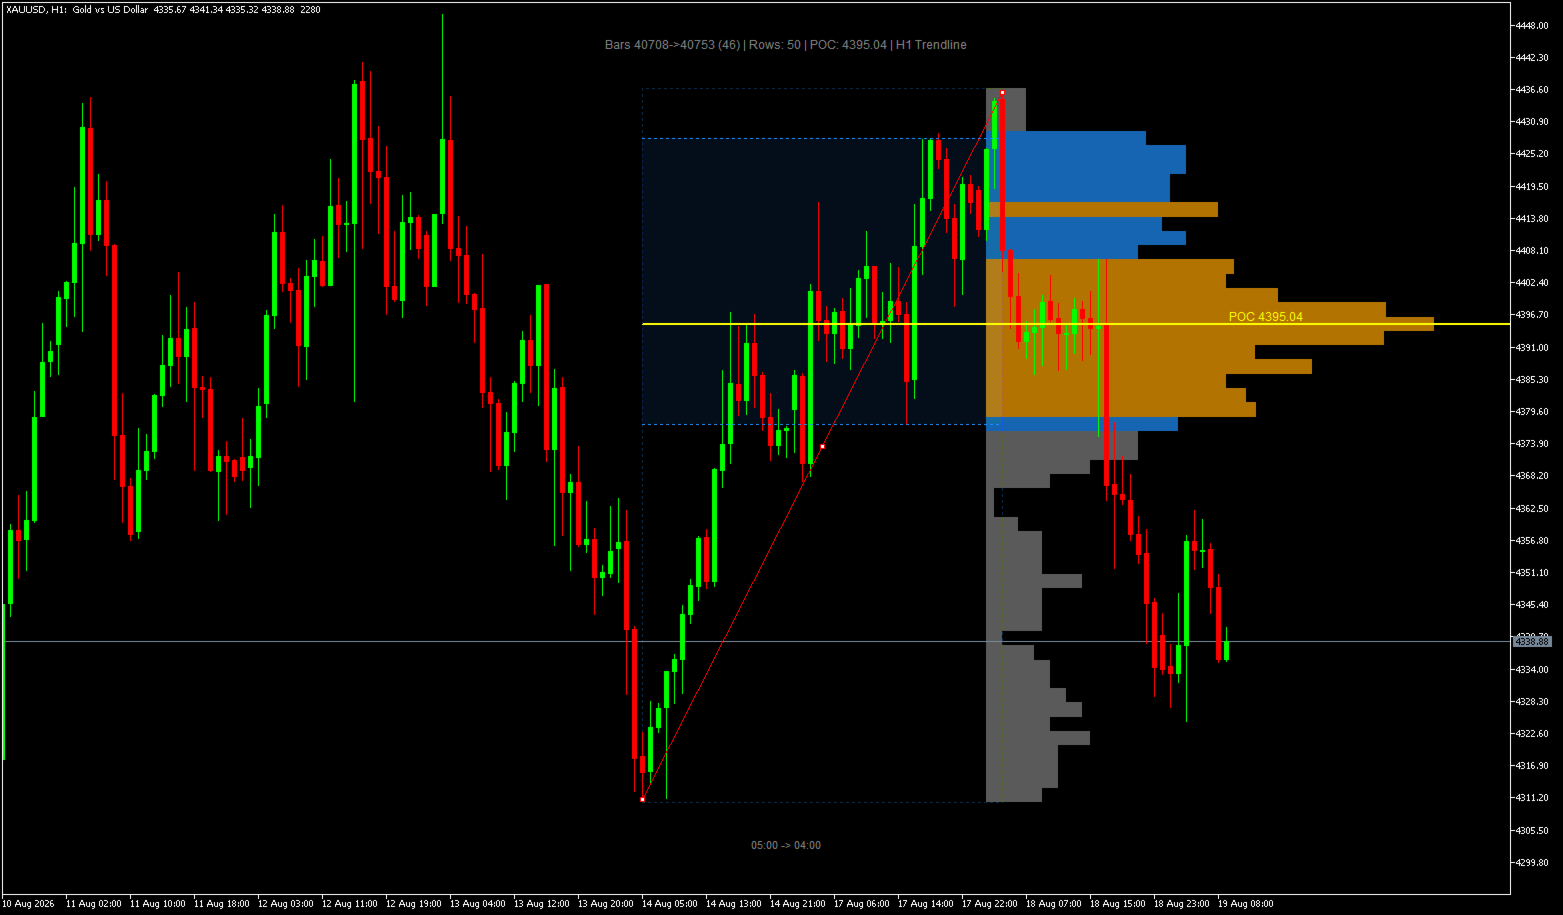
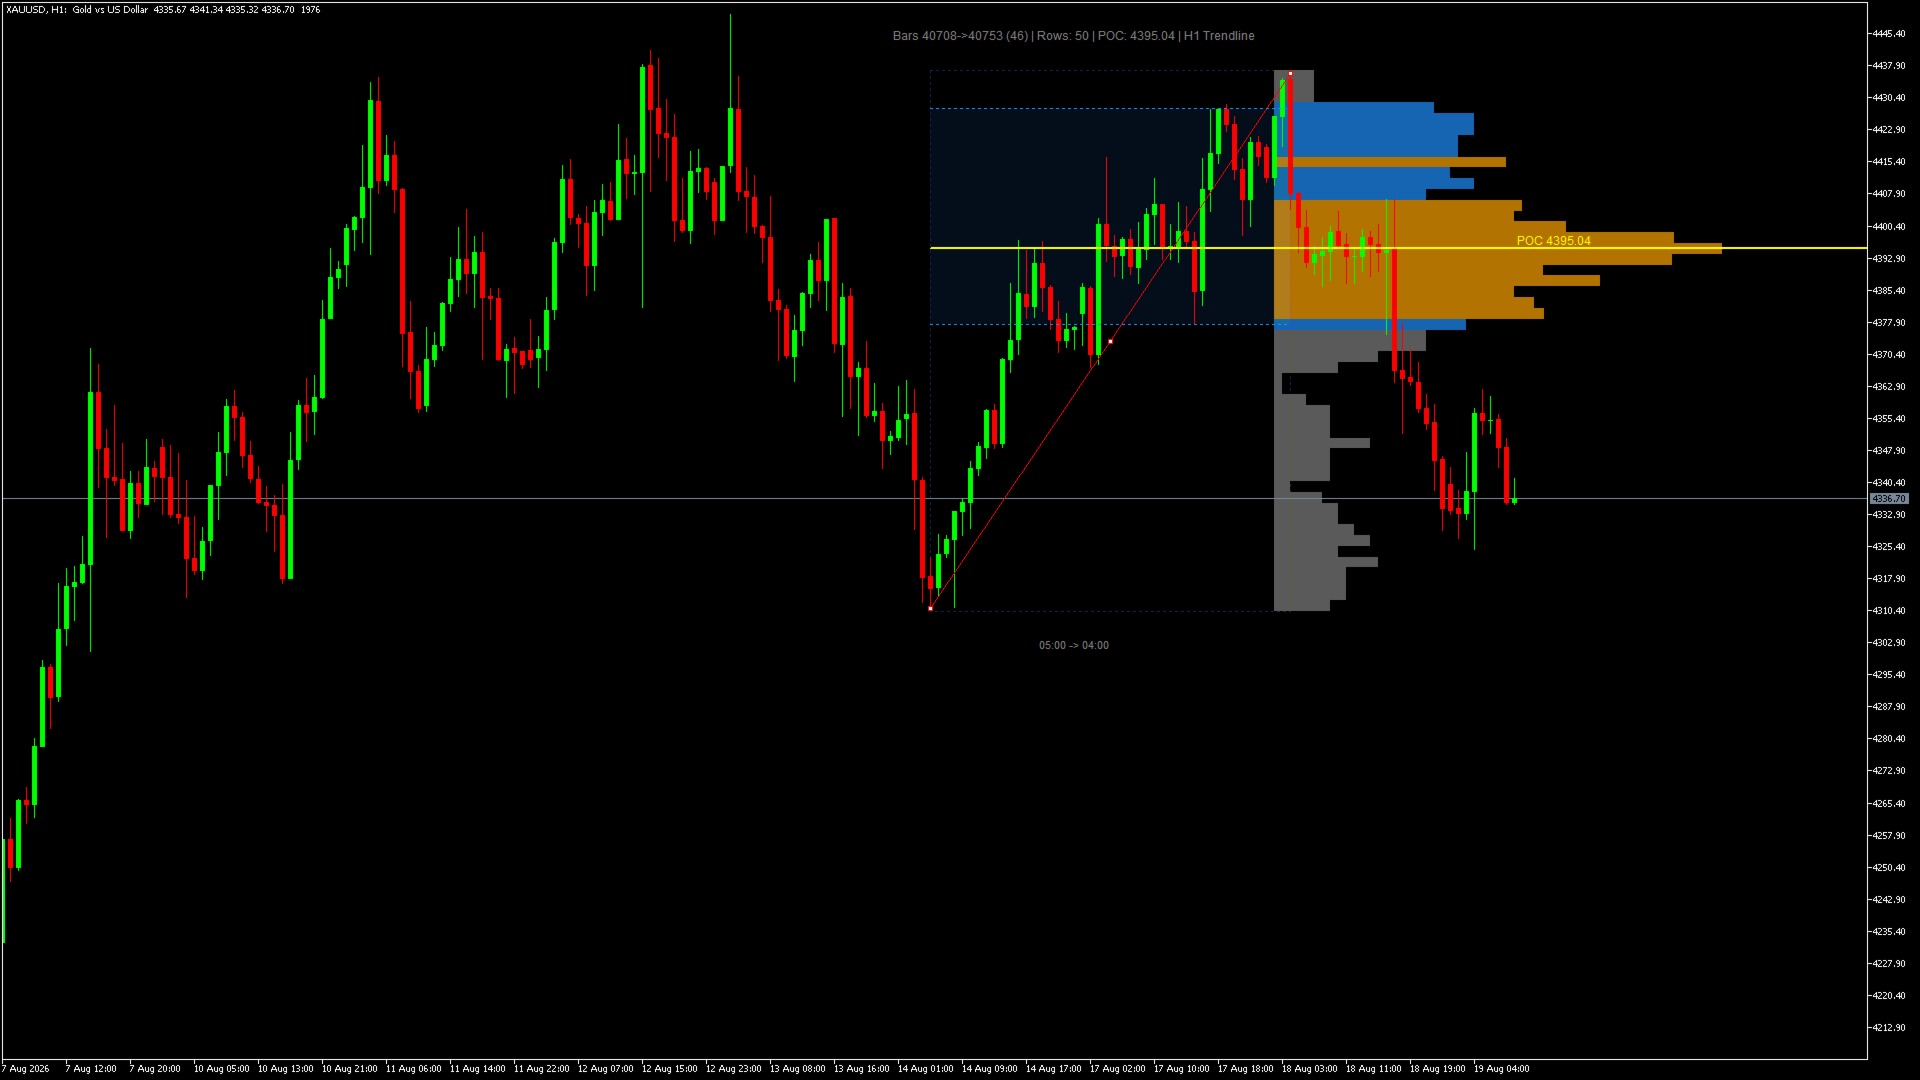
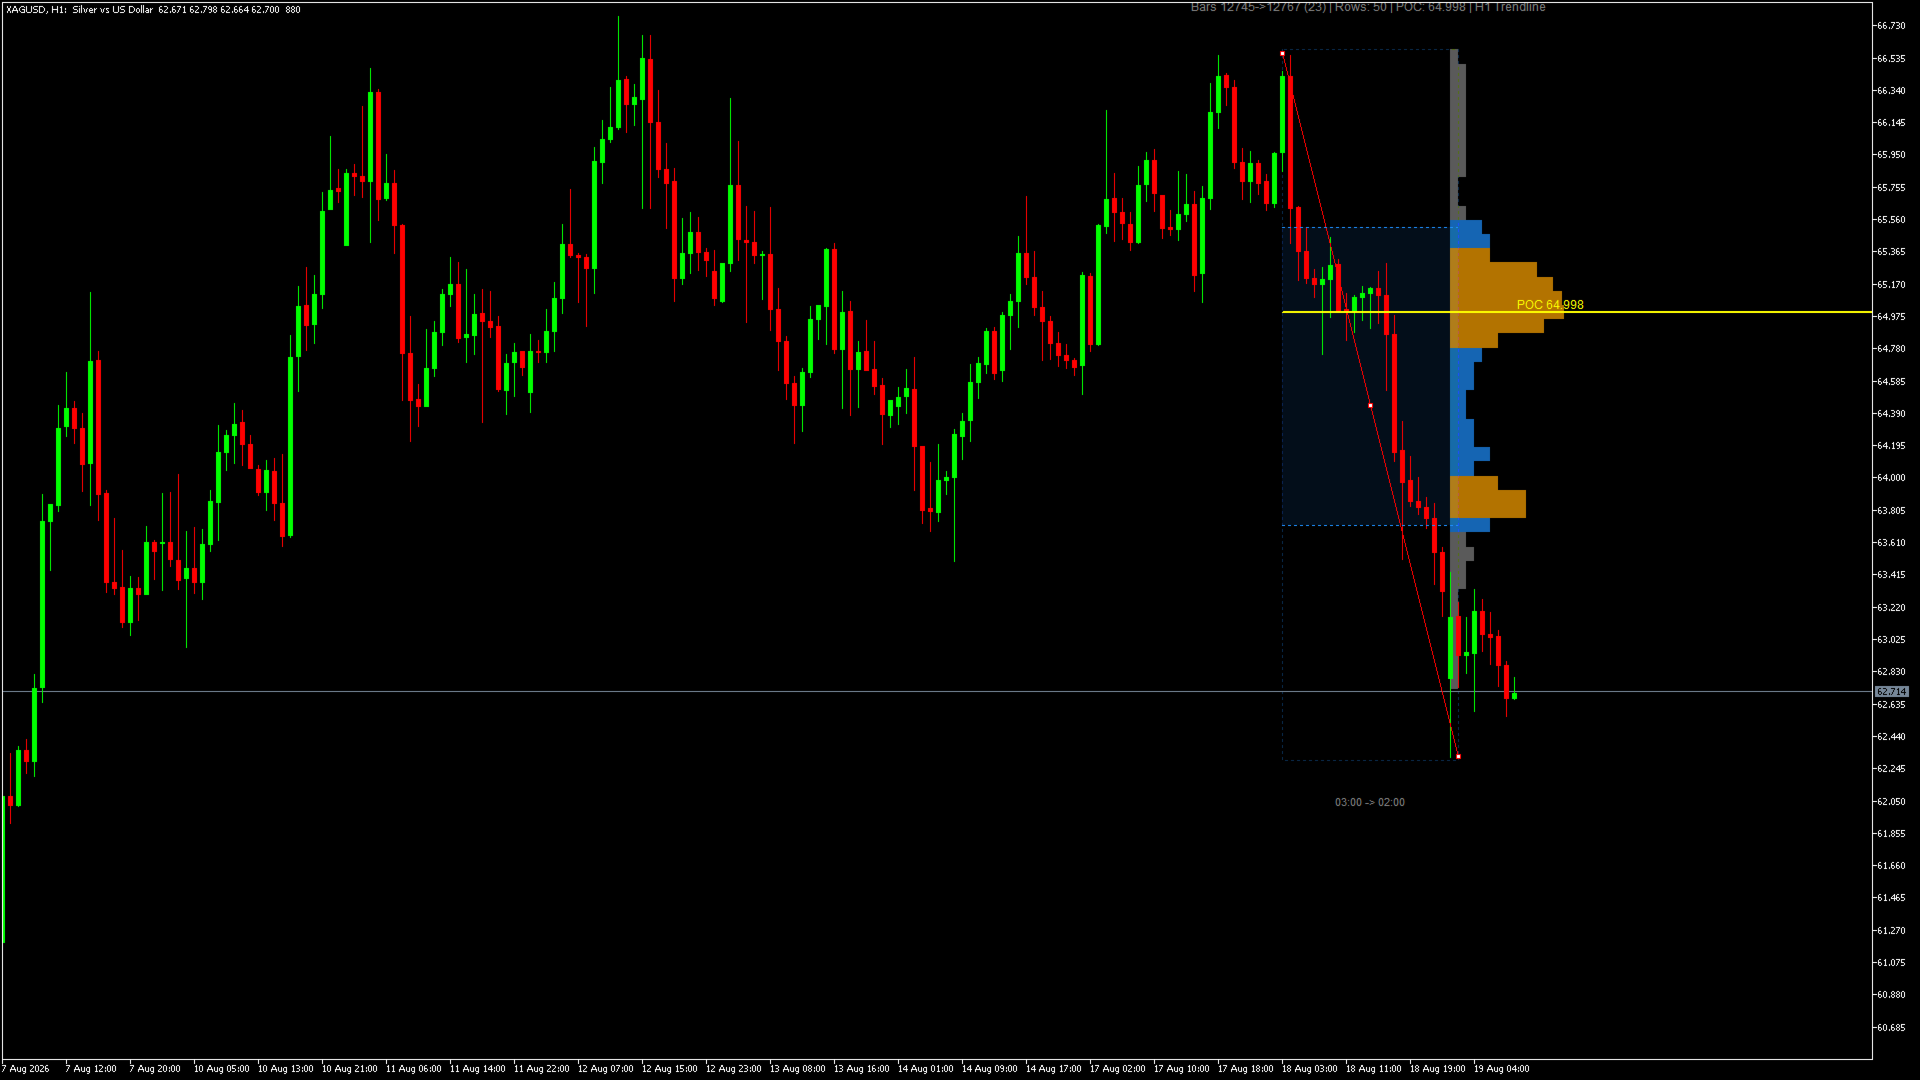
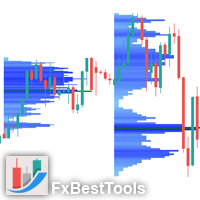
Fixed Range Volume Profile is an MT5 volume analysis tool that calculates and displays volume distribution across any custom price and time range using standard chart trendlines for Forex, Gold (XAUUSD), Indices, and Crypto.
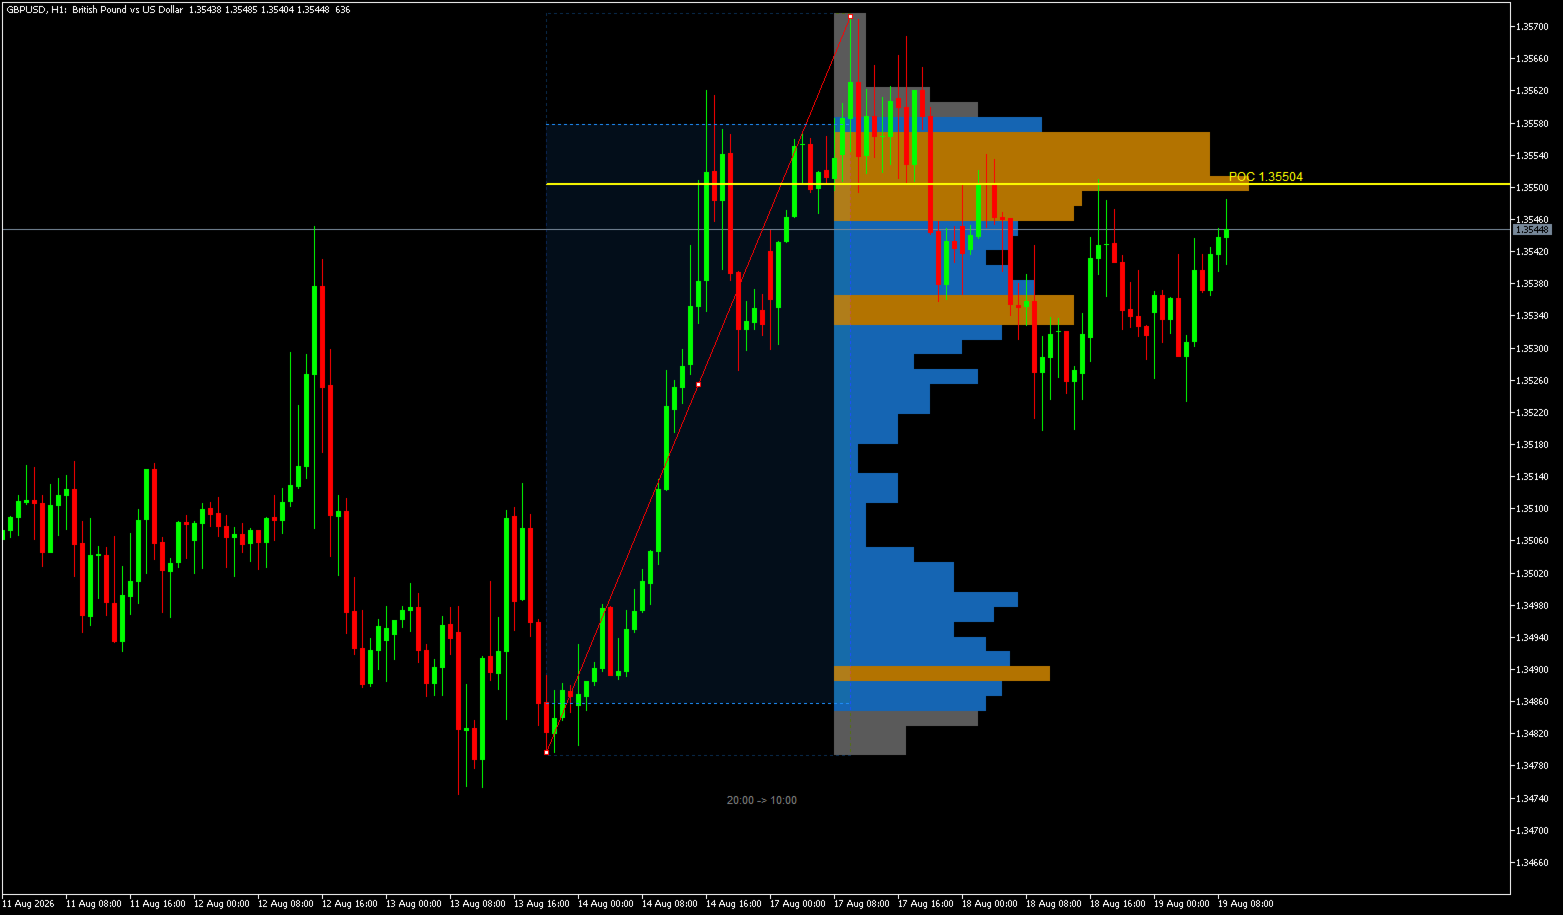
Designed for day trading, scalping, and swing trading, this indicator automatically maps the Point of Control (POC), Value Area boundaries (VAH/VAL), and high-volume support and resistance levels without requiring manual object naming or complex setup.
Core Volume Profile Architecture
The indicator features an intuitive trendline tracking engine that automatically detects the latest drawn or adjusted trendline on your chart. As you drag or resize the trendline handles across any swing move or consolidation zone, the volume histogram recalculates smoothly in real time between the start and end coordinates.
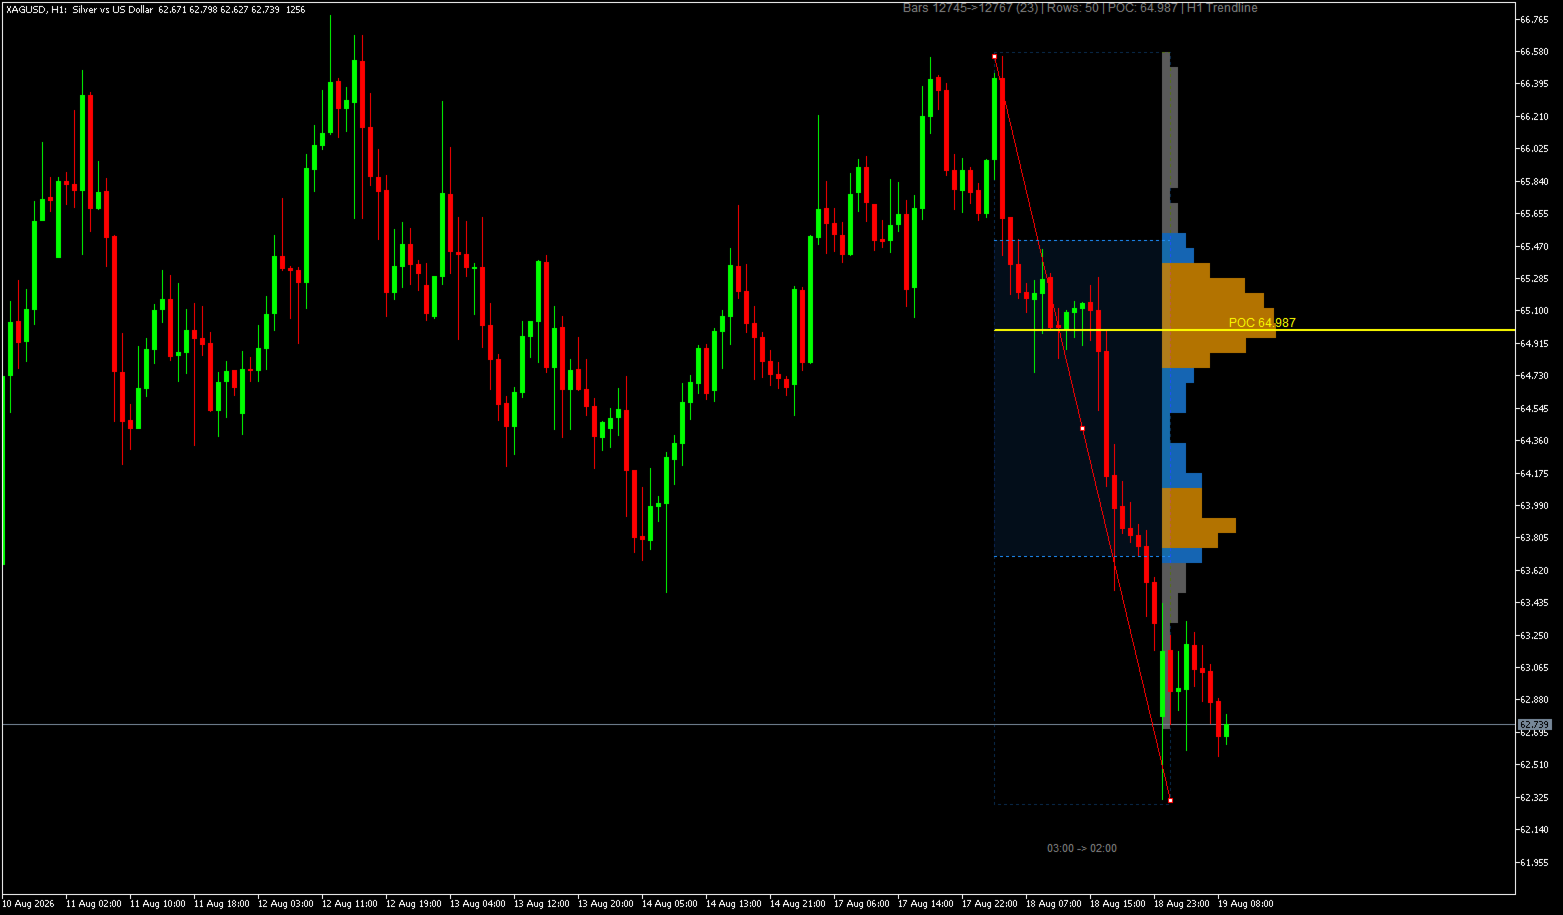
The system computes the Point of Control (POC) to identify the exact price level with the highest traded volume, alongside the Value Area (VAH and VAL) enclosing a configurable percentage (default 70%) of total range volume. High-volume rows are distinctly highlighted to mark key liquidity nodes, while low-volume rows reveal areas of price rejection and thin market participation.
Trading Workflow & Market Interpretation
To analyze market structure, simply draw a standard trendline across any price wave or sideways trading range. The indicator instantly renders the volume histogram between the trendline endpoints, automatically projecting the POC and Value Area boundaries forward as reference levels.
Price trading inside the Value Area indicates market consensus and range balance. A clean breakout beyond the Value Area High or Low signals emerging directional momentum, while extended POC and Value Area lines provide natural levels for pullbacks and retest entries.
Practical Use Cases & Setup Walkthrough
Intraday Scalpers (M1–M5): Scalpers draw trendlines across the Asian session range before the London open to map the initial balance area. Testing the Value Area Low during high-volume sessions offers a clear structure for bounce trades back toward the central POC.
Swing Traders (H1–D1): Higher-timeframe traders draw trendlines across multi-week impulse waves on Gold or Indices like US30 and NAS100 to pinpoint where major volume accumulated before the next leg.
Step-by-Step Example (EURUSD M15): After a sharp morning rally, price enters a consolidation phase. The trader draws a trendline across the entire upward impulse leg. The indicator immediately projects the Value Area Low (VAL) and the Point of Control (POC) below current price. As price pulls back into the confluence of the POC and VAL, a bullish rejection candle closes on a completed bar. A trader evaluating this pullback setup looks for a long entry targeting the Value Area High (VAH), placing the stop-loss reference below the lower boundary of the volume range.
Settings & Visual Customization
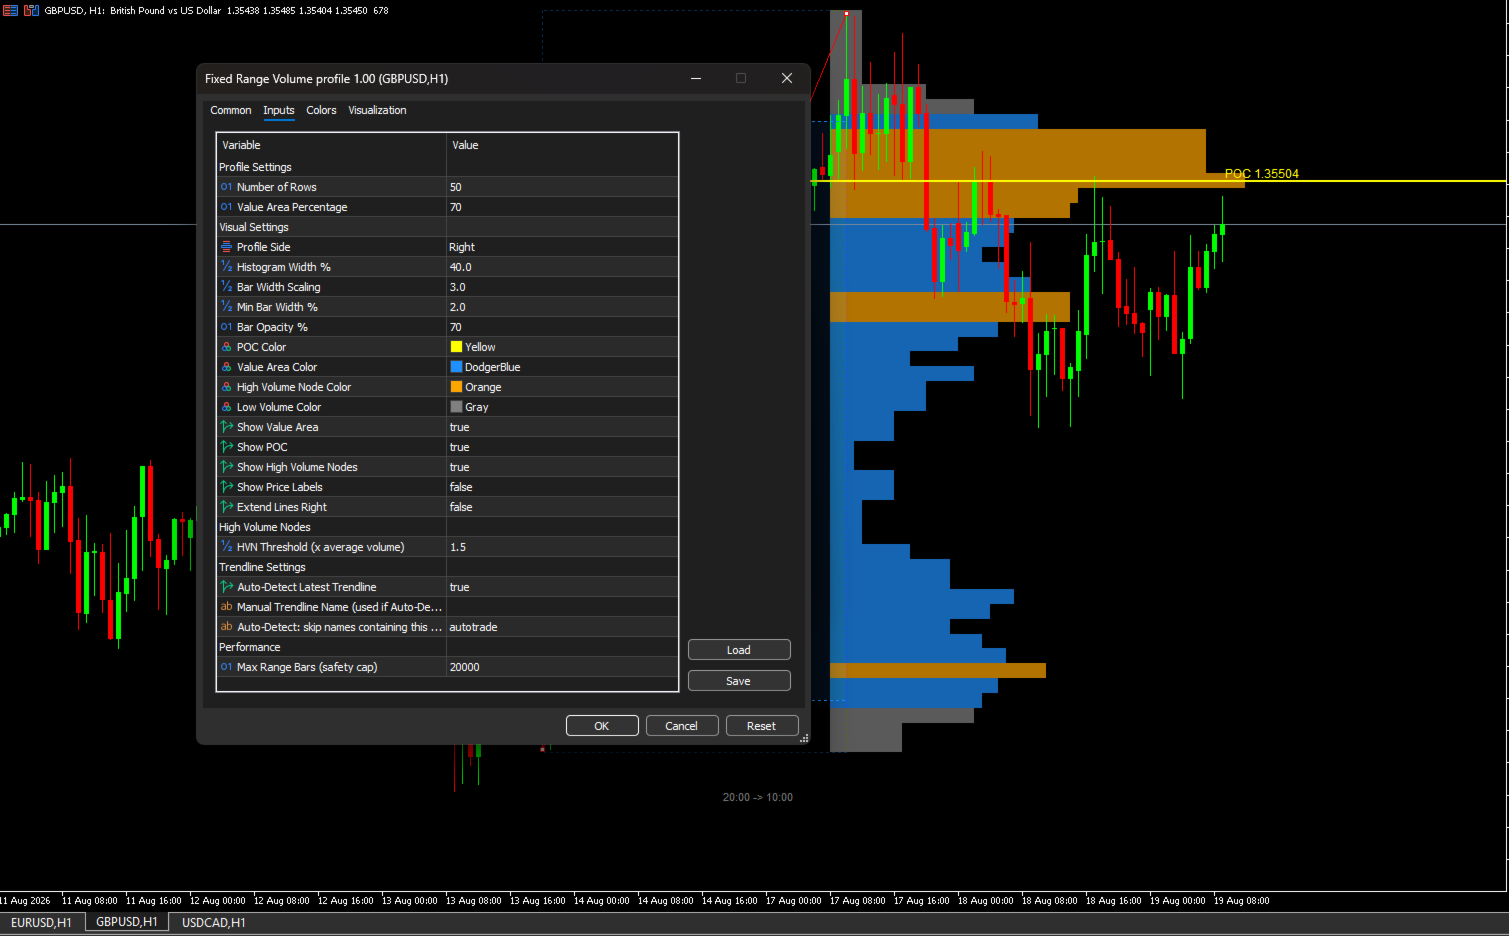
Configuration: Adjust the number of horizontal price rows (bins) from 10 to 200 for custom granularity, set the Value Area percentage (default 70%), and configure the High Volume Node threshold multiplier. Toggle automatic trendline detection or specify a custom object name filter.
Visuals: Align the profile histogram to the left or right side of the selected range, adjust bar width scaling and opacity, and select dedicated colors for the POC, Value Area boundaries, high-volume bars, and low-volume rows. Built-in background adaptation ensures high contrast across dark and light chart templates.
Technical Specifications
Platform: MetaTrader 5 (compatible with all timeframes M1 through MN1).
Calculation Method: Volume distributions are calculated strictly from completed bar price and volume data within the user-defined range. Histograms update in real time as chart trendlines are moved.
Performance: Native MQL5 architecture with configurable maximum historical bar limits to maintain low CPU overhead.
Environment: 100% native code with zero external DLLs, WebRequest dependencies, or third-party service calls.
Disclaimer: This indicator is a technical analysis tool developed for market volume visualization. It does not execute automated trades or guarantee trading profits.