
TitaniumTrend
- Indicadores
- Versão: 2.20
- Atualizado: 12 julho 2026

TitaniumTrend - Ultimate Multi-Timeframe Trend Analyzer
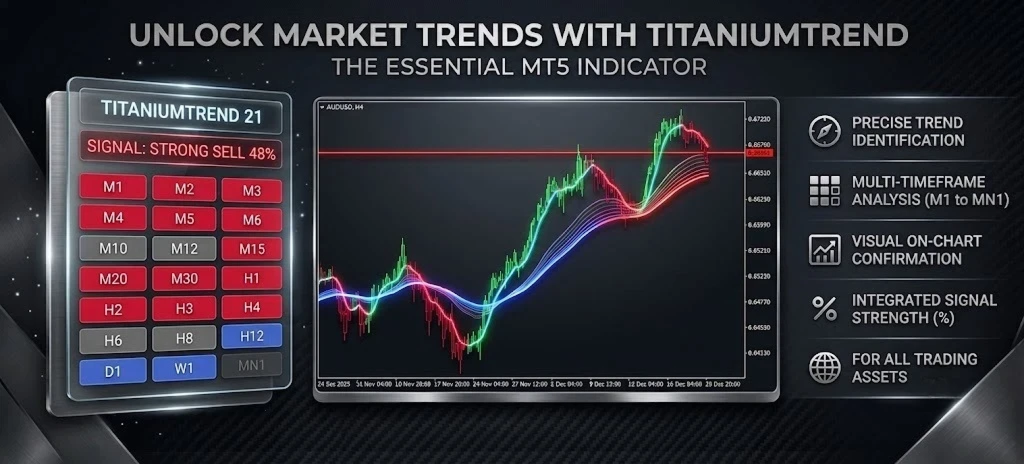
TitaniumTrend is a next-generation indicator designed to provide traders with a definitive edge by analyzing market trends across 21 different timeframes simultaneously. Featuring a stunning, custom-built "Glass Reflection" visual layer and a highly accurate sentiment dashboard, this tool eliminates market noise and reveals the true directional bias of any asset.
Key Features
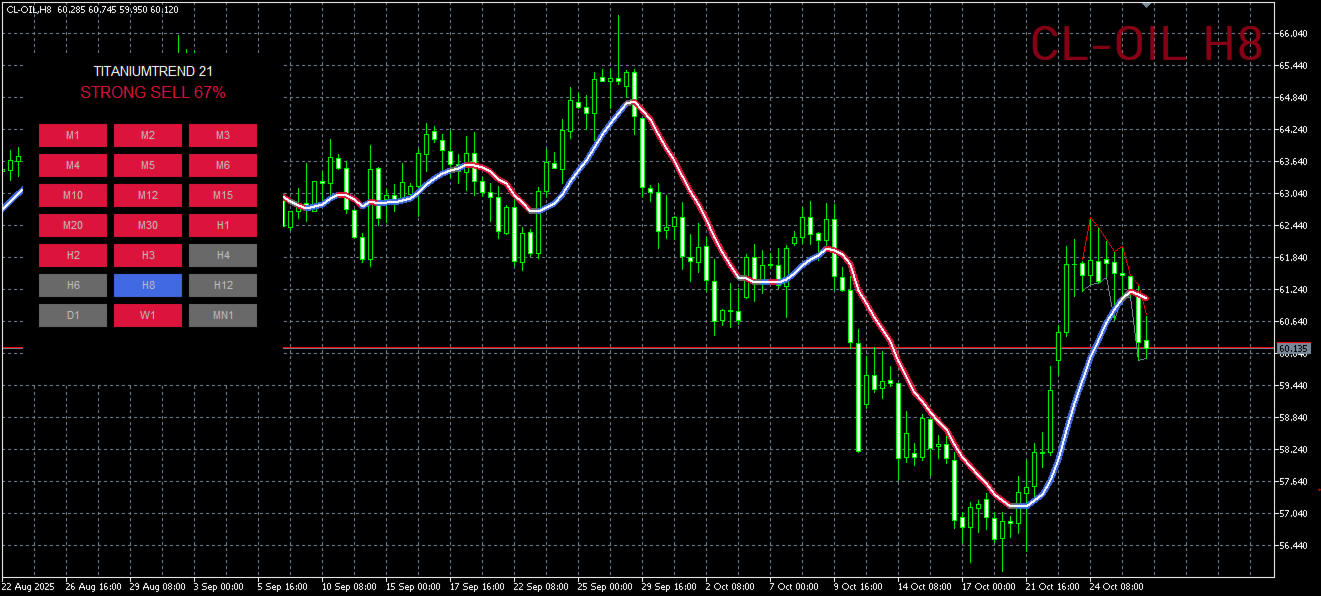
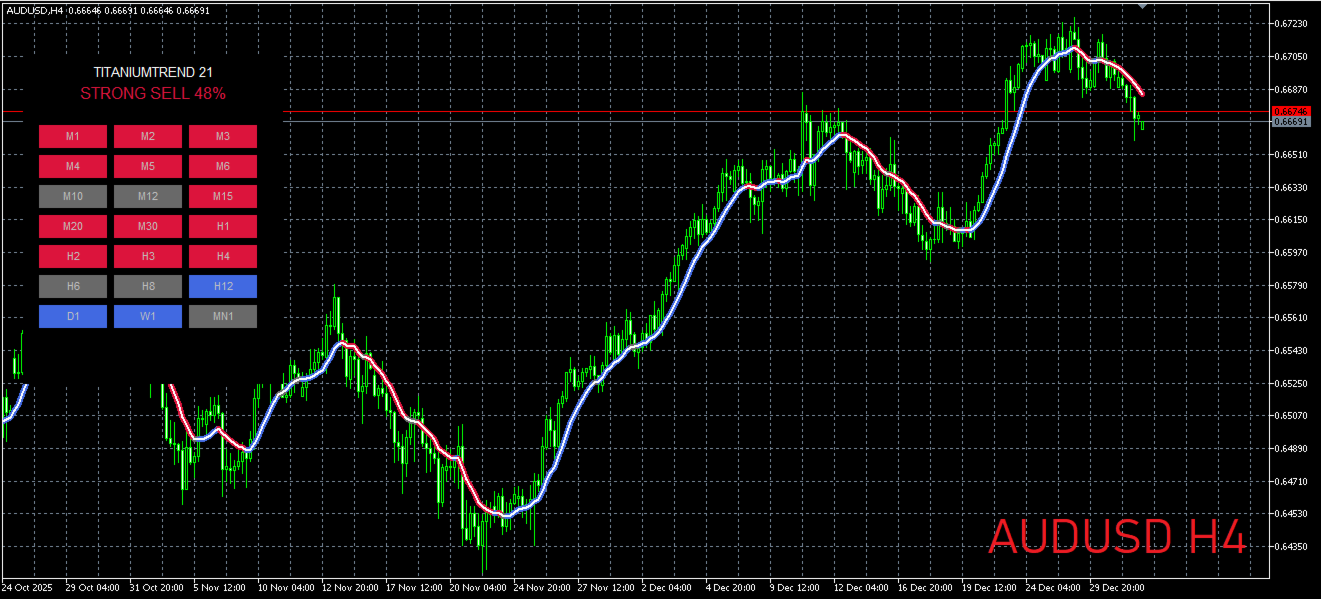
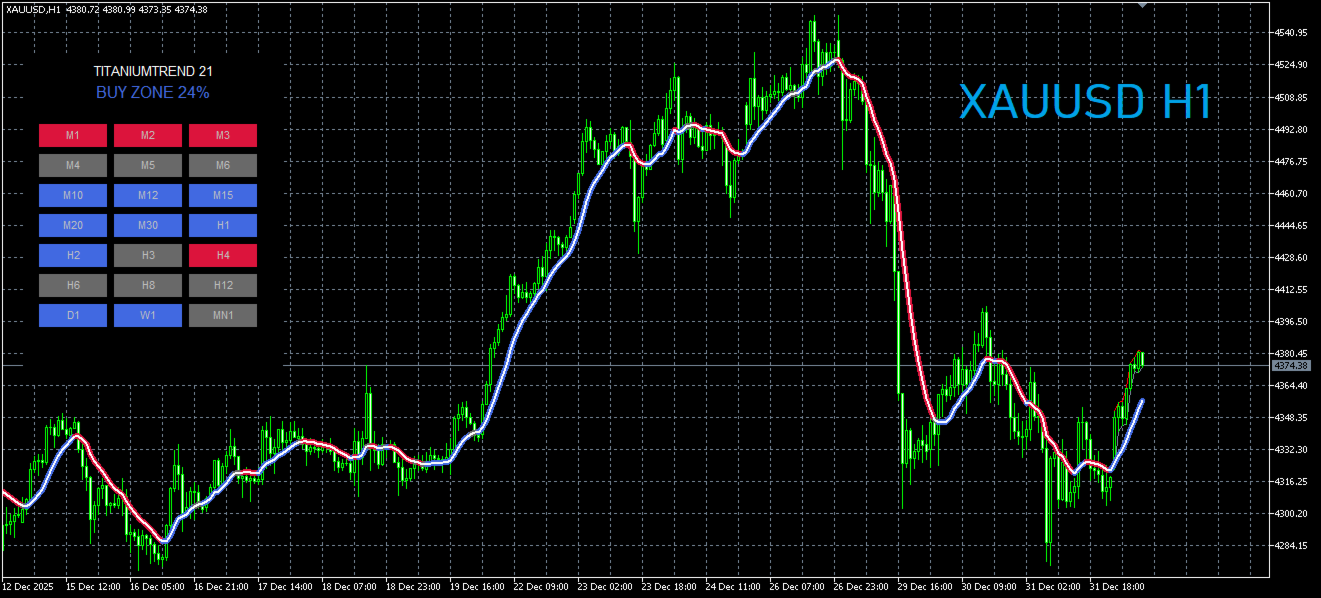
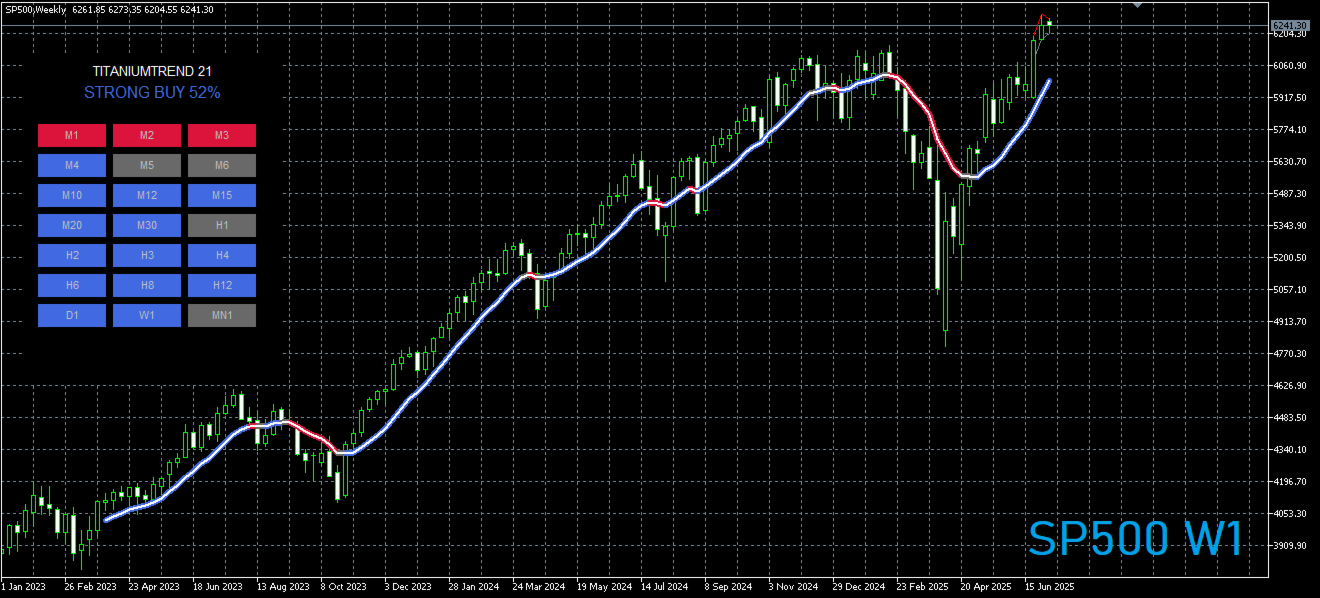
21-Timeframe Analytics: The built-in dashboard continuously scans every available MT5 timeframe (from M1 all the way to MN1). It combines Price Action, EMA (50), and RSI to calculate a definitive trend score for each period.
Smart Sentiment Scoring: The indicator aggregates data from all 21 timeframes to generate a real-time market sentiment percentage. The dashboard will clearly display the current phase: STRONG BUY, BUY ZONE, NEUTRAL, SELL ZONE, or STRONG SELL.
Unique "Glass" Visuals: The main chart indicator uses an innovative two-layer drawing technique. A solid base line identifies the trend direction via color (Buy, Sell, Neutral), overlaid with a dynamic white "Glass Reflection" line for a sleek, modern, and highly readable chart appearance.
5 Advanced Algorithms: Customize the core calculation method of the main trend line to suit your trading style. Choose between SMA, LWMA (Default), EMA, TEMA, and FRAMA.
How to Read the Signals
Main Chart Line:
Royal Blue: Bullish Trend (Price is above the rising indicator line).
Crimson: Bearish Trend (Price is below the falling indicator line).
Dim Gray: Neutral / Consolidating Market.
The Dashboard Grid: Watch the 21 individual boxes. Blue indicates a bullish alignment on that specific timeframe, Red indicates bearish, and Gray indicates a flat market.
Total Sentiment: Look at the top of the dashboard for the final percentage score. A score above 30% suggests a high-probability bullish continuation, while a score below -30% signals strong bearish momentum.
Customizable Inputs
Line Colors & Dashboard: Fully adjust the Buy, Sell, and Neutral colors to match your chart template.
Glass Line Appearance: Change the thickness of the base line and the color of the glass reflection.
Algorithms: Modify the Trend Method, Period (default: 14), and Applied Price.
Multi-TF Analytics: Adjust the RSI period (default: 14) used by the dashboard engine.
Dashboard Specifics: Easily reposition the dashboard anywhere on your screen using X and Y offsets.





































very effective and delvers accurate signals .