Pattern Scanner Fox Wave

Fox Wave Pattern Scanner 

SHORT DESCRIPTION 

Multi-timeframe candlestick pattern scanner: 24 patterns across M5-D1, live dashboard, on-chart markers, one-click TF toggles, alerts.

FULL DESCRIPTION

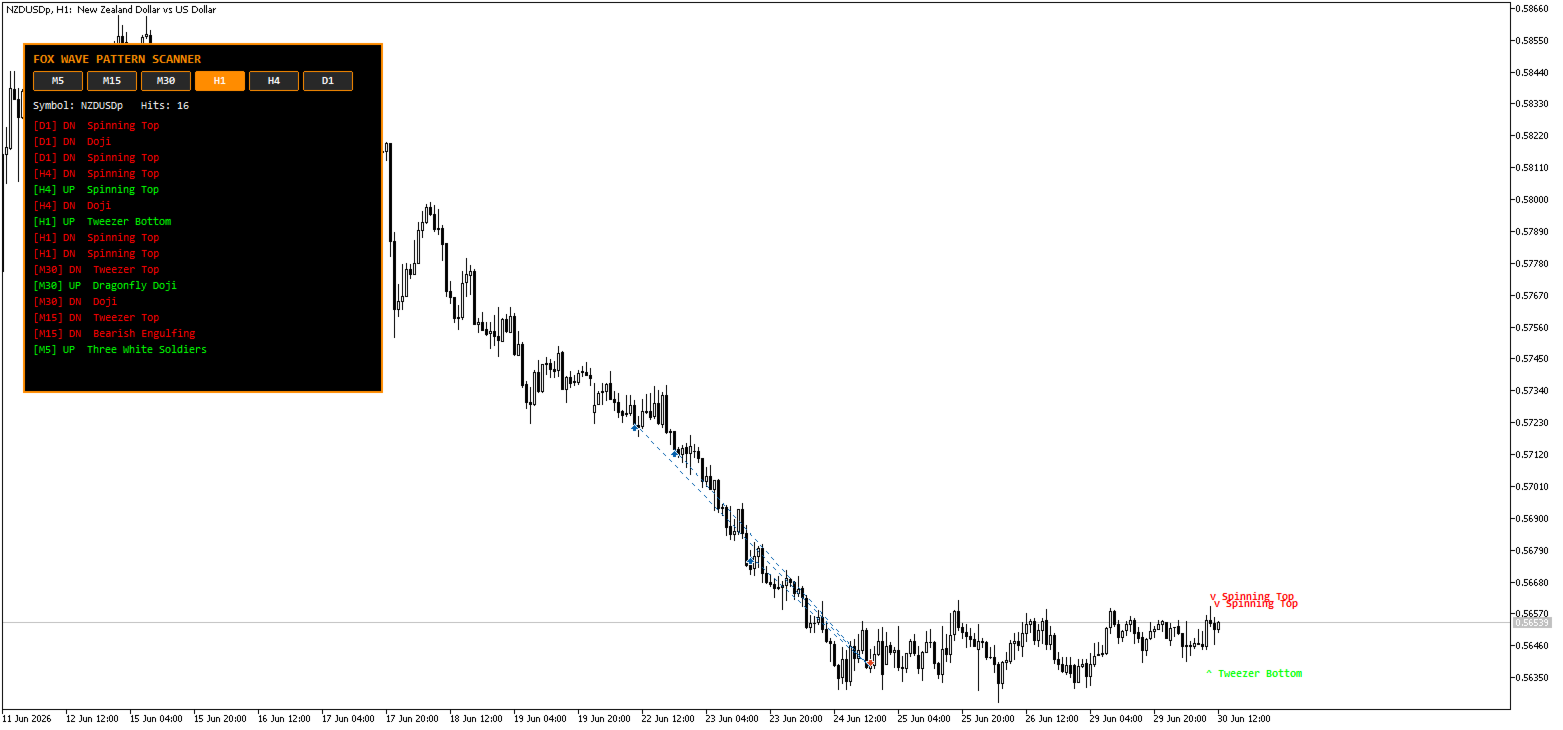
Fox Wave Pattern Scanner continuously reads your chart's symbol across six timeframes at once and reports every candlestick pattern it finds in a clean dark dashboard — so you never have to manually flip through timeframes looking for a setup again.

Instead of scrolling between M5, M15, M30, H1, H4 and D1 hoping to spot a Hammer or an Engulfing pattern before it's too late, the scanner does it for you in the background, refreshing every few seconds and listing each hit with its timeframe and direction.

What it does

► Multi-Timeframe Scanning The indicator scans the current chart symbol on up to six timeframes simultaneously — M5, M15, M30, H1, H4 and D1. Each timeframe can be switched on or off independently, either from the input settings or directly from clickable buttons on the chart itself.

The timeframe that matches your currently open chart is automatically highlighted on the button row in orange, so you always know which one you're looking at versus which ones are being scanned in the background.

► Complete Pattern Library A full library of 24 candlestick patterns is checked on every active timeframe: Doji, Dragonfly Doji, Gravestone Doji, Hammer, Inverted Hammer, Hanging Man, Shooting Star, Bullish Engulfing, Bearish Engulfing, Piercing Line, Dark Cloud Cover, Morning Star, Evening Star, Three White Soldiers, Three Black Crows, Bullish Harami, Bearish Harami, Tweezer Top, Tweezer Bottom, Bullish Marubozu, Bearish Marubozu, Spinning Top, Rising Three Methods and Falling Three Methods.

► On-Chart Markers Patterns detected on the same timeframe as your open chart are plotted directly on the candle where they occurred — a green upward marker for bullish patterns, a red downward marker for bearish ones — so you can see the exact setup without cross-referencing the panel. Patterns from other timeframes remain visible in the dashboard, since plotting a different timeframe's candle on the current chart axis would be misleading.

► One-Click Timeframe Toggles Every scanned timeframe has its own on/off button rendered directly on the chart. Click a button to instantly include or exclude that timeframe from the scan — no need to open the indicator's input settings. The scanner re-evaluates and redraws immediately after every toggle.

► Fox Wave Info Panel A compact dark dashboard lists the most recent pattern hits across all active timeframes, newest first, color-coded green for bullish and red for bearish, along with the symbol name and a live hit counter.

► Built-In Alerts Optional popup alerts and push notifications fire the moment a new pattern is confirmed on a closed candle, with automatic duplicate filtering so the same pattern on the same candle never triggers twice.

Key Features

  • Covers a complete library of 24 candlestick patterns
  • Scans the current symbol across six timeframes simultaneously (M5, M15, M30, H1, H4, D1)
  • Independent on/off toggle for every timeframe, clickable directly on the chart
  • Automatic highlight of whichever timeframe matches your open chart
  • On-chart pattern markers placed precisely on the triggering candle for the active chart timeframe
  • Clean dark dashboard panel with orange highlights and color-coded bullish/bearish hits
  • Configurable number of closed bars checked per timeframe
  • Popup and push notification alerts with automatic duplicate filtering
  • Full color and font customization for the panel
  • Lightweight: runs on a timer in the background without slowing down charting

Inputs Reference

Scan Settings

Parameter Default Description
InpUseM5 true Include M5 in the scan
InpUseM15 true Include M15 in the scan
InpUseM30 true Include M30 in the scan
InpUseH1 true Include H1 in the scan
InpUseH4 true Include H4 in the scan
InpUseD1 true Include D1 in the scan
InpBarsBack 3 Number of closed bars checked per timeframe
InpAlertsOn true Enable popup alerts on new pattern detection
InpPushOn false Enable push notifications to mobile app

Panel Settings

Parameter Default Description
InpPanelX 20 Horizontal offset from chart edge
InpPanelY 40 Vertical offset from chart edge
InpBgColor Black Panel background color
InpBorderColor Orange Panel border and active-timeframe highlight color
InpTextColor White Smoke General panel text color
InpBullColor Lime Color for bullish pattern hits and markers
InpBearColor Red Color for bearish pattern hits and markers
InpFont Consolas Panel and marker font

How to set up push notifications

  1. Open MetaTrader 5 on your mobile device
  2. Go to Settings → Messages and copy your MetaQuotes ID
  3. In MT5 desktop: Tools → Options → Notifications
  4. Paste your MetaQuotes ID and enable notifications
  5. Set InpPushOn = true in the indicator inputs

A note on methodology

Candlestick pattern definitions (Hammer, Engulfing, Harami, Marubozu and others) are widely taught but not perfectly standardized — different sources apply slightly different body and wick ratio thresholds. This indicator uses commonly accepted ratio-based definitions for each pattern. As with any technical tool, pattern hits should be used as part of a complete trading plan and confirmed with context such as trend, support/resistance or volume, not as standalone signals.

Who is it for?

  • Price action traders who time entries and exits around candlestick formations
  • Scalpers and swing traders who need to monitor several timeframes at once without manually switching charts
  • Multi-timeframe traders who want top-down confirmation before acting on a signal
  • Anyone who wants automated candlestick recognition instead of scanning charts by eye

Compatibility

  • Platform: MetaTrader 5
  • Works on all symbols: Forex pairs, indices, commodities, crypto, metals
  • Works on any chart timeframe
  • No DLL imports required


Produtos recomendados
Scalping Flash X
Syamsurizal Dimjati
SCALPFLASH-X Where Fibonacci Precision Meets RSI Intelligence. Next-gen trading system combining Adaptive Fibonacci Pivots, RSI Heat Mapping, and Smart Candle Analytics. Detect market dominance, momentum shifts, and reversal zones in real time across multiple timeframes. Institutional accuracy, retail simplicity — built for speed, clarity, and precision. Advanced Multi-Timeframe Fibonacci & RSI-Driven Market Intelligence System ScalpFlash-X — A next-generation trading system combining Fibonacc
MACDivergence MTF MT5
Pavel Zamoshnikov
4 (5)
Advanced ideas of the popular MACD indicator: It detects and displays classic and reverse divergences (two methods of detecting divergences). It uses different color to highlight an uptrend and a downtrend. Two methods of determining a trend: а) MACD crosses the 0 level (classic signal); б) MACD crosses its own average (early signal). This is a multi-timeframe indicator: it can display MACD data from other timeframes. Two methods of drawing: classic histogram and line. It generates sound and vis
Histograma de Rendimento L&S Caicai Aviso Importante: Este indicador é uma ferramenta integrante do robô automatizado EA Caicai Long and Short Pair Trading . Este indicador exibe visualmente o desvio percentual (Yield %) do spread atual de um par em relação à sua própria média histórica. É excelente para visualizar rapidamente o potencial financeiro bruto de uma distorção. Principais Funcionalidades: Visualização em Percentual: Entenda facilmente o tamanho da distorção em termos percentuais. Múl
Indicador Crypto_Forex "Cruzamento de Médias Móveis HTF" para MT5. - Aprimore seus métodos de negociação com o poderoso indicador Cruzamento de Médias Móveis HTF para MT5. HTF significa - período de tempo mais longo. - Este indicador é excelente para traders de tendências com entradas de Ação de Preço. - Ele permite anexar Médias Móveis Rápidas e Lentas de períodos de tempo mais longos ao seu gráfico atual --> este é um método profissional. - O Cruzamento de Médias Móveis HTF possui alertas in
Multiple Timeframe MACD indicator. This indicator was built for making multiple timeframe analysis possible in MT5 using MACD Indicator. MACD Indicator traditionally shows two lines and one histogram. MACD Line(Yellow) is calculated by subtracting 12period EMA(fast) from 26period EMA (slow). Signal Line(Blue) is created by a 9period EMA from MACD Line. Histogram is just the difference between MACD and Signal lines. Histogram is colored based on the difference between its value and the previous h
Macd Pro Alpha Candles
Aiman Saeed Salem Dahbag
MACD Alpha Candles – Advanced MACD Visualization Using OHLC Candlestick Format MACD Alpha Candles is an advanced indicator that reconstructs the traditional MACD in an innovative way by transforming MACD movement into dynamic OHLC candlesticks or a MACD 2 Line display in a separate window, giving traders a deeper view of momentum behavior and market direction. The indicator calculates MACD using the difference of moving averages applied to Open, High, Low, and Close prices , not only the closing
O indicador SMC Venom Model BPR é uma ferramenta profissional para os traders que trabalham com o conceito Smart Money (SMC). Identifica automaticamente dois padrões principais no gráfico de preços: FVG   (Fair Value Gap) é uma combinação de três velas, em que existe um gap entre a primeira e a terceira velas. Forma uma zona entre níveis onde não há suporte de volume, o que geralmente leva a uma correção de preço. BPR   (Balanced Price Range) é uma combinação de dois padrões FVG que formam uma
Max Min Delta Indicator - Market Volume Imbalance Analysis Gain Deeper Insights into Market Volume Imbalance with Delta Analysis What is the Max Min Delta Indicator? The Max Min Delta Indicator is a powerful market volume analysis tool that visually represents maximum and minimum delta values using a histogram. It helps traders identify market strength, weakness, absorption, and aggressive buying/selling activity with precision. Key Features Histogram Visualization: Displays Max Delta (Green) an
MTF RSI for MT5
Taras Slobodyanik
Multi-timeframe indicator Relative Strength Index displays information simultaneously from different periods in one subwindow of the chart. Parameters Period of averaging — averaging period for the RSI calculation. Type of price — price used. Timeframes for RSI — list of periods, separated by a space or comma or semicolon. Number of bars for each period — the number of bars displayed for each period. Sort periods — sort periods if they are listed in no particular order. Current period first — d
O indicador DYJ BoS identifica e marca automaticamente os principais elementos das alterações na estrutura do mercado, incluindo: Ruptura da Estrutura (BoS): ocorre quando o preço faz um grande movimento, rompendo o ponto anterior da estrutura. Marca possíveis linhas de tendência de alta e de baixa (UP e DN, ou seja, novos máximos e novos mínimos consecutivos) e, quando o preço rompe essas linhas, marca-as com setas vermelhas (de baixa) e verdes (de alta) . Um BoS ocorre normalmente quando o
Provided Trend is a complex signal formation indicator. As a result of the work of internal algorithms, you can see only three types of signals on your chart. The first is a buy signal, the second is a sell signal, and the third is a market exit signal. Options: CalcFlatSlow - The first parameter that controls the main function of splitting the price chart into waves. CalcFlatFast - The second parameter that controls the main function of splitting the price chart into waves. CalcFlatAvg - Para
这是一个基于前一个交易日的最高价、最低价和收盘价来计算的枢轴点指标,具体公式如下: 计算前一日的 Pivot Point (枢轴点): Pivot = (High + Low + Close) / 3 计算 Resistance 1 (R1) 、 Support 1 (S1) ​ 等: R1 = (2 * Pivot) - Low S1 = (2 * Pivot) - High R2 = Pivot + (High - Low) S2 = Pivot - (High - Low) 与市面上其他的枢轴点指标相比,该指标主要有以下4个特点: 1、可以修改交易日的开始时间; 2、可以设定支撑压力线的颜色; 3、可以设定是否显示各个支撑压力线对应的价格; 4、可以设定天数用以显示枢轴点的历史记录; 开发这个指标的最初目的是为了解决设定交易日开始时间的问题,接下来会进一步说明。基于计算公式,我们需要获得上一个交易日的最高价、最低价和收盘价,在夏令时,北京时间6点是开市时间,大多数交易平台服务器的0点对应的是北京时间的6点,但是香港的服务器6点才是对应的是北京时间的6点。如果你有多个平台,且存在
The Antique Trend Indicator is a revolutionary trend trading and filtering solution with all the important features of a trend tool built into one tool! The Antique Trend indicator is good for any trader, suitable for any trader both for Forex and binary options. There is no need to configure anything, everything has been perfected by time and experience, it works great during flats and trends. The Antique Trend indicator is a tool for technical analysis of financial markets, reflecting curren
Introducing the Bollinger Flipper Indicator – Your Ultimate Trading Edge!   Are you tired of second-guessing your entries and exits? The Bollinger Flipper Indicator is here to flip the game in your favor.   Built with the power of Bollinger Bands + Level 3 Power System + ZigZag Fractals, this advanced tool is designed to spot high-probability buy & sell signals with precision. SPECIAL BONUS (VALID TILL JUNE 2026)- OUR DAILY SCALPER EA for BTCUSD and VIX75 •································
SPECIAL LAUNCH OFFER: $30 (1-Month Rent) Limited time offer to build our community and gather feedback! AmbM GOLD Institutional Scalper A high-precision M5 algorithm for XAUUSD (Gold) , engineered to trade exclusively at Institutional Liquidity Levels ($5/$10 psychological marks). PERFORMANCE DATA (BUY ONLY) • Win Rate: 87.09%. • Safe Growth: +$4,113 profit on $10k (13.75% Max Drawdown). • Extreme Stress Test: Successfully generated +$22,997 in a 5-year stress test (2020-2026), proving
RBreaker
Zhong Long Wu
RBreaker Gold Indicators é uma estratégia de negociação intradiária de curto prazo para futuros de ouro que combina duas abordagens: o seguimento de tendência e as reversões intradiárias. Ela permite capturar lucros durante mercados em tendência e também realizar lucros oportunamente e operar na direção oposta quando o mercado se reverte. Esta estratégia foi classificada por 15 anos consecutivos entre as dez estratégias de negociação mais lucrativas pela revista americana Futures Truth. Ela pos
"GoldenSwing" is a comprehensive MetaTrader 5 indicator meticulously crafted by Southern Star Trading, designed to enhance your trading strategies with precision swing high and swing low identification. Harnessing the power of swing analysis, this indicator provides traders with invaluable insights into market reversals and trend continuations, enabling them to make informed trading decisions. With its advanced algorithm, GoldenSwing detects significant swing highs and swing lows in real-time,
Nosso indicador   Basic Support and Resistance   é a solução necessária para aumentar sua análise técnica.Este indicador permite que você forneça níveis de suporte e resistência no gráfico/   versão MT4 grátis Recursos Integração dos níveis de Fibonacci: Com a opção de exibir níveis de Fibonacci, juntamente com os níveis de suporte e resistência, nosso indicador fornece uma visão ainda mais profunda do comportamento do mercado e possíveis áreas de reversão. Otimização de desempenho: Com a opçã
Este indicador encontra os padrões de retração AB = CD. O padrão AB = CD Retracement é uma estrutura de preço de 4 pontos em que o segmento de preço inicial é parcialmente retraído e seguido por um movimento equidistante da conclusão da retirada, e é a base básica para todos os padrões harmônicos. [ Guia de instalação | Guia de atualização | Solução de problemas | FAQ | Todos os produtos ] Tamanhos de padrão personalizáveis Proporções AC e BD personalizáveis Períodos de interrupção personali
**   All Symbols   x   All Timeframes   scan just by pressing scanner button ** Discount: The price is $50$, But now it is just $39, Limited time offer is active. *** Contact me  to send you instruction and add you in "Trend Reversal group" for sharing or seeing experiences with other users. Introduction: Trendlines are the most famous technical analysis in trading . Trendlines continually form on the charts of markets across all the different timeframes providing huge opportunities for traders
The Trend Duration Forecast MT5 indicator is designed to estimate the probable lifespan of a bullish or bearish trend. Using a Hull Moving Average (HMA) to detect directional shifts, it tracks the duration of each historical trend and calculates an average to forecast how long the current trend is statistically likely to continue. This allows traders to visualize both real-time trend strength and potential exhaustion zones with exceptional clarity. KEY FEATURES Dynamic Trend Detection:   Utiliz
Introduction The Wave Trend Oscillator Indicator for MT5 is one of the well known indicators in the market, helping traders find strong entry points into the market. Like any other MetaTrader 5 indicator , it can produce both good and bad signals, but the number of accurate buy/sell signals is significantly higher than the weak ones. This makes it a powerful tool for improving your forex trading strategy , whether you are a beginner or an advanced trader. How does this indicator work? This indic
Pivot Points Indicator – a fast, reliable, and fully customizable pivot detection for MetaTrader 5. This indicator uses MetaTrader’s native iHighest and iLowest functions to identify pivot highs and lows by scanning for the highest and lowest prices within a user-defined window of bars. A pivot is confirmed only when the current bar is the absolute maximum or minimum within the selected range, ensuring accurate and timely signals based on robust built-in logic. Key Features No Repainting : Onc
FREE
Trade history
Andriy Konovalov
5 (2)
The indicator plots charts of profit taken at the Close of candles for closed (or partially closed) long and short positions individually. The indicator allows to filter deals by the current symbol, specified expert ID (magic number) and the presence (absence) of a substring in a deal comment, to set the start time and the periodicity of profit reset (daily, weekly or monthly) to calculate the profit chart. The indicator also displays the floating (not fixed) profit of the opened positions at th
Opulence Levels
Tokunbo Greatpath Adebowale
Opulence Levels is a precision-engineered, non-repainting indicator that automatically identifies the most critical price levels on any chart — the exact zones where smart money reacts, liquidity is hunted, and the next big move is born. Powered by swing-based structure analysis and multi-timeframe intelligence, Opulence Levels cuts through chart noise to deliver clean, high-probability BUY LEVELS and SELL LEVELS with surgical accuracy. No guesswork. No repainting. Just levels that matter. What
Noize Absorption Index - is the manual trading system that measures the difference of pressure between bears forces and bulls forces. Green line - is a noize free index that showing curent situation. Zero value of index shows totally choppy/flat market.Values above zero level shows how powerfull bullish wave is and values below zero measures bearish forces.Up arrow appears on bearish market when it's ready to reverse, dn arrow appears on weak bullish market, as a result of reverse expectation.
Paula Bollinger Bands Strategy
Francisco Gomes Da Silva
3.67 (3)
Setup da Paula A estrategia da Paula foi criada por Joe Ross e muito difundida aqui no Brasil por Rodrigo Cohen Indicador Para você não precisar ficar procurando onde seriam as entradas dela no grafico eu criei esse indicador que mostra com uma seta onde seriam as entradas da Paula. A entrada da Paula A entrada é configurada quando o preço de um candle fecha fora e no candle seguinte fecha dentro, então deve operar na abertura do proximo candle. Comente Me deixe saber se esse indicador que fiz s
FREE
Novo painel SMC Pro com estilo Dark UI. Monitorize a força da tendência de M1 a D1 num relance! PRINCIPAIS RECURSOS: Live MTF Bias Scanner: Um painel futurista que analisa a direção da tendência em tempo real em 7 períodos (M1, M5, M15, M30, H1, H4, D1). Nunca mais entre contra a tendência maioritária! Estrutura de Mercado Automática (BOS e CHoCH): O nosso algoritmo inteligente distingue entre rompimentos de estrutura para continuação da tendência (Rompimento de Estrutura) e alertas
Best SAR MT5
Ashkan Hazegh Nikrou
4.33 (3)
Descrição :  estamos felizes em apresentar nosso novo indicador gratuito baseado em um dos indicadores profissionais e populares no mercado forex (PSAR) este indicador é uma nova modificação no indicador SAR parabólico original, no indicador pro SAR você pode ver o cruzamento entre os pontos e o gráfico de preços, este crossover não é sinal, mas fala sobre o potencial de fim de movimento, você pode começar a comprar pelo novo ponto azul e colocar o stop loss um atr antes do primeiro ponto azul
FREE
Was: $249  Now: $99   Market Profile defines a number of day types that can help the trader to determine market behaviour. A key feature is the Value Area, representing the range of price action where 70% of trading took place. Understanding the Value Area can give traders valuable insight into market direction and establish the higher odds trade. It is an excellent addition to any system you may be using. Inspired by Jim Dalton’s book “Mind Over Markets”, this indicator is designed to suit the
Os compradores deste produto também adquirem
Neuro Poseidon MT5
Daria Rezueva
4.79 (53)
Neuro Poseidon is a new indicator by Daria Rezueva. It combines precise trading signals with adaptive TP/SL levels - creating best possible trades as a result! Message me and get  Neuro Poseidon Assistant  as a gift to automize your trading process! What makes it stand out? 1. Proven profitability on all assets and timeframes 2. Only confirmed BUY and SELL signals present on the chart 3. Adaptive TP & SL levels generated by the software for each trade 4. Easy to understand - suitable for al
SuperScalp Pro
Van Minh Nguyen
4.68 (28)
SuperScalp Pro – Sistema Profissional de Scalping com Confluência Multicamadas O SuperScalp Pro é um sistema profissional de trading com confluência multicamadas, desenvolvido para identificar oportunidades de negociação de alta probabilidade através de uma confirmação inteligente baseada em múltiplos fatores. Ao integrar Supertrend, VWAP, EMA, RSI, ADX, análise de volume, Bandas de Bollinger e Divergência MACD, o sistema filtra configurações de baixa qualidade, reduz falsos rompimentos e melhor
M1 Quantum MT5
Hamed Dehgani
5 (5)
Sinais de Trading ao Vivo usando o M1 Quantum: Sinal Plano de Preços: Preço Atual: $149 (Oferta para primeiros usuários) Próximo preço planejado: $169 Preço de varejo planejado: $299 Nota do Desenvolvedor: Após a compra, entre em contato comigo para receber o arquivo de configuração (Set File) mais recente , recomendações de uso e um convite para o Grupo VIP de Suporte , onde você poderá interagir com outros usuários do M1 Quantum. M1 Quantum é um sistema profissional de negociação para M1 que
Vamos ser honestos primeiro. Nenhum indicador sozinho vai te tornar lucrativo. Se alguém te disser o contrário, está te vendendo um sonho. Qualquer indicador que mostre setas perfeitas de compra/venda pode ser feito para parecer impecável — basta dar zoom na parte certa da história e tirar um print das operações vencedoras. Nós não fazemos isso.  SMC Intraday Formula é uma ferramenta. Ela lê a estrutura do mercado para você, identifica as zonas de maior probabilidade de preço e mostra exatament
Entry In The Zone and SMC Multi Timeframe is a real-time 2-in-1 market analysis tool that combines market structure analysis and a No Repaint BUY / SELL signal system into a single indicator, built on Smart Money Concepts (SMC) — a widely adopted framework used by professional traders to understand market structure. This indicator helps you see the market more clearly, make decisions based on structure rather than guesswork, and focus on high-probability zones where price is more likely to react
Este produto foi atualizado para o mercado de 2026 e otimizado para as versões mais recentes do MT5. AVISO DE ATUALIZAÇÃO DE PREÇO: Smart Trend Trading System está atualmente disponível por $99 . O preço aumentará para $199 após as próximas 30 compras . OFERTA ESPECIAL: Após comprar o Smart Trend Trading System, envie-me uma mensagem privada para receber o Smart Universal EA GRÁTIS e transformar seus sinais do Smart Trend em operações automatizadas. Smart Trend Trading System é um sistema de tr
Divergence Bomber
Ihor Otkydach
4.9 (92)
Cada comprador deste indicador recebe adicionalmente, e de forma gratuita: A ferramenta exclusiva "Bomber Utility", que acompanha automaticamente cada operação, define os níveis de Stop Loss e Take Profit e fecha operações de acordo com as regras da estratégia; Arquivos de configuração (set files) para ajustar o indicador em diferentes ativos; Set files para configurar o Bomber Utility nos modos: "Risco Mínimo", "Risco Balanceado" e "Estratégia de Espera"; Um vídeo tutorial passo a passo que aju
Trend Sniper X
Sarvarbek Abduvoxobov
5 (2)
Trend Sniper X é um indicador de acompanhamento de tendência multi-timeframe para MetaTrader 5 que ajuda os traders a identificar a direção da tendência e potenciais pontos de reversão com clareza e precisão. Informações de preço: O preço atual é promocional e está sujeito a alterações à medida que futuras atualizações e novos recursos forem lançados. Canal Code2Profit   Domine o mercado com análise multi-timeframe!   Trend Sniper X: Análise sistemática de mercado e atualizações   Especificações
Gann Made Easy   é um sistema de negociação Forex profissional e fácil de usar, baseado nos melhores princípios de negociação usando a teoria do sr. W. D. Gann. O indicador fornece sinais precisos de COMPRA e VENDA, incluindo níveis de Stop Loss e Take Profit. Você pode negociar mesmo em movimento usando notificações PUSH. Entre em contato comigo após a compra para receber instruções de negociação e ótimos indicadores extras gratuitamente! Provavelmente você já ouviu muitas vezes sobre os método
Power Candles MT5
Daniel Stein
5 (8)
Power Candles V3 - Indicador de força com auto-otimização O Power Candles V3 transforma a força da moeda e do instrumento num plano de negociação prático em todos os gráficos aos quais está associado. Em vez de se limitar a colorir as velas, executa uma otimização automática em tempo real em segundo plano e apresenta-lhe os melhores valores de Stop Loss, Take Profit e limiar de sinal para o símbolo em questão. Basta um clique para o adotar na negociação em tempo real — as linhas de entrada, Stop
O UZFX {SSS} Scalping Smart Signals v4.0 MT5 é um indicador de negociação de alto desempenho, sem repintura, concebido para scalpers, day traders e swing traders que exigem sinais precisos e em tempo real em mercados em rápida evolução. Desenvolvido pela (UZFX-LABS), este indicador combina a análise da ação do preço, a confirmação de tendências e a filtragem inteligente para gerar sinais de compra e venda de alta probabilidade, sinais de alerta e oportunidades de continuação de tendências em tod
O indicador destaca as zonas onde há declaração de interesse no mercado e, em seguida, mostra a zona de acumulação de ordens . Ele funciona como um livro de ofertas em escala ampliada . Este é o indicador para o dinheiro grande . Seu desempenho é excepcional. Qualquer interesse que existir no mercado, você verá com clareza . (Esta é uma versão totalmente reescrita e automatizada — não é mais necessário fazer análise manual .) A Velocidade de Transação é um indicador de conceito novo que mostra o
Gem SIGNAL
Shengzu Zhong
5 (1)
GEM Signal Pro GEM Signal Pro é um indicador seguidor de tendência para MetaTrader 5, desenvolvido para traders que desejam sinais mais claros, setups mais estruturados e uma gestão de risco mais prática diretamente no gráfico. Em vez de mostrar apenas uma seta simples, o GEM Signal Pro ajuda a apresentar a ideia completa da operação de forma mais clara e fácil de entender. Quando as condições são confirmadas, o indicador pode mostrar o preço de entrada, o stop loss e os alvos de take profit no
Axiom Matrix
Issam Kassas
5 (1)
AXIOM MATRIX MT5 PREÇO DE LANÇAMENTO: $99 Axiom Matrix está disponível pelo preço de lançamento de $99. O preço aumentará para $199 após as primeiras 30 compras. Axiom Matrix é um scanner de mercado profissional multissímbolo e multitimeframe, além de um painel de decisão para MetaTrader 5. Ele escaneia o seu Market Watch, analisa múltiplos timeframes, lê múltiplos motores de evidência, compara as oportunidades mais fortes e mostra a melhor condição BUY, SELL, WAIT ou bloqueada dentro de um únic
Atomic Analyst MT5
Issam Kassas
4.26 (39)
Este produto foi atualizado para o mercado de 2026 e otimizado para as versões mais recentes do MT5. AVISO DE ATUALIZAÇÃO DE PREÇO: Atomic Analyst está atualmente disponível por $99 . O preço aumentará para $199 após as próximas 30 compras . OFERTA ESPECIAL: Após comprar o Atomic Analyst, envie-me uma mensagem privada para receber o Smart Universal EA GRÁTIS e transformar seus sinais do Atomic Analyst em operações automatizadas. Atomic Analyst é um indicador de trading de Price Action sem repa
Apresentando       Quantum Breakout PRO   , o inovador Indicador MQL5 que está transformando a maneira como você negocia Breakout Zones! Desenvolvido por uma equipe de traders experientes com experiência comercial de mais de 13 anos,       Quantum Breakout PRO       foi projetado para impulsionar sua jornada comercial a novos patamares com sua estratégia de zona de fuga inovadora e dinâmica. O Quantum Breakout Indicator lhe dará setas de sinal em zonas de breakout com 5 zonas-alvo de lucro e su
ARIPoint
Temirlan Kdyrkhan
1 (1)
ARIPoint is a powerful trading companion designed to generate high-probability entry signals with dynamic TP/SL/DP levels based on volatility. Built-in performance tracking shows win/loss stats, PP1/PP2 hits, and success rates all updated live. Key Features: Buy/Sell signals with adaptive volatility bands Real-time TP/SL/DP levels based on ATR Built-in MA Filter with optional ATR/StdDev volatility Performance stats panel (Success, Profit/Loss, PP1/PP2) Alerts via popup, sound, push, or email Cu
The Oracle Pro
Ottaviano De Cicco
The Oracle Pro: Motor de Viés Multi-Timeframe Sintético para MT5 ️ Oferta de Lançamento de Verão — Adquira o The Oracle Pro por USD 199 (primeiros compradores). O preço sobe com a tração; preço final USD 399. The Oracle Pro é um motor de viés multi-timeframe premium para MetaTrader 5, criado para traders exigentes e profissionais. Responde com disciplina a uma pergunta: qual é o viés direcional em cada timeframe agora, qual a sua força e quanto os timeframes concordam? Tudo é calculado apenas e
Quantum TrendPulse
Bogdan Ion Puscasu
5 (25)
Apresentando   Quantum TrendPulse   , a ferramenta de negociação definitiva que combina o poder do   SuperTrend   ,   RSI   e   Stochastic   em um indicador abrangente para maximizar seu potencial de negociação. Projetado para traders que buscam precisão e eficiência, este indicador ajuda você a identificar tendências de mercado, mudanças de momentum e pontos de entrada e saída ideais com confiança. Principais características: Integração SuperTrend:   siga facilmente a tendência predominante do
FX Trend MT5 NG
Daniel Stein
5 (6)
FX Trend NG: A Nova Geração de Inteligência de Tendência Multi-Mercado Visão Geral FX Trend NG é uma ferramenta profissional de análise de tendências e monitoramento de mercado em múltiplos períodos de tempo. Permite compreender a estrutura completa do mercado em segundos. Em vez de alternar entre vários gráficos, você visualiza instantaneamente quais ativos estão em tendência, onde o momentum está enfraquecendo e onde existe alinhamento forte entre diferentes timeframes. Oferta de Lançamento
FX Power MT5 NG
Daniel Stein
5 (33)
FX Power: Analise a Força das Moedas para Decisões de Negociação Mais Inteligentes Visão Geral FX Power é a sua ferramenta essencial para compreender a força real das principais moedas e do ouro em quaisquer condições de mercado. Identificando moedas fortes para comprar e fracas para vender, FX Power simplifica as decisões de negociação e revela oportunidades de alta probabilidade. Quer você prefira seguir tendências ou antecipar reversões usando valores extremos de Delta, esta ferramenta adap
Current event:  https://c.mql5.com/1/326/A2SR2025_NoMusic.gif A2SR para MT5 Indicador: Oferta e Procura (S/R) Atual Automatizada. + Instrumentos de Negociação. Product description in English here. --   Guidance   : -- at   https://www.mql5.com/en/blogs/post/734748/page4#comment_16532516 -- and  https://www.mql5.com/en/users/yohana/blog Poderoso, Genuíno e que Poupa Tempo para Decisões de Negociação Mais Inteligentes + Objetos Compatíveis com EA. Principais Vantagens Níveis de SR Antecipado
Azimuth Pro
Ottaviano De Cicco
5 (7)
Azimuth Pro V2: Estrutura Fractal Sintética e Entradas Confirmadas para MT5 Visão geral Azimuth Pro é um indicador de estrutura swing multinível da Merkava Labs . Quatro camadas de swing aninhadas, VWAP ancorado em swings, detecção de padrões ABC, filtragem estrutural de três timeframes e entradas confirmadas em barra fechada — um gráfico, um fluxo de trabalho dos micro-swings aos macro-ciclos. Este não é um produto de sinais cegos. É um fluxo de trabalho baseado em estrutura para traders que v
Btmm state engine pro
Garry James Goodchild
5 (5)
BTMM State Engine Pro is a MetaTrader 5 indicator for traders who use the Beat The Market Maker approach: Asian session context, kill zone timing, level progression, peak formation detection, and a multi-pair scanner from a single chart. It combines cycle state logic with a built-in scanner dashboard so you do not need the same tool on many charts at once. What it does Draws the Asian session range; session times can follow broker server offset or be set in inputs. Tracks level progression (L
Quant Direction MT5
Georgios Kalomoiropoulos
Quant Direction é uma ferramenta de análise de mercado tridimensional. Ela oferece uma análise de mercado totalmente objetiva, baseada em algoritmos, que calcula simultaneamente desvios percentuais precisos em diversos parâmetros. Desenvolvido com ferramentas avançadas de modelagem com inteligência artificial e rigorosamente testado, o algoritmo foi projetado para interpretar o mercado com precisão sem precedentes. Você pode analisar qualquer par de moedas ou instrumento financeiro em sua plataf
Este produto foi atualizado para o mercado de 2026 e otimizado para as versões mais recentes do MT5. AVISO DE ATUALIZAÇÃO DE PREÇO: Smart Price Action Concepts está atualmente disponível por $200 . O preço aumentará para $299 após as próximas 30 compras . OFERTA ESPECIAL: Após comprar, envie-me uma mensagem privada para receber Bônus grátis + Presente . Antes de tudo, vale destacar que esta ferramenta de trading é um indicador sem repaint, sem redesenho e sem atraso, o que a torna ideal para tr
Reversion King Indicator
Eugen-alexandru Zibileanu
5 (5)
Um novo Rei chegou à cidade - Indicador + Gestão de Ordens (TP1 + TP2 + TP3) + Enviador opcional de sinais para Telegram INCLUÍDO (GRÁTIS) (SISTEMA COMPLETO DE TRADING e SINAIS) Nosso melhor EA para Ouro: Gold Slayer Este indicador inclui uma estratégia avançada, um sistema de trading com gestão de ordens personalizável e um sistema de reversão à média que combina extensões de envelopes, apoiado por múltiplos filtros inteligentes de confirmação, como o RSI, para capturar entradas de reversão de
Crystal Heikin Ashi Signals
Muhammad Jawad Shabir
5 (2)
Crystal Heikin Ashi Signals - Professional Trend & Signal Detection Indicator Advanced Heikin Ashi Visualization with Intelligent Signal System for Manual & Automated Trading Final Price: $149 ---------> Price goes up $10 after every 10 sales . Limited slots available — act fast . Overview Crystal Heikin Ashi Signals is a professional-grade MetaTrader 5 indicator that combines pure Heikin Ashi candle visualization with an advanced momentum-shift detection system. Designed for both manual traders
Trend Forecaster
Alexey Minkov
5 (8)
Trend Forecaster is a MetaTrader 5 indicator that combines breakout signals, possible reversal area analysis, market range data and a visual statistics panel in one chart workspace. It shows Buy and Sell signals, tracks Average Range and Current Range, and can automatically adjust Sensitivity for the current symbol and timeframe. Manual Sensitivity control is also available. The indicator can be used on Forex pairs, metals, stocks, indices and cryptocurrencies. Different timeframes are supported
KURAMA GOLD SIGNAL PRO (MT5) — Filtro de 7 camadas · TP/SL automático · Pontuação de qualidade · Salvamento do histórico de sinais | Sistema completo de trading para XAUUSD Sem repintura em tempo real. No instante em que um sinal aparece, a seta, a entrada, o TP e o SL ficam travados no lugar e nunca mais se movem. O que você opera é esse sinal em tempo real. E na v7.20, cada sinal realmente enviado é salvo automaticamente e restaurado com exatidão após reiniciar. BÔNUS PARA
Mais do autor
If you need more information than a few numbers in the iExposure index, this indicator is for you. Better iExposure indicator is an improvement over the original information, such as: Separate profit column for BUY and SELL Separate SL column for BUY and SELL Separate TP column for BUY and SEL Average Price as Horizontal Line in Chart Pip Value Profit https://www.facebook.com/groups/prop4y iExposure will show the opening of trading positions in tabular form in the sub-window below the main wi
Cool iExposure
Zbynek Liska
5 (1)
If you need more information than a few numbers in the iExposure index, this indicator is for you. Better iExposure indicator is an improvement over the original information, such as: Separate profit column for BUY and SELL Separate SL column for BUY and SELL Separate TP column for BUY and SEL Average Price as Horizontal Line in Chart Pip Value www.foxwave.eu
Basic tool Showing annual candle, range for Day, range for Week, range for Month, range for Year. Showing fibonacci for Day fibonacci for Week, fibonacci for Month, fibonacci for Year. Showing percent change for Day, percent change for Week, percent change for Month, percent change for Year. Showing distance of the current value the previous close for Day, Week, Month, Year.
What are Fibonacci Numbers and Lines? Fibonacci numbers are used to create technical indicators using a mathematical sequence developed by the Italian mathematician, commonly referred to as "Fibonacci," in the 13th century. The sequence of numbers, starting with zero and one, is created by adding the previous two numbers. For example, the early part of the sequence is 0, 1, 1, 2, 3, 5, 8, 13, 21, 34, 55, 89,144, 233, 377, and so on. The Fibonacci sequence is significant because of the so-calle
This is a simple and very effective utility for closing in profir or in loss. Constant overview of daily Draw Down, Current profit and Daily profit This utility will save your deposit in case of a sharp market change. Just add it to any free chart and use it for your daily trading. Thanks to the minimal set of parameters, you can easily set up the utility for any symbol in MT4
Easy EA for closing positions with profit or loss. All positions of chart's symbol are counted separately. Settings: TPforSymbol — set profit amount to indicate when to close every positions for the symbol of the chart. Swap and commission are decreasing your profit. SLforSymbol — set SL amount to indicate SL for every positions for the symbol of the chart. Swap and commission are increasing your loss. SLforSyblol is always below/equal zero.
This multi-currency annual dashboard analyzes the nearest high and low to the current price for a chosen number of recent years. It displays how many pips away the price is from the nearest high or low. You can set a pip threshold, and the alert will notify you when the price gets close to the specified levels. In real-time, the dashboard also provides an overview of the closest high or low values for each specific year, helping you make informed trading decisions.
Key level analysis : The indicator tracks the nearest annual high and low to the current price over a chosen number of years. Proximity alerts : It triggers an alert when the price reaches a specified number of pips from the nearest high or low. Customizable notification intervals : You can set how often alerts repeat, for example, every 30 minutes. Historical perspective : Enables long-term tracking of market levels and effective planning of trading strategies. Multi-currency support : This ind
iExposure Fox Wave – Comprehensive Position Monitoring Indicator iExposure Fox Wave is an advanced MetaTrader indicator designed to provide detailed monitoring of all open trading positions in a clear, tabular format. This tool is perfect for traders who want all essential trade information in one place. Key Features: Symbol: Displays the instruments (currency pairs or other symbols) with open positions. Deals: Number of open trades (transactions) for each symbol. Buy lots & Buy price: Total vol
RangeDashboard – Multi-symbol Daily, Weekly, and Monthly Range Overview with Alerts RangeDashboard is a powerful and user-friendly indicator that displays the current range (high-low) of selected currency pairs or instruments over a chosen timeframe (D1, W1, MN1) directly on the chart. It allows you to input a customizable list of symbols, add suffixes if needed, and select the timeframe from which the ranges are calculated. Key Features: Dynamic calculation of ranges for any number of symbols o
Fox Wave PSAR – PSAR Dashboard for Multiple Symbols and Timeframes Description: Fox Wave PSAR is a powerful indicator for MetaTrader 5 that allows you to monitor the Parabolic SAR (PSAR) across multiple symbols and timeframes directly in a clear and convenient dashboard. It is ideal for scalping, intraday, and long-term trading strategies. Key Features: Clear dashboard with a list of symbols and their current PSAR status. Supports any number of symbols and customizable suffixes (e.g., ".m"). Di
New High / Low Dashboard Scanner is not a common indicator. It is a market-structure control system designed to monitor, in real time, the creation of new Highs and Lows across Daily, Weekly, Monthly, and Yearly time horizons — while simultaneously measuring the exact distance of price from these critical levels in pips. This tool is built for traders who do not want to react late, but instead want to stand at the origin of market movement . What the system does The dashboard continuously scan
Short Description Fox Wave Account Nexus is a professional dashboard for real-time monitoring of multiple MetaTrader 5 accounts across different terminals from a single chart. Full Description  Fox Wave Account Nexus Professional Multi-Account Monitoring Dashboard for MetaTrader 5 Fox Wave Account Nexus is a powerful visual dashboard designed for traders who operate multiple MT5 accounts simultaneously and need instant, centralized control . The indicator collects live data from all con
Fox Wave Pro Copier - Professional Multi-Master Trade Copier Copy trades from multiple Master accounts simultaneously with advanced risk management Key Features Multi-Master Architecture Copy from unlimited master accounts simultaneously Automatic master account detection or manual configuration Real-time trade synchronization via file system Independent risk management for each master Advanced Risk Management Individual risk settings per master account Automatic lot size calculation based
TREND SCANNER PRO - Multi-Timeframe Trend Analysis Dashboard Professional real-time trend scanner that monitors up to 15 currency pairs across 8 timeframes simultaneously. Get instant market overview with epic visual dashboard, smart alerts, and zero lag performance. KEY FEATURES
Professional Averaging Calculator - Essential Risk Management Tool for Every Trader Whether you're a beginner learning position averaging or a professional managing complex grid strategies, this calculator is your must-have tool. Beginners instantly see how averaging works, understand maximum loss scenarios, and learn proper risk management before entering trades - no more "I didn't know I could lose that much" surprises. Professionals save time and eliminate calculation errors with instant simu
SMC Pro — Smart Money Concepts All-in-One The only indicator you need to trade like the institutions. SMC Pro combines five core Smart Money Concepts tools into a single, clean, and fully customizable indicator for MetaTrader 5. No repainting. No clutter. Everything you need to read the market the way banks and hedge funds do. What it does Order Blocks Automatically detects bullish and bearish Order Blocks — the price zones where institutional orders were placed before a major move. The indic
Calculate the exact entry price or lot size needed to reach your target average — directly on the chart. Full description A lightweight MT5 indicator that solves a common trading problem: if I add to my position at market price, what volume do I need to reach my target average? Or the reverse: if I want to add a fixed lot size, at what price must I enter? The panel reads your open positions automatically, displays the current average entry price with a dashed line on the chart, and lets you s
Spread Recorder — Multi-Symbol Max/Min Dashboard Spread Recorder is a real-time multi-symbol dashboard that continuously monitors live spreads across your entire watchlist and permanently records the maximum and minimum spread ever seen for each symbol — with timestamps. Key features: Monitor 10, 28, 50+ symbols simultaneously from a single customizable text file Auto-adaptive grid layout — the panel automatically resizes its rows and columns to fit however many symbols you load, from a handful
Swap Monitor — Multi-Symbol Buy/Sell Swap Dashboard with Alerts Swap Monitor is a real-time multi-symbol dashboard that displays live SELL and BUY swap rates for your entire watchlist in one compact, color-coded panel — and can alert you the instant any swap rate changes. Key features: Monitor 10, 28, 50+ symbols simultaneously from a single customizable text file Auto-adaptive grid layout — the panel automatically resizes to fit however many symbols you load Displays both SELL and BUY swap valu
FoxWave Volume Suite combines three essential volume-based tools into a single indicator: a horizontal Volume Profile with Point of Control and Value Area, a real-time volume spike detector with instant alerts, and a buy/sell pressure delta gauge. No need to run three separate indicators — everything you need to read volume is in one clean Fox Wave panel. What it does Volume Profile (POC / VAH / VAL) Builds a horizontal histogram showing how much volume traded at each price level over your cho
FoxWave SMC Trend Suite  SHORT DESCRIPTION  Smart Money Concepts trend tool: Market Structure (BOS/CHoCH), Order Blocks, FVG and EQH/EQL — fully toggleable, with alerts. FULL DESCRIPTION FoxWave SMC Trend Suite brings the four foundational building blocks of Smart Money Concepts trading into a single, clean indicator: Market Structure shifts (Break of Structure / Change of Character), Order Blocks, Fair Value Gaps, and Equal Highs/Equal Lows liquidity pools. Every component can be switched on or
Filtro:
Sem comentários
Responder ao comentário