Quant Analytics
- Indicadores
- Versão: 1.0
- Ativações: 5

Short description (for the product summary field)
Quant Analytics turns your raw trade history into a full quantitative performance report — right inside MetaTrader 5. A dark, on-chart P/L calendar for daily use, plus a one-click HTML export with the same depth of analysis you'd expect from a dedicated trading journal: drawdown, Monte Carlo, Kelly, Omega, MAE/MFE, rolling Sharpe, and more.
Full description
See your trading the way a quant would — without leaving MetaTrader 5.
Most account-history tools give you a balance line and a win rate. Quant Analytics gives you an actual performance audit: every closed trade broken down by symbol, weekday, hold time, and direction, plus the risk-adjusted metrics that professional traders and prop firms actually look at.
On the chart:
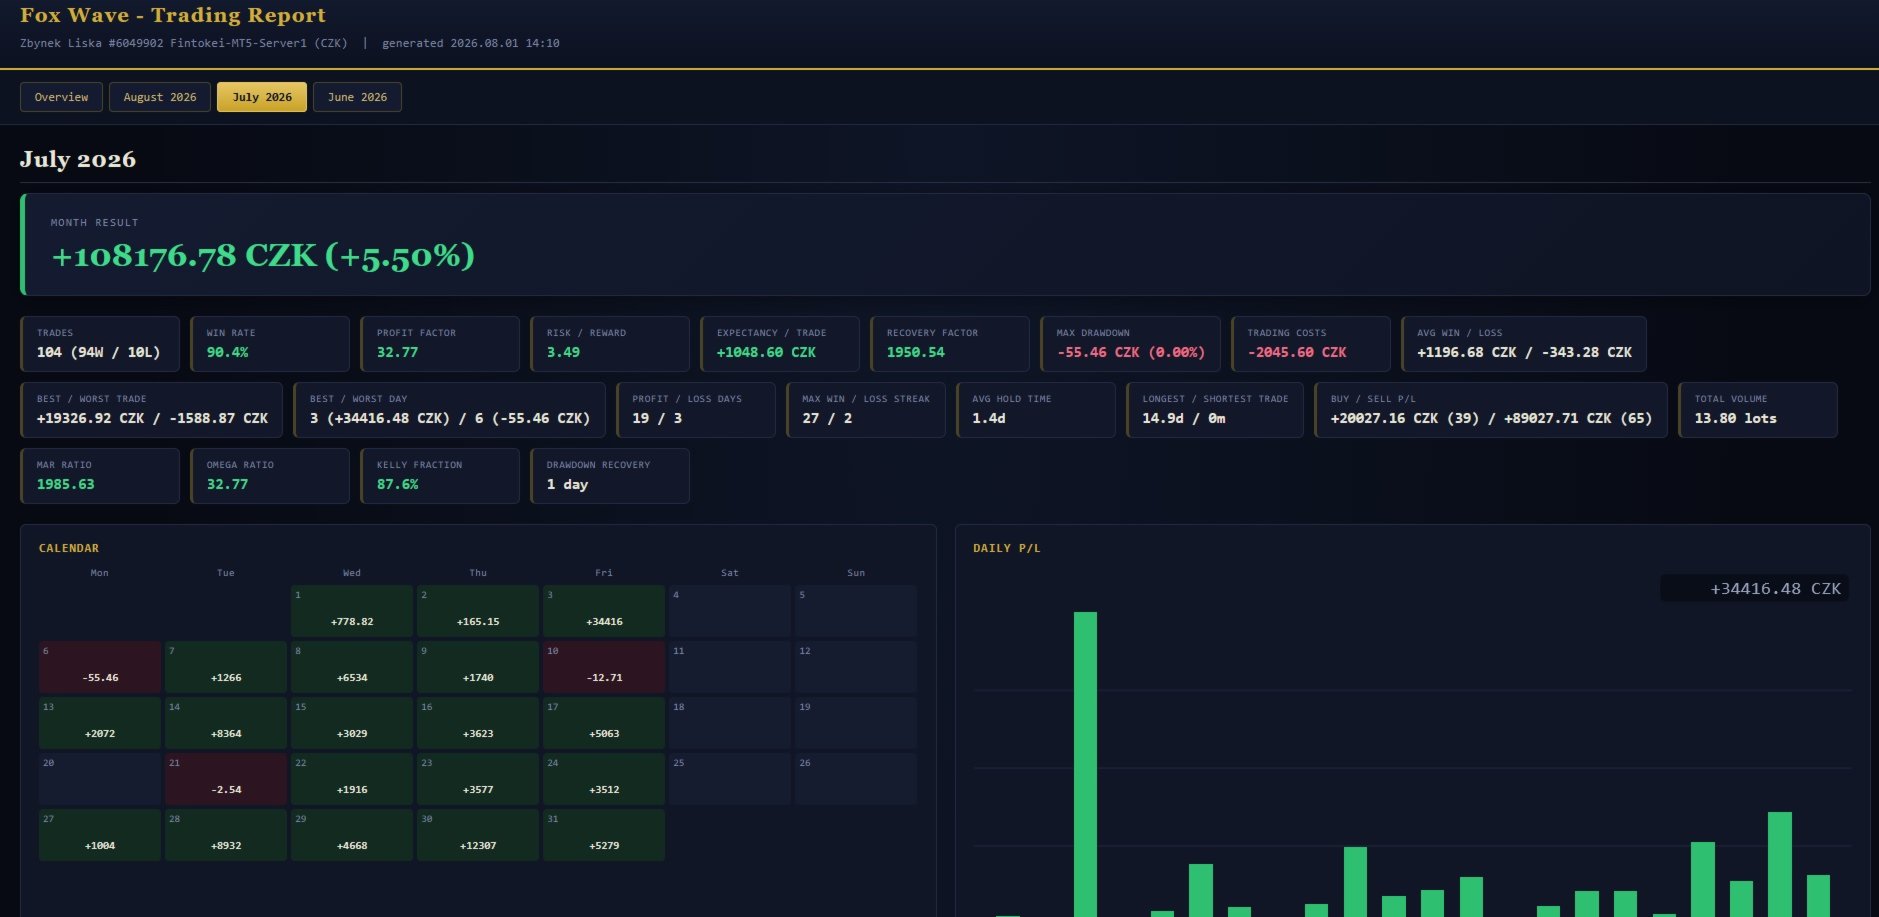
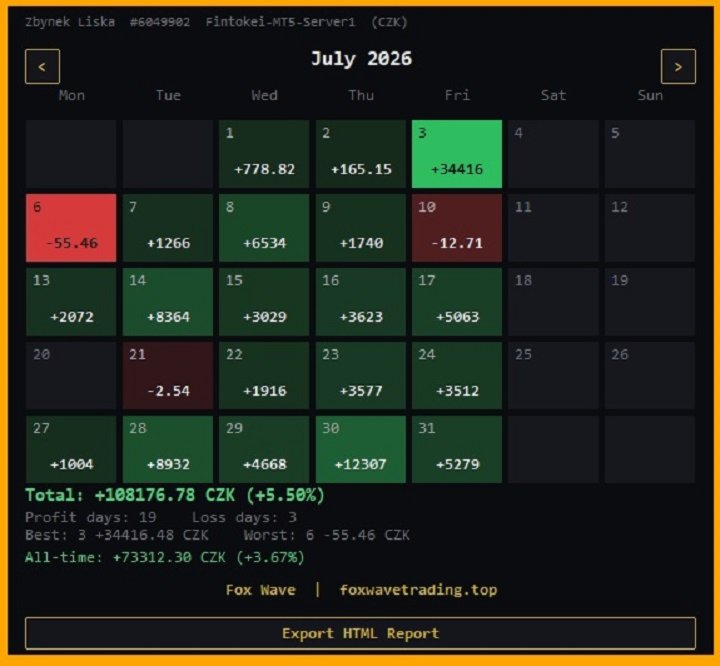
- A clean, dark calendar panel showing daily P/L color-coded by size — green for profit days, red for losses, intensity scaled to how big the day was.
- Month navigation with one click, panel auto-resizes to fit however many weeks the month needs.
- Live summary: total P/L and %, profit/loss day counts, best/worst day, all-time P/L since your very first trade.
- Starting capital is reconstructed correctly even for the account's founding month, when a deposit and the first trade don't land on the same day.
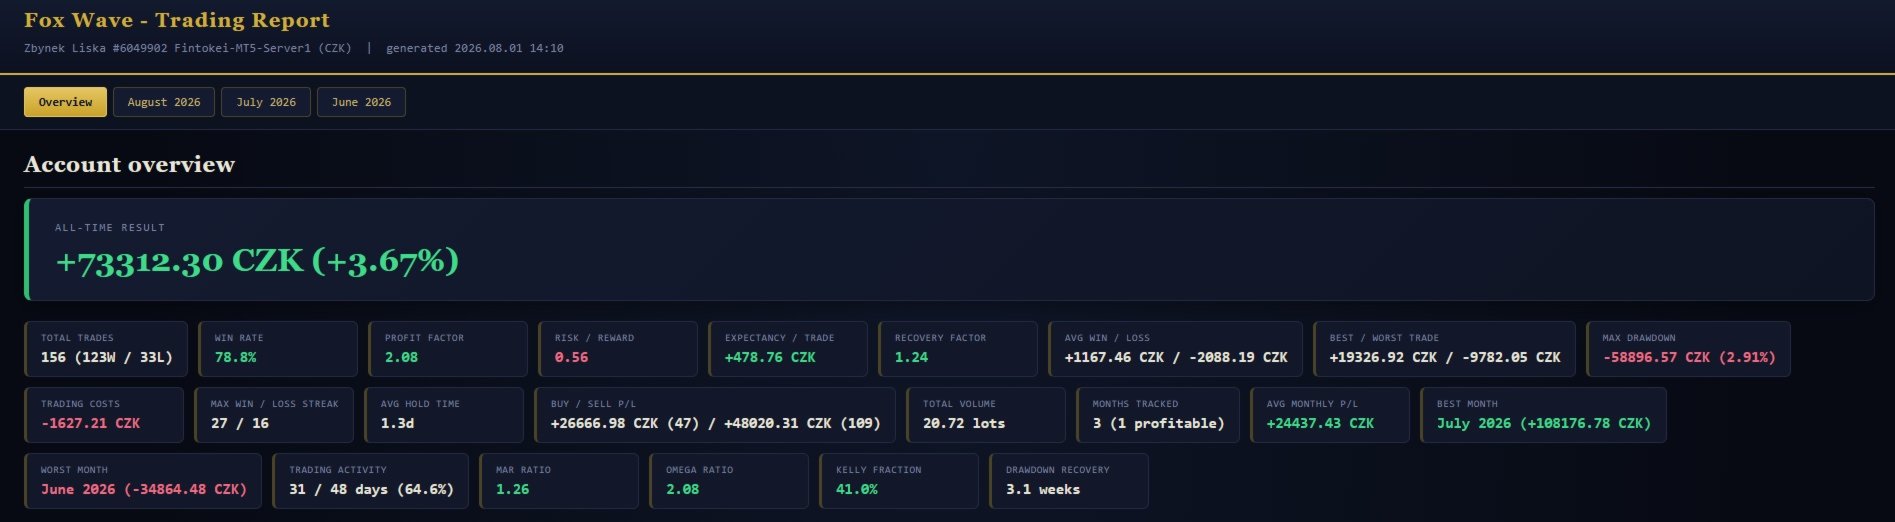
One click — full HTML report: Hit "Export HTML Report" and get a self-contained, offline HTML file (dark themed, no external dependencies) with a tab for every month you've ever traded, plus an all-time Overview page:
- Core performance: win rate, profit factor, expectancy per trade, average win/loss, best/worst trade, win/loss streaks, buy vs. sell split, total volume.
- Risk metrics: max drawdown (£/%), recovery time expressed in days/weeks/months (not just a raw number), recovery factor, MAR ratio, Omega ratio, Kelly fraction.
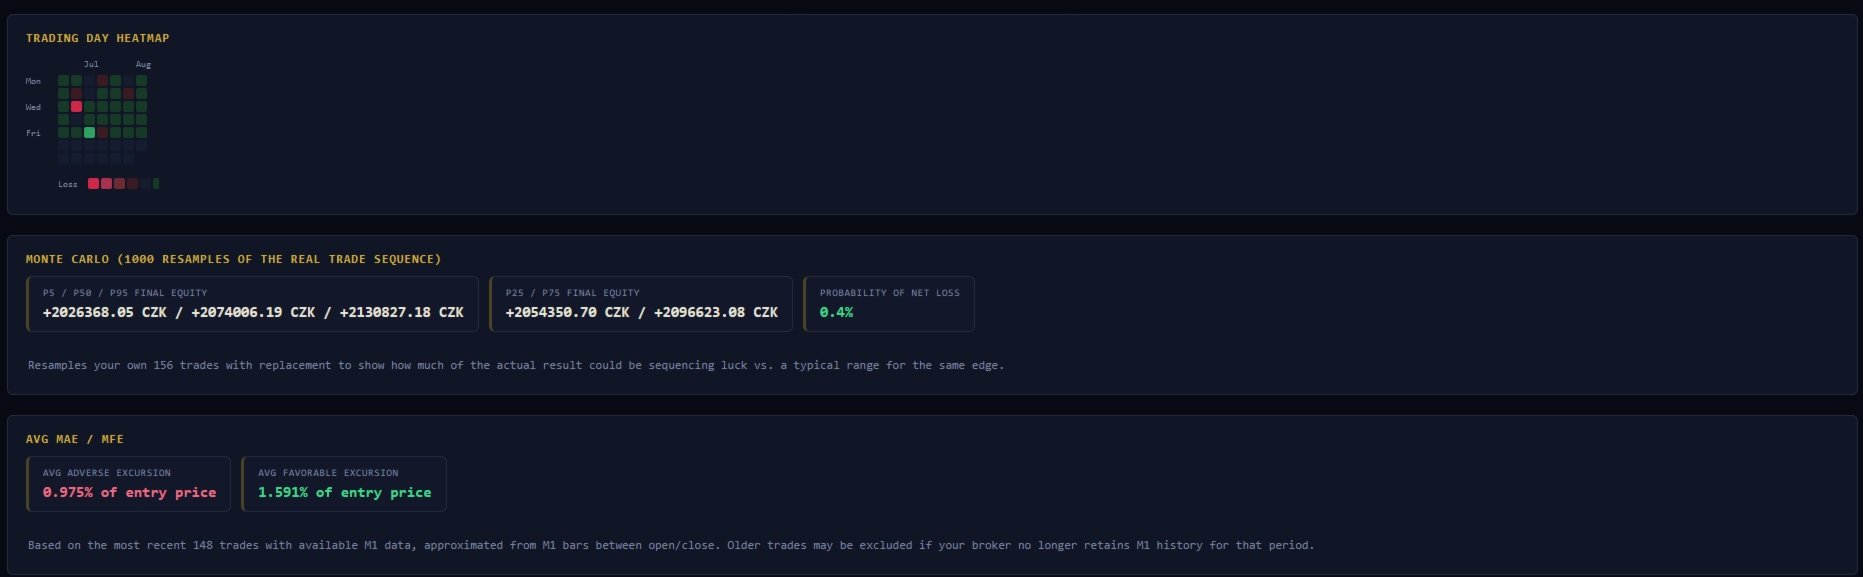
- Distribution & simulation: a histogram of your trade P/L, a Monte Carlo simulation (1,000 resamples of your actual trade sequence) showing the P5–P95 range of outcomes and probability of a net loss — so you can see how much of your result is edge vs. sequencing luck.
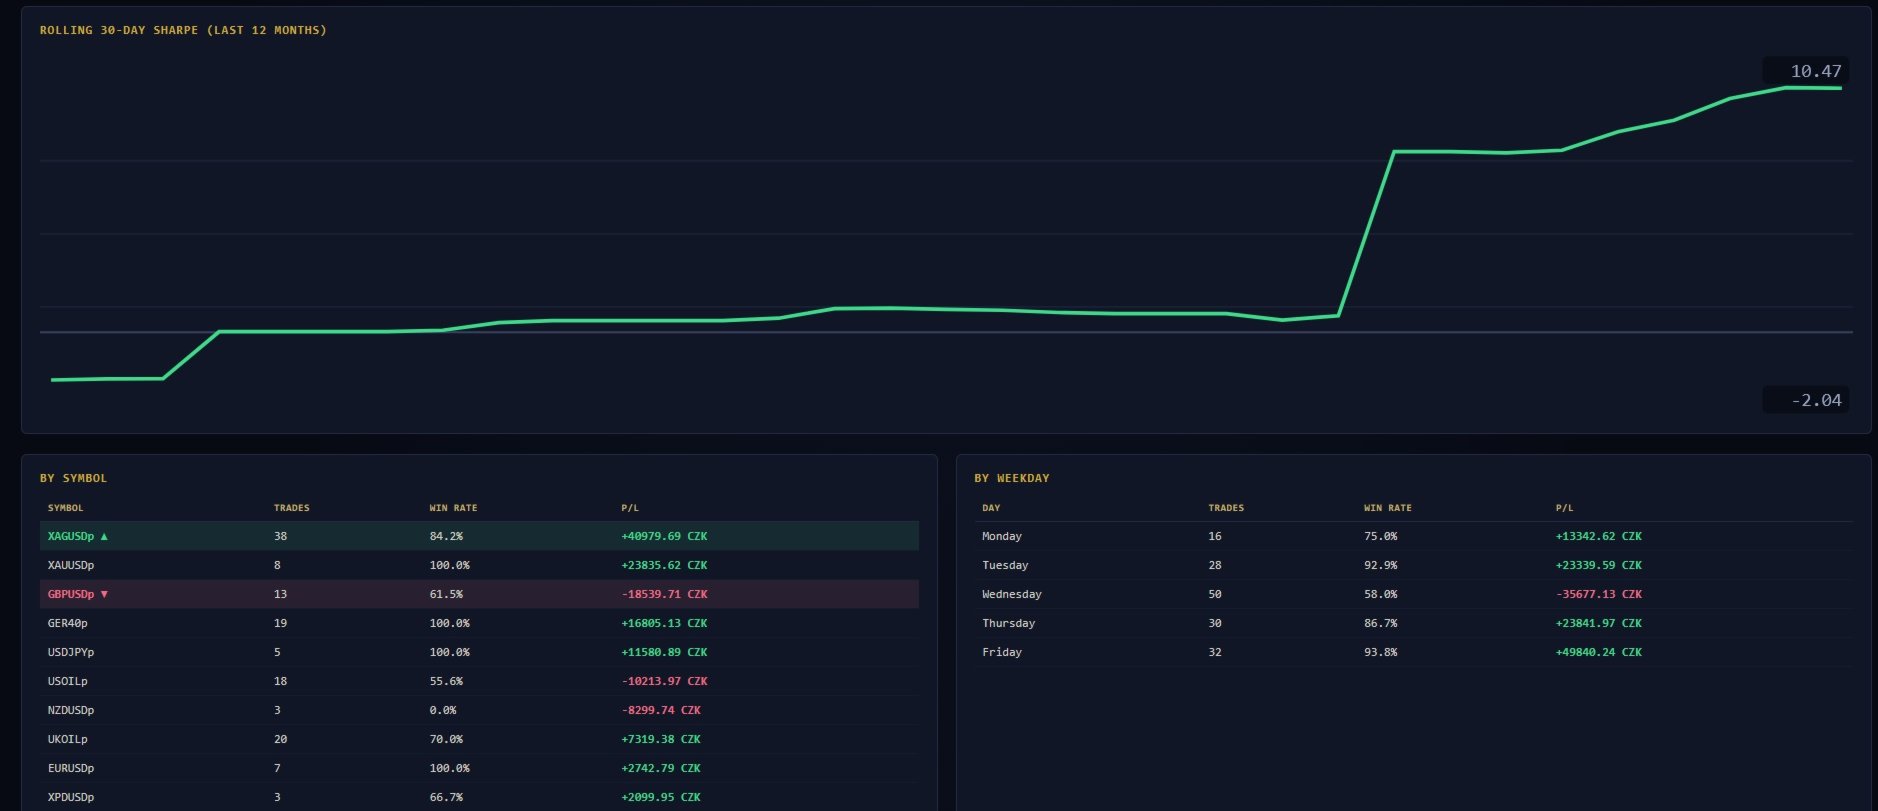
- Time-based views: a GitHub-style trading-day heatmap across your whole history, a rolling 30-day Sharpe ratio over the last 12 months, and a by-weekday / by-hold-time breakdown.
- Approximate MAE/MFE: average adverse/favorable excursion per trade (as % of entry price), computed from M1 bar data for your most recent trades.
- Full trade log for every month, with symbol, direction, open/close time, volume and profit.
Every chart is inline SVG — nothing loads from the internet, and the file opens in any browser, forever, even offline.
Under the hood:
- Only counts real trading deals (buy/sell) — deposits, withdrawals, credits and corrections never pollute your P/L.
- Currency-aware formatting (USD, EUR, GBP, CZK, JPY and others).
- Optional symbol filter, so you can generate a report scoped to a single instrument.
- Best/worst contributing symbol is visually highlighted in the symbol breakdown, so it doesn't get lost in a long list.
A note on data-dependent metrics: MAE/MFE needs M1 price history for the symbols and periods in your trade history. If your terminal hasn't downloaded that data, the report will tell you clearly instead of showing a misleading zero — just open the relevant symbol's M1 chart once and re-export.
Inputs:
- Panel corner, offset X/Y
- Optional symbol filter (blank = whole account)
- Accent color
- Refresh interval (seconds)
Who it's for: discretionary and systematic traders, prop firm challenge participants, and anyone who wants an honest, data-driven read on their own trading — not just a balance curve.