FootPrintChart

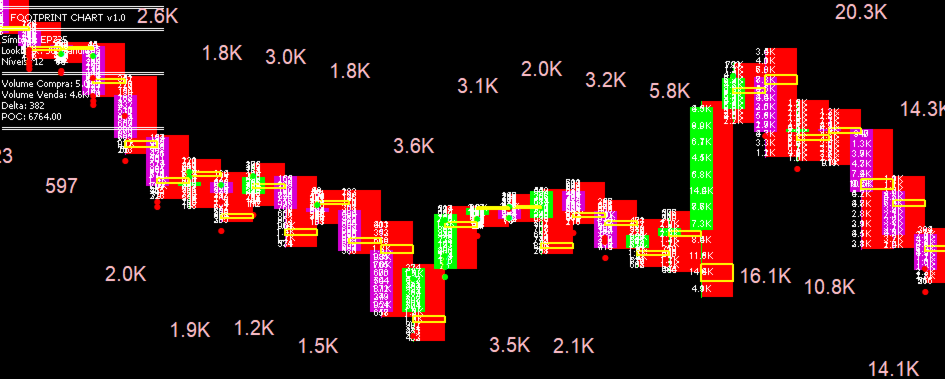
📊 Footprint Chart - Análise Profissional de Volume por Nível de Preço

Análise institucional de volume agora disponível no MetaTrader 5!

O Footprint Chart é um indicador profissional que revoluciona sua análise de mercado ao revelar a verdadeira batalha entre compradores e vendedores em cada nível de preço. Diferente dos indicadores tradicionais de volume, o Footprint mostra ONDE o volume foi negociado dentro de cada candle, permitindo identificar zonas de acumulação, distribuição e pontos de controle com precisão cirúrgica.

CARACTERÍSTICAS PRINCIPAIS

📈 Visualização Avançada de Volume

  • Volume de compra e venda separados por nível de preço
  • Identificação automática do POC (Point of Control) - nível com maior volume negociado
  • Detecção de desequilíbrios (imbalances) entre compra e venda
  • Volume total exibido de forma alternada (acima/abaixo) para fácil leitura

🎯 POC (Point of Control)

  • Destaque visual do nível de maior concentração de volume
  • Tooltip informativo com estatísticas detalhadas
  • Identificação de zonas de suporte e resistência reais baseadas em volume

⚡ Detecção de Desequilíbrios

  • Alertas visuais quando há forte predomínio de compra ou venda
  • Ratio configurável para identificar pressão unilateral
  • Setas coloridas indicando direção do desequilíbrio

🎨 Totalmente Personalizável

  • Cores independentes para volume de compra, venda e POC
  • Tamanho de fonte e largura dos retângulos ajustáveis
  • Lookback ilimitado (processa quantos candles você quiser!)
  • Modo otimizado para desenhar apenas candles visíveis (economiza recursos)

⚙️ Performance Inteligente

  • Modo "Desenhar Apenas Visíveis" para gráficos fluidos mesmo com lookback alto
  • Sistema de cache eficiente
  • Processamento otimizado de ticks em tempo real
  • Barra de progresso para lookbacks grandes

🎯 PARA QUEM É ESTE INDICADOR?

Day Traders que precisam identificar níveis de liquidez em tempo real
Scalpers buscando entradas precisas em zonas de alto volume
Swing Traders que querem confirmar níveis de suporte/resistência com volume real
Traders Profissionais acostumados com plataformas como Sierra Chart, NinjaTrader
Institucionais que necessitam análise granular de fluxo de ordens

⚠️ REQUISITOS IMPORTANTES - LEIA COM ATENÇÃO!

🏦 CORRETORAS RECOMENDADAS (Mercados Futuros) Para obter a análise mais precisa, é ESSENCIAL usar uma corretora que forneça dados de volume real (tick-by-tick):

Recomendadas para Futuros:

  • Corretoras de futuros regulamentadas (CME, B3, Eurex, etc.)
  • Brokers com feed direto de bolsas (sem agregação)

CFDs com Volume Real:

  • Dukascopy (suporta volume real em CFDs)

NÃO RECOMENDADO:

  • Corretoras de CFDs/Forex que não fornecem volume real
  • Brokers que só disponibilizam tick volume (volume sintético)

📊 O que acontece sem volume real? O indicador funcionará em modo de aproximação, distribuindo o volume do candle pelos níveis de preço usando algoritmos estatísticos. Isso ainda fornece insights úteis, mas não será tão preciso quanto dados tick-by-tick reais.

🔧 PARÂMETROS CONFIGURÁVEIS

Principais:

  • Lookback - Quantidade de candles para análise (sem limite!)
  • InpPriceLevels - Níveis de preço por candle (3-100)
  • InpUseRealVolume - Usar volume real ou ticks
  • InpDrawOnlyVisible - Modo otimizado (desenha apenas candles visíveis)

Visuais:

  • Cores personalizáveis (compra, venda, POC, texto)
  • Tamanho de fonte e largura dos retângulos
  • Opção de mostrar/ocultar POC e desequilíbrios
  • Configuração do volume total (posição, cor, fonte)

Avançados:

  • Ratio de desequilíbrio configurável
  • Mínimo de ticks para processar
  • Offset do volume em pixels

💡 COMO USAR

  1. Adicione ao gráfico do ativo desejado
  2. Configure o Lookback (comece com 100-200 candles)
  3. Ative "Desenhar Apenas Visíveis" se usar lookback alto (>500)
  4. Ajuste as cores ao seu tema de gráfico
  5. Analise os níveis de maior volume (POC) e desequilíbrios

Dicas de Uso:

  • POC amarelo = zona de maior negociação (suporte/resistência forte)
  • Desequilíbrios com setas = possível continuação na direção indicada
  • Volume total acima/abaixo = fácil comparação entre candles
  • Clique nos objetos para ver tooltips com estatísticas detalhadas

📹 CASOS DE USO

✅ Identificar zonas de absorção de ordens
✅ Detectar rejeição em níveis de alto volume
✅ Confirmar rompimentos com volume
✅ Encontrar níveis de "value area"
✅ Analisar padrões de acumulação/distribuição

🚀 DIFERENCIAIS

✔️ Sem limitações artificiais - processe quantos candles quiser
✔️ Modo de performance para lookbacks gigantes
✔️ Volume real tick-by-tick quando disponível
✔️ Tooltips informativos em todos os objetos
✔️ Código otimizado e documentado
✔️ Suporte contínuo e atualizações

⭐ Se este indicador ajudou você, deixe uma avaliação! ⭐


Produtos recomendados
SMC Market Blueprint
Alex Amuyunzu Raymond
SMC Market Blueprint Institutional Market Structure Analyzer Based on Smart Money and ICT Concepts Overview SMC Market Blueprint is a comprehensive institutional-grade indicator designed to decode the true structure of the market using Smart Money Concepts (SMC) and ICT (Inner Circle Trader) methodology. It maps the internal market framework — identifying structure shifts, liquidity zones, and order flow transitions across multiple timeframes — giving traders a clear blueprint of how institution
H1 Trade
Davi Dos Santos Galucio
Robo para o qualquer ATIVO para Metratreder5 no tempo gráfico D1 Suporte: fgtecham@gmail.com Desenvolvido com IA e ajustado automaticamente usando bases de cálculos matemáticos que coletam as entradas de altíssima precisão. Usando dados de volume, rsi, médias moveis, MACD, Média de tamanho dos candles de alta e baixa, e equações matemáticas que ajustam de acordo com o mercado atual. Foi realizado diversos testes, e o resultado é impressionantemente alto.  
This product is designed for the MT5 platform and offers two key features: VWAP (Volume Weighted Average Price) calculation and Volume Profile analysis. Advantages: VWAP Calculation: The product calculates the VWAP, which is a popular indicator used by traders to determine the average price of a security based on its trading volume. It helps identify potential buying or selling opportunities by comparing the current price to the average price weighted by volume. Volume Profile Analysis: The prod
Footprint MT5
Mahmoud Ahmed Abdou Ali
Footprint charts in MetaTrader 5 (MT5) provide traders with a detailed view of market activity, allowing for better analysis of price movements and trading decisions. What is a Footprint Chart? A footprint chart is a specialized visualization tool that displays market data beyond traditional candlestick or bar charts. It reveals how volume was distributed at each price level within a specific time frame, often segmented by bid and ask activity. This level of detail helps traders understand the
Top indicator   for MT5   providing alert and notification for symbols if any price freezes! Guys, try to buy at least one month version for testing purposes! This indicator displays the current time for multiple Forex pairs and alerts when there's a disconnection between broker and PC time. It'll be very help full for trading platforms administrator who are monitoring hundreds of symbols in a time.
Ultimate Double Top & Bottom (Pro Volume Matrix) Stop trading retail breakouts. Start trading Institutional Traps. The   Ultimate Double Top & Bottom   is not a standard, lagging pattern scanner. It is a highly advanced, non-repainting structural engine equipped with a proprietary   3-Leg Volume Matrix . Designed exclusively for Smart Money Concepts (SMC) and order flow traders, this indicator mathematically dissects the tick volume inside M and W patterns to reveal true institutional intent:  
PowerMagic
Pranav Himmataughade
The Pranavtrxx ( Author ) Levels Indicator is a precision-based trading tool designed to identify key price levels in the market, helping traders make informed entry and exit decisions. This indicator automatically plots dynamic support and resistance zones derived from historical price action, psychological price levels, and recent market structure. Whether you're a day trader or swing trader, this tool offers real-time market level tracking that adjusts with price movement, helping you pinpoin
Este indicador é baseado na transformada discreta de Hartley. O uso dessa transformação permite aplicar diferentes abordagens ao processar séries temporais financeiras. Uma característica distintiva deste indicador é que suas leituras não se referem a um ponto no gráfico, mas a todos os pontos do período do indicador. Ao processar uma série temporal, o indicador permite selecionar vários elementos da série temporal. A primeira possibilidade de filtragem baseia-se nesta abordagem - todos os comp
XENON SUPERTRENDS : The Institutional Gold Standard for MT5 "Precision. Stability. Dominance. Experience the Truth in Every Tick." Welcome to the pinnacle of trend-following precision.   XENON SUPERTRENDS Master Edition   is not just an indicator; it is a high-performance analytical environment engineered for professional traders who demand absolute transparency and unshakeable accuracy. Specifically optimized for the world’s most volatile assets like   Gold (XAUUSD) ,   Global Indices (NASD
First time on MetaTrader, introducing IQ Star Lines - an original Vedic Astrology based indicator. "Millionaires don't use astrology, billionaires do" . - J.P. Morgan, Legendary American financier and banker. IQ Star Lines, an unique astrological indicator purely based on   Vedic astrology   calculations, published for the   first time on Metatrader.  This unique tool plots dynamic planetary grid lines based on real-time stars, constellations, and celestial movements, which allows you to plot t
KT Advance Ichimoku
KEENBASE SOFTWARE SOLUTIONS
KT Advance Ichimoku plot the arrows and provide alerts for the four trading strategies based on Ichimoku Kinko Hyo indicator. The generated signals can be filtered by other Ichimoku elements.  Four Strategies based on the Ichimoku Kinko Hyo 1.Tenkan-Kijun Cross Buy Arrow: When Tenkan-Sen cross above the Kijun-Sen. Sell Arrow: When Tenkan-Sen cross below the Kijun-Sen. 2.Kumo Cloud Breakout Buy Arrow: When price close above the Kumo cloud.  Sell Arrow: When price close below the Kumo cloud. 3.C
RSImaxmin
Carlos Andrés Moya Erazo
4.5 (10)
The indicator shows when there are overprice and divergences on the RSI. In addition, it has configurable alerts, dynamic overprice levels and a special “RSI cleaner” function. The indicator that automatically calculates the premium rates! RSImaxmin is an indicator based on the Relative Strength Index (RSI) oscillator that effectively identifies changes in price trends as it reflects the relative strength of bullish movements compared to bearish movements. It is widely used by traders to measur
ArroX
Zahed Khodarahmi
ArroX Indicator Description ArroX is a technical analysis indicator designed for MetaTrader 5 platform. This indicator analyzes price movements and market trends to provide trading signals. Key Features: - Displays buy and sell arrows on the chart - Includes trend filtering capabilities - Provides multiple take profit levels - Shows market analysis information panel - Supports different signal sensitivity modes - Uses Bollinger Bands and moving averages for analysis - Includes stop loss calc
All Trend power
Israr Hussain Shah
TrendPower All-In-One Strict v1.00 Description TrendPower All-In-One Strict   is a comprehensive trend-following trading system designed for MetaTrader 5. It acts as a "confluence detector," meaning it filters market noise by requiring multiple technical indicators to agree before generating a signal. The indicator utilizes a "Strict" logic engine, meaning a signal is only generated when momentum, trend direction, and volatility filters all align perfectly. It displays data in a separate sub-win
MTF VWAP Indicator - Quick Overview   This indicator shows you where institutional money is flowing across multiple timeframes using Volume Weighted Average Price (VWAP) to identify high-probability trading zones.     What It Actually Does:     1. Tracks Smart Money Levels: - Shows Daily, Weekly, and Monthly VWAP lines where big players (banks, funds) are trading - Tells you if price is above or below these key institutional levels - Shows distance from VWAP as a percentage (tells you how extend
Sapphire Strat Maker
Emanuel Cavalcante Amorim Filho
Sapphire Strat Maker  is an EA builder (Expert Advisor Builder or Strategy Maker) designed to make the creation of trading strategies easier . The goal is to provide the most intuitive, functional and fast environment to test and execute new strategies. Check out the free version here - Sapphire Strat Maker Alt . Also, check out the Emerald EA Builder : an easier to use EA builder, with a few more functionalities (trailing stop, limit orders, etc.). With this Expert Advisor you can create thousa
Volume Profile SAF - Institutional-Grade Volume-informed Market Structure Indicator     Unlock Professional Market Intelligence with less Effort   Stop guessing. Start seeing. The Volume Profile SAF (Set and Forget) transforms complex market structure analysis into crystal-clear, actionable trading signals that institutional traders pay thousands for. Experience the power of real-time volume profiling, value area tracking, and precision POC cross alerts - all in one lightweight, EA-ready indicat
Boom 600 Precision Spike Detector The Boom 600 Precision Spike Detector is your ultimate tool for trading the Boom 600 market with precision and confidence. Equipped with advanced features, this indicator helps you identify potential buy opportunities and reversals, making it an essential tool for traders aiming to capture spikes with minimal effort. Key Features: Non-Repainting Signals: Accurate, non-repainting signals that you can trust for reliable trading decisions. Audible Alerts: Stay on t
Ultimate Breakout Sniper AI
Riaan Adriaan Swanepoel
Ultimate Breakout Sniper AI EA MT5 Breakthrough AI-Powered Gold Trading Expert Advisor WORKS on Bitcoin Also The Ultimate Breakout Sniper AI EA MT5 is an advanced automated trading system engineered for precision breakout trading on Gold (XAUUSD) — while remaining fully adaptable to indices, forex pairs, and cryptocurrencies. Built with institutional-grade logic, adaptive AI filters, and smart trade management, it aims to capture explosive price movements with maximum consistency and minimal
ENGLISH DESCRIPTION (MQL5 Standard Optimized) Product Name: Voidchrome Intelligence Core AI (MT5) [Subtitle: Void Squeeze | Reflective RSI | Sanctum Shield Safety] Introduction Voidchrome Intelligence Core AI is a kinetic breakout system designed to identify and exploit the high-pressure "Void" zones of the market. It utilizes a proprietary Void State Logic (Bollinger Bands inside Keltner Channels) to detect volatility compression, confirms momentum with Reflective RSI , and aligns trade directi
SMG Guard Pro
Tanawut Wongmanee
Smart Money Guardian The Ultimate Trade Manager & Equity Protection Expert Transform your manual trading with professional-grade discipline. Smart Money Guardian is not just a tool; it is your "Digital CEO" that manages every trade with mathematical precision, protecting your capital from emotional decisions and unexpected market volatility. ️ Why Choose Smart Money Guardian? Most manual traders fail due to a lack of exit discipline and poor risk management. This EA solves that by automating
Introducing the Forex Trading EA on Elliott Waves – Optimizing Profit with Minimal Capital The Elliott Wave Theory is one of the foundational principles of technical analysis in any market. Most traders aim to trade within the primary market trend. However, through AI-powered analysis, I have tested and validated that predicting exactly when a main trend begins and ends is virtually impossible. My machine-learning algorithms revealed an intriguing insight during research: there are specific wave
Pull It Back MT5
Salvatore Caligiuri
PROMOTIONAL PERIOD - ONLY 2 COPIES LEFT OF FIRST 10 BUYERS AT PRICE 300,00$!!! CHECK SCREENSHOTS AND COMMENTS FOR OUR STRATEGY RULES AND LIVE TRADES SIGNALS PULL IT BACK  is a revolutionary trading system and a complete strategy with advanced algorithm developed to detect the trend direction after a  PULLBACK , a  RETREACEMENT  or a  KEY LEVEL BOUNCE . The goal of this indicator is to get as many pips as possible from market trend. Following strictly the rules of the strategy, you can become a
Session separator indicator draws boxes for each trading session to show the trader open and close hours with its high and low. Key features: Option to set hours and colours for 3 trading sessions. Boxes update immediately when breaking out of high/low. Hour shift or auto time zone. Choose the amount of days to draw session boxes. Indicator works on H1 and lower for visibility. Choose border style
CRV Z-Score Engine is a professional market structure indicator that transforms raw price into normalized,  multi-horizon statistical structure model   It reveals: When price is statistically stretched When the market is transitioning between regimes When a move is structurally aligned across multiple horizons This is not a lagging oscillator . It is a multi-horizon statistical structure model built for serious traders. WHAT IS Z-SCORE? Z-Score measures how far price deviates from its n
Professional VWAP Trading System with Advanced Signal Detection Transform your trading with the most comprehensive VWAP indicator available for MetaTrader 5. Magic VWAP Key Levels Pro combines multiple timeframe analysis, intelligent signal detection, and professional-grade visualization to give you the edge in modern markets. CORE FEATURES: Multi-Timeframe VWAP Analysis Session, Weekly, and Monthly VWAP calculations Previous 10-day VWAP support/resistance Dynamic anchor periods (Session/Week/Mo
**Volume Trend Navigator** is a modern volume-based trend indicator that spots when market momentum is accelerating or fading by analyzing volume and recent price swings over three bars: * **Bullish acceleration**: Draws an ↑ arrow when the current bar’s volume exceeds that of the two preceding bars **and** price closes above the previous bar’s high—signaling a strengthened up-trend. * **Bearish acceleration**: Draws a ↓ arrow when the current bar’s volume exceeds that of the two preceding bar
VWAP Indicator MT5
Kyra Nickaline Watson-gordon
Description : VWAP (Volume-Weighted Average Price) is the ratio of the value traded to total volume traded over a particular time horizon. It is a measure of the average price at which pair is traded over the trading horizon. Read More. All Symbols and All Timeframes are supported. Indicator Inputs :     VWAP Mode : Mode of VWAP Calculation. Options can be selected : Single,Session,Daily,Weekly,Monthly     Volumes : Real Volumes,Tick Volumes     Price Type : Used price for calculating. O
Bandas de Machine Learning VWAP: A Vantagem Preditiva para Traders Desbloqueie o próximo nível de análise de mercado com as Bandas de Machine Learning VWAP – um indicador MQL5 inovador projetado para fornecer insights incomparáveis sobre tendências de mercado, suporte/resistência dinâmico e sinais de negociação de alta probabilidade. Aproveitando um algoritmo proprietário de machine learning adaptativo integrado ao poder do Preço Médio Ponderado pelo Volume (VWAP), este indicador transcende a an
Opening Range Breakouts MT5
Thushara Dissanayake
4.5 (4)
O   Indicador de Rupturas de Faixas de Abertura   é uma ferramenta de negociação baseada em sessão, desenvolvida para traders que seguem conceitos institucionais de negociação, como   ICT (Inner Circle Trader), Conceitos de Smart Money (SMC)   e estratégias baseadas em   volume   ou   fluxo de ordens   . Este indicador traça faixas de abertura essenciais para a sessão, permitindo que os traders identifiquem potenciais   varreduras de liquidez, zonas de rompimento, falsos rompimentos   e   níveis
Os compradores deste produto também adquirem
Divergence Bomber
Ihor Otkydach
4.89 (83)
Cada comprador deste indicador recebe adicionalmente, e de forma gratuita: A ferramenta exclusiva "Bomber Utility", que acompanha automaticamente cada operação, define os níveis de Stop Loss e Take Profit e fecha operações de acordo com as regras da estratégia; Arquivos de configuração (set files) para ajustar o indicador em diferentes ativos; Set files para configurar o Bomber Utility nos modos: "Risco Mínimo", "Risco Balanceado" e "Estratégia de Espera"; Um vídeo tutorial passo a passo que aju
Grabber System MT5
Ihor Otkydach
4.82 (22)
Apresento a você um excelente indicador técnico: Grabber, que funciona como uma estratégia de trading “tudo incluído”, pronta para usar. Em um único código estão integradas ferramentas poderosas de análise técnica de mercado, sinais de entrada (setas), funções de alertas e notificações push. Cada comprador deste indicador também recebe gratuitamente: Utilitário Grabber: ferramenta para gerenciamento automático de ordens abertas Vídeo tutorial passo a passo: como instalar, configurar e operar com
Trend Screener Pro MT5
STE S.S.COMPANY
4.84 (101)
Desbloqueie o poder da negociação de tendências com o indicador Trend Screener: sua solução definitiva de negociação de tendências, alimentada por lógica difusa e sistema de múltiplas moedas! Eleve sua negociação de tendências com o Trend Screener, o revolucionário indicador de tendências alimentado por lógica difusa. É um poderoso indicador de acompanhamento de tendências que combina mais de 13 ferramentas e recursos premium e 3 estratégias de negociação, tornando-o uma escolha versátil para to
Azimuth Pro
Ottaviano De Cicco
5 (4)
PROMOÇÃO DE LANÇAMENTO O preço do Azimuth Pro está inicialmente definido em 299$ para os primeiros 100compradores. O preço final será de 499$ . A DIFERENÇA ENTRE ENTRADAS RETAIL E INSTITUCIONAIS NÃO É O INDICADOR — É A LOCALIZAÇÃO. A maioria dos traders entra em níveis de preço arbitrários, perseguindo momentum ou reagindo a sinais atrasados. As instituições esperam o preço atingir níveis estruturados onde oferta e demanda realmente mudam. Azimuth Pro mapeia esses níveis automaticamente: VWA
AriX
Temirlan Kdyrkhan
1 (4)
AriX Indicator for MT5 A powerful trend-following and signal-evaluation tool AriX is a custom MT5 indicator that combines Moving Averages and ATR-based risk/reward logic to generate clear buy/sell signals. It visualizes dynamic SL/TP levels, evaluates past trade outcomes, and displays win/loss statistics in a clean on-chart panel. Key features include: Buy/Sell signals based on MA crossovers ATR-based SL/TP1/TP2/TP3 levels with visual lines and labels Signal outcome tracking with real-time stat
Quantum TrendPulse
Bogdan Ion Puscasu
5 (22)
Apresentando   Quantum TrendPulse   , a ferramenta de negociação definitiva que combina o poder do   SuperTrend   ,   RSI   e   Stochastic   em um indicador abrangente para maximizar seu potencial de negociação. Projetado para traders que buscam precisão e eficiência, este indicador ajuda você a identificar tendências de mercado, mudanças de momentum e pontos de entrada e saída ideais com confiança. Principais características: Integração SuperTrend:   siga facilmente a tendência predominante do
Apresentando       Quantum Breakout PRO   , o inovador Indicador MQL5 que está transformando a maneira como você negocia Breakout Zones! Desenvolvido por uma equipe de traders experientes com experiência comercial de mais de 13 anos,       Quantum Breakout PRO       foi projetado para impulsionar sua jornada comercial a novos patamares com sua estratégia de zona de fuga inovadora e dinâmica. O Quantum Breakout Indicator lhe dará setas de sinal em zonas de breakout com 5 zonas-alvo de lucro e su
OmniSync Projection
Antonio-alin Teculescu
5 (1)
Chronos Fractal Engine is an innovative price projection indicator for MetaTrader 5, designed to transform your technical analysis by intelligently identifying and projecting historical price patterns. Built upon an advanced correlation algorithm and the fractal principles of the market, this powerful tool visualizes potential future price movements, giving you a unique edge in your trading decisions. What is Chronos Fractal Engine? At its core, the Chronos Fractal Engine employs a sophisticat
ARIPoint
Temirlan Kdyrkhan
ARIPoint is a powerful trading companion designed to generate high-probability entry signals with dynamic TP/SL/DP levels based on volatility. Built-in performance tracking shows win/loss stats, PP1/PP2 hits, and success rates all updated live. Key Features: Buy/Sell signals with adaptive volatility bands Real-time TP/SL/DP levels based on ATR Built-in MA Filter with optional ATR/StdDev volatility Performance stats panel (Success, Profit/Loss, PP1/PP2) Alerts via popup, sound, push, or email Cu
RelicusRoad Pro: Sistema Operacional Quantitativo de Mercado 70% DE DESCONTO ACESSO VITALÍCIO (TEMPO LIMITADO) - JUNTE-SE A 2.000+ TRADERS Por que a maioria dos traders falha mesmo com indicadores "perfeitos"? Porque eles operam Conceitos Únicos no vácuo. Um sinal sem contexto é uma aposta. Você precisa de CONFLUÊNCIA . RelicusRoad Pro não é um simples indicador de seta. É um Ecossistema Quantitativo de Mercado completo. Ele mapeia a "Estrada do Valor Justo", distinguindo ruído de rupturas estru
Trend Forecaster
Alexey Minkov
5 (7)
The Trend Forecaster indicator utilizes a unique proprietary algorithm to determine entry points for a breakout trading strategy. The indicator identifies price clusters, analyzes price movement near levels, and provides a signal when the price breaks through a level. The Trend Forecaster indicator is suitable for all financial assets, including currencies (Forex), metals, stocks, indices, and cryptocurrencies. You can also adjust the indicator to work on any time frames, although it is recommen
Este é um indicador para MT5 que fornece sinais precisos para entrar em uma negociação sem redesenhar. Ele pode ser aplicado a qualquer ativo financeiro: forex, criptomoedas, metais, ações, índices. Ele fornecerá estimativas bastante precisas e informará quando é melhor abrir e fechar um negócio. Assista o vídeo (6:22) com um exemplo de processamento de apenas um sinal que compensou o indicador! A maioria dos traders melhora seus resultados de negociação durante a primeira semana de negociação c
Algo Pumping
Ihor Otkydach
4.76 (21)
PUMPING STATION – Sua estratégia pessoal “tudo incluído” Apresentamos o PUMPING STATION — um indicador revolucionário para Forex que vai transformar sua maneira de operar em uma experiência empolgante e eficaz. Este não é apenas um assistente, mas sim um sistema de trading completo com algoritmos poderosos que vão te ajudar a operar de forma mais estável. Ao adquirir este produto, você recebe GRATUITAMENTE: Arquivos de configuração exclusivos: para uma configuração automática e desempenho máxim
Este é sem dúvida o indicador de reconhecimento automático de formação de preço harmônico mais completo que você pode encontrar para a MetaTrader Platform. Ele detecta 19 padrões diferentes, leva as projeções de Fibonacci tão a sério quanto você, exibe a Zona de Reversão Potencial (PRZ) e encontra níveis adequados de stop loss e take-profit. [ Guia de instalação | Guia de atualização | Solução de problemas | FAQ | Todos os produtos ] Detecta 19 formações harmônicas de preços diferentes Traça
O indicador " Dynamic Scalper System MT5 " foi desenvolvido para o método de scalping, operando dentro de ondas de tendência. Testado nos principais pares de moedas e ouro, é possível a compatibilidade com outros instrumentos de negociação. Fornece sinais para a abertura de posições de curto prazo ao longo da tendência, com suporte adicional para o movimento dos preços. O princípio do indicador: As setas grandes determinam a direção da tendência. Um algoritmo para gerar sinais de scalping sob
Meta Cipher B
SILICON HALLWAY PTY LTD
Meta Cipher B: O conjunto de osciladores tudo-em-um para MT5 Meta Cipher B traz o popular conceito do Market Cipher B para o MetaTrader 5, otimizado para velocidade e precisão. Desenvolvido do zero para máximo desempenho, ele oferece sinais de nível profissional sem atrasos nem lentidão. Embora seja poderoso por si só, o Meta Cipher B também foi projetado para funcionar naturalmente com o Meta Cipher A , oferecendo um contexto de mercado completo e confirmações mais profundas. O que ele faz Um
TPA True Price Action indicator reveals the true price action of the market makers through 100% non-repainting signals strictly at the close of a candle! TPA shows entries and re-entries, every time the bulls are definitely stronger than the bears and vice versa. Not to confuse with red/green candles. The shift of power gets confirmed at the earliest stage and is ONE exit strategy of several. There are available now two free parts of the TPA User Guide for our customers. The first "The Basics"
Btmm state engine pro
Garry James Goodchild
5 (2)
Get the user guide here  https://g-labs.software/guides/BTMM_State_Engine_Welcome_Pack.html BTMM State Engine Pro — the   all-in-one Banks   & Institutions Market Maker indicator for Meta Trader 5. Built for   BTMM traders who follow the Asian   session breakout methodology with Kill Zone timing , level stacking, peak formation detection , and multi-pair scanning — all   from a single chart. Combines   a full BTMM State Engine   with a built-in multi-pair Scanner dashboard, eliminating the need
Antes de tudo, vale ressaltar que esta Ferramenta de Negociação é um Indicador Não Repintante, Não Redesenhante e Não Atrasado, o que a torna ideal para negociação profissional. Curso online, manual do utilizador e demonstração. O Indicador de Conceitos de Ação de Preço Inteligente é uma ferramenta muito poderosa tanto para traders novos quanto experientes. Ele combina mais de 20 indicadores úteis em um único, combinando ideias avançadas de negociação como Análise do Trader do Círculo Interno
CGE Trading Suite
Carl Gustav Johan Ekstrom
5 (1)
CGE Trading Suite delivers the analytical edge typically reserved for professional trading desks. The platform integrates a full suite of analytical tools into one seamless workflow: dynamic grid mapping, liquidity behavior analysis, ECM, trend lines, MIDAS, trade cycles, and directional channel projections. Together, these provide a unified view of market structure and momentum. Directional clarity is further enhanced by the capital flow index, which measures currency basket strength to identif
Order Block Pro (MQL5) – Versão 1.0 Autor: KOUAME N'DA LEMISSA Plataforma: MetaTrader 5 Descrição: Order Block Pro é um indicador avançado projetado para detectar automaticamente Blocos de Ordem de alta e baixa no seu gráfico. Ao analisar velas de consolidação seguidas de velas de impulso fortes, o indicador identifica áreas-chave onde o preço provavelmente se acelerará. Ideal para traders que desejam: Identificar pontos de entrada e saída precisos. Detectar zonas dinâmicas de suporte e resistê
Berma Bands
Muhammad Elbermawi
5 (8)
O indicador Berma Bands (BBs) é uma ferramenta valiosa para traders que buscam identificar e capitalizar tendências de mercado. Ao analisar a relação entre o preço e os BBs, os traders podem discernir se um mercado está em uma fase de tendência ou de variação. Visite o [ Blog Berma Home ] para saber mais. As Bandas de Berma são compostas por três linhas distintas: a Banda de Berma Superior, a Banda de Berma Média e a Banda de Berma Inferior. Essas linhas são plotadas em torno do preço, criando u
Ultimate SMC Indicator
Hicham Mahmoud Almoustafa
1 (1)
Ultimate SMC PRO – Smart Money Concepts Indicator (Order Blocks, FVG, Liquidity, BOS) for MetaTrader 5   After purchasing the product, you will receive an additional copy for free. Just contact me after your purchase. Ultimate SMC PRO is a professional trading indicator designed to visualize Smart Money Concepts directly on the chart. The indicator combines several institutional trading tools in one system to help traders identify potential high-probability trading zones. ULTIMATE SMC INDICATO
Pointer Trend Switch — precision trend reversal indicator Pointer Trend Switch is a high-precision arrow indicator designed to detect key moments of trend reversal based on asymmetric price behavior within a selected range of bars. It identifies localized price impulses by analyzing how far price deviates from the opening level, helping traders find accurate entry points before a trend visibly shifts. This indicator is ideal for scalping, intraday strategies, and swing trading, and performs equa
ARIScalping
Temirlan Kdyrkhan
ARIScalp is a powerful trading companion designed to generate high-probability entry signals with dynamic TP/SL/DP levels based on volatility. Built-in performance tracking shows win/loss stats, PP1/PP2 hits, and success rates all updated live. Key Features: Buy/Sell signals with adaptive volatility bands Real-time TP/SL/DP levels based on ATR Built-in MA Filter with optional ATR/StdDev volatility Performance stats panel (Success, Profit/Loss, PP1/PP2) Alerts via popup, sound, push, or email Cus
Bill Williams Advanced
Siarhei Vashchylka
5 (10)
Bill Williams Advanced is designed for automatic chart analysis using Bill Williams' "Profitunity" system. The indicator analyzes four timeframes at once. Manual (Be sure to read before purchasing) Advantages 1. Analyzes the chart using Bill Williams' "Profitunity" system. Signals are displayed in a table in the corner of the screen and on the price chart. 2. Finds all known AO and AC signals, as well as zone signals. Equipped with a trend filter based on the Alligator. 3. Finds "Divergence Bar
Moon Cycle
Navdeep Singh Kaur
Indicador técnico que utiliza o algoritmo astronômico de Jean Meeus para exibir fases lunares em gráficos de trading. Apresenta linha curva contínua representando o ciclo lunar com precisão científica equivalente a observatórios profissionais. Compatível com qualquer símbolo e timeframe no MT5, incluindo forex, commodities, índices e ações. Inclui painel informativo mostrando fase lunar atual, percentual de iluminação e níveis de referência para análise técnica. Configurações de cor e estilo co
Matreshka
Dimitr Trifonov
5 (2)
Matreshka self-testing and self-optimizing indicator: 1. Is an interpretation of the Elliott Wave Analysis Theory. 2. Based on the principle of the indicator type ZigZag, and the waves are based on the principle of interpretation of the theory of DeMark. 3. Filters waves in length and height. 4. Draws up to six levels of ZigZag at the same time, tracking waves of different orders. 5. Marks Pulsed and Recoil Waves. 6. Draws arrows to open positions 7. Draws three channels. 8. Notes support and re
Native Channels
BeeXXI Corporation
5 (1)
This indicator recognizes all support and resistance levels. A number of unique high-performance techniques have been applied, which made the existence of this indicator possible. All formed channels are naturally visible: horizontal linear linear parabolic cubic (Polynomial 3 degrees - Wave) This is due to a bundle of approximating channels. The formed channels form "standing waves" in a hierarchical sequence. Thus, all support and resistance levels are visible. All parameter management is i
Institutional Secret Method
Tshidiso Sydwell Moiloa
1 (1)
The Institutional Secret Method  represents a paradigm shift in market analysis, moving away from lagging indicators and into the realm of Topological Finance . It is engineered to decode the hidden geometry of price movement by calculating the most efficient path—the Geodesic —between current price action and institutional liquidity targets. The system views the market as a physical landscape where price is naturally drawn toward massive pools of liquidity (Stops). It uses two primary calculati
Mais do autor
An anchored Vwap With Arrows is an indicator that includes a moving average weighted by volume that allows you to plot on a bottom or a top. Usually banks and institutions measure an average price, this average price is a price range where they agree to make a trade. Using the logic of anchored vwap with arrows it is possible to understand that if the price breaks the vwap it means that someone with enough buying and selling power has lost control. You can use vwap anchored with arrows in any ti
Smart OrderBlocks
Fillipe Dos Santos
Smart OrderBlocks - Indicador para MetaTrader 5 Uma visão diferenciada e um pouco de price action! Smart OrderBlocks - um indicador que mostra de um ponto diferente a estrutura do mercado através da detecção de zonas de oferta e demanda. Recursos: Detecção de OrderBlocks OrderBlocks Internos : Capture dinâmicas micro-level do mercado OrderBlocks de Swing : Identifique tendências macro de momentum de mercado Inteligência Avançada de Volatilidade Detecção de volatilidade usando: ATR (Average
FREE
SuperTrendAshi
Fillipe Dos Santos
5 (2)
SuperTrendAshi Descrição O SuperTrendAshi é uma versão avançada e otimizada do indicador SuperTrend que incorpora o cálculo Heikin Ashi para fornecer sinais mais suaves e confiáveis. Esta combinação única resulta em um indicador que reduz sinais falsos e identifica tendências com maior precisão. Características Principais Combina a força do SuperTrend com a suavização do Heikin Ashi Sinais mais estáveis com menos ruído Sistema de cores intuitivo (Azul-claro para tendência de alta, Magenta para t
FREE
Pivot Points Levels
Fillipe Dos Santos
2 (1)
Pivot Points Levels Descrição O indicador Pivot Points Levels é uma ferramenta avançada e completa para análise técnica baseada em níveis de suporte e resistência calculados a partir de pontos de pivô. Este indicador gratuito combina 6 métodos diferentes de cálculo com suporte a múltiplos timeframes, oferecendo uma solução robusta para identificar áreas-chave de reversão e continuação de preço. Características Principais 6 Métodos de Cálculo : Tradicional, Fibonacci, Woodie, Clássico, DeMark (DM
FREE
Moving Regression Bands - Indicador de Regressão Polinomial com Bandas Adaptativas Descrição O MovingRegressionBands é um indicador técnico avançado que combina regressão polinomial com bandas adaptativas para identificar tendências e pontos de reversão no mercado. Utilizando cálculos matemáticos sofisticados, o indicador oferece uma visão mais precisa do movimento dos preços através de um modelo de regressão de ordem superior. Características Principais Regressão polinomial de ordem configuráv
FREE
through this indicator you can make  analysis and also can to distinguish possible weakness or continuous strength  on  price, it is an indicator initially developed by David Weis. This version is for the meta trader 5 platform. The Weis Waves indicator is based on volume and is aligned with the price, being able to find not only possible strenght and weakness, but also possible divergences between price and volume, bringing an interesting analysis between both.
Weis Waves Result
Fillipe Dos Santos
The result as the name explain, displays the result of a swing. Sometimes weis waves show a big effort, but a little result... The weis waves result is a better revelation about the volume, if united with weis waves. it is a volume indicator, but it is different from a conventional volume indicator, this indicator came from the wyckoff method, if you use the result you will have a different view of the market, regardless of which asset is operating.
DashMarketProfile
Fillipe Dos Santos
this indicator is essential when it's necessary to identify  trade locations on  chart. You can initially get an idea of ​​the candlestick's direction with other graphical tools and then identify the best regions with the DMP. The Dash Market Profile is a statistical indicator, that mean it is an indicator that is based on mathematical calculations, identifying the best regions and observing the candles of the best regions to trade. The financial market is not as easy as it seems, it is necessar
CandleVolume
Fillipe Dos Santos
CandleVolume is an indicator that colors bars according to increasing or decreasing volume. You can use it to identify strategic regions of the chart and complete an analysis. White means low volume, yellow means medium volume and red means climax volume. It is a recommended indicator if you like to interpret market contexts and understand how market cycles work.
BetterVolumeTick
Fillipe Dos Santos
BetterVolumeTick it is a volume indicator. It marks the volume regions where there was a great aggression, also shows the volume intensity. Yellow means low volume, normal activity. Orange means activity with a pretty amount of volume. Red means ultra high volume. This indicator combined with the price chart will give you another view of the market context.
Hurst Cycles Diamonds Descrição Este indicador é uma versão alternativa inspirada no trabalho pioneiro de David Hickson e no indicador Hurst Cycles Notes desenvolvido por Grafton. O objetivo principal é fornecer uma visão clara e intuitiva dos ciclos de Hurst. Créditos Conceito Original : David Hickson - Teoria dos Ciclos de Hurst Inspiração : Grafton - Hurst Cycles Notes Versão Alternativa : Fillipe dos Santos Características Principais Identifica e exibe pivôs em múltiplos ciclos temporais Ac
Moving Regression Bands EA  Descrição O Moving Regression Bands EA é um robusto sistema de trading automatizado que utiliza análise de regressão polinomial para identificar oportunidades de mercado. Baseado em bandas de regressão móvel, este EA oferece uma abordagem matemática e estatística para trading. Características Principais Análise Avançada : Utiliza regressão polinomial para calcular tendências e bandas de volatilidade Flexibilidade Operacional : Modos Normal e Inverso para diferentes e
SuperTrendAshi EA
Fillipe Dos Santos
SuperTrendAshi EA - Automated Trading System Um Expert Advisor versátil baseado no indicador SuperTrend adaptado para velas Heikin Ashi Principais Características: Sistema de trading automatizado que combina a precisão do SuperTrend com a suavização do Heikin Ashi Flexibilidade de operação com múltiplos modos de trading Gerenciamento de risco avançado com Trailing Stop dinâmico Interface intuitiva com parâmetros personalizáveis Funcionalidades Detalhadas: Modos de Operação Modo Stop Loss e Take
Smart Order Blocks EA
Fillipe Dos Santos
Smart Order Blocks EA - Trading Automático com Orderblocks Descrição O Smart Order Blocks EA é um Expert Advisor avançado projetado para identificar, visualizar e operar automaticamente com base em formações de Order Blocks - um conceito poderoso utilizado por muitos traders. Esta ferramenta é bastante completa, capaz de detectar oportunidades de mercado com precisão e executar estratégias de forma autônoma. O que são Order Blocks? Order Blocks são áreas específicas do gráfico que representam z
Filtro:
Sem comentários
Responder ao comentário