FootPrintChart

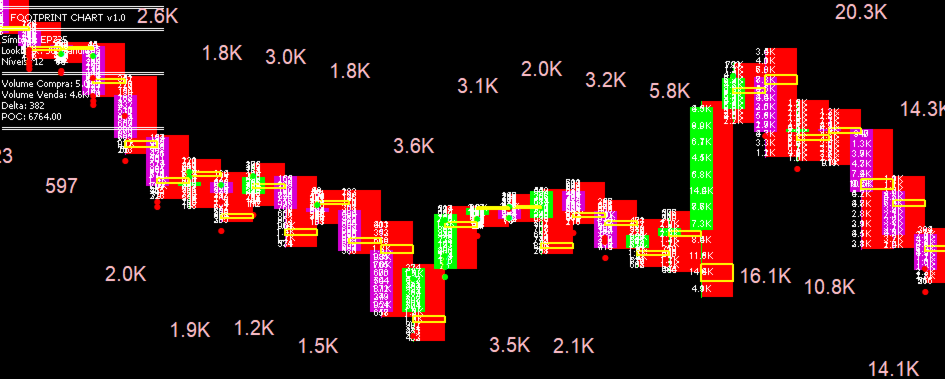
📊 Footprint Chart - Professional Volume Profile Analysis

Institutional-grade volume analysis now available on MetaTrader 5!

The Footprint Chart is a professional indicator that revolutionizes your market analysis by revealing the true battle between buyers and sellers at each price level. Unlike traditional volume indicators, Footprint shows WHERE volume was traded within each candle, allowing you to identify accumulation zones, distribution patterns, and points of control with surgical precision.

KEY FEATURES

📈 Advanced Volume Visualization

  • Buy and sell volume separated by price level
  • Automatic POC (Point of Control) identification - highest volume level
  • Imbalance detection between buying and selling
  • Total volume displayed alternately (above/below) for easy reading

🎯 POC (Point of Control)

  • Visual highlight of highest volume concentration level
  • Informative tooltip with detailed statistics
  • Identification of real support/resistance zones based on volume

⚡ Imbalance Detection

  • Visual alerts when there's strong buying or selling dominance
  • Configurable ratio to identify one-sided pressure
  • Colored arrows indicating imbalance direction

🎨 Fully Customizable

  • Independent colors for buy volume, sell volume, and POC
  • Adjustable font size and rectangle width
  • Unlimited lookback (process as many candles as you want!)
  • Optimized mode to draw only visible candles (saves resources)

⚙️ Intelligent Performance

  • "Draw Only Visible" mode for smooth charts even with high lookback
  • Efficient cache system
  • Optimized real-time tick processing
  • Progress bar for large lookbacks

🎯 WHO IS THIS INDICATOR FOR?

Day Traders who need to identify liquidity levels in real-time
Scalpers looking for precise entries in high-volume zones
Swing Traders wanting to confirm support/resistance levels with real volume
Professional Traders accustomed to platforms like Sierra Chart, NinjaTrader
Institutional Traders requiring granular order flow analysis

⚠️ IMPORTANT REQUIREMENTS - READ CAREFULLY!

🏦 RECOMMENDED BROKERS (Futures Markets) For the most accurate analysis, it's ESSENTIAL to use a broker that provides real volume data (tick-by-tick):

Recommended for Futures:

  • Regulated futures brokers (CME, B3, Eurex, etc.)
  • Brokers with direct exchange feeds (no aggregation)

CFDs with Real Volume:

  • Dukascopy (supports real volume on CFDs)

NOT RECOMMENDED:

  • CFD/Forex brokers that don't provide real volume
  • Brokers offering only tick volume (synthetic volume)

📊 What happens without real volume? The indicator will work in approximation mode, distributing candle volume across price levels using statistical algorithms. This still provides useful insights, but won't be as accurate as real tick-by-tick data.

🔧 CONFIGURABLE PARAMETERS

Main Settings:

  • Lookback - Number of candles to analyze (unlimited!)
  • InpPriceLevels - Price levels per candle (3-100)
  • InpUseRealVolume - Use real volume or ticks
  • InpDrawOnlyVisible - Optimized mode (draws only visible candles)

Visual Settings:

  • Customizable colors (buy, sell, POC, text)
  • Font size and rectangle width
  • Show/hide POC and imbalances
  • Total volume configuration (position, color, font)

Advanced Settings:

  • Configurable imbalance ratio
  • Minimum ticks to process
  • Volume offset in pixels

💡 HOW TO USE

  1. Add to chart of desired asset
  2. Configure Lookback (start with 100-200 candles)
  3. Enable "Draw Only Visible" if using high lookback (>500)
  4. Adjust colors to match your chart theme
  5. Analyze levels with highest volume (POC) and imbalances

Usage Tips:

  • Yellow POC = highest trading zone (strong support/resistance)
  • Imbalances with arrows = possible continuation in indicated direction
  • Total volume above/below = easy comparison between candles
  • Click objects to see tooltips with detailed statistics

📹 USE CASES

✅ Identify order absorption zones
✅ Detect rejection at high-volume levels
✅ Confirm breakouts with volume
✅ Find "value area" levels
✅ Analyze accumulation/distribution patterns

🚀 DIFFERENTIATORS

✔️ No artificial limitations - process as many candles as you want
✔️ Performance mode for gigantic lookbacks
✔️ Real tick-by-tick volume when available
✔️ Informative tooltips on all objects
✔️ Optimized and documented code
✔️ Continuous support and updates

⭐ If this indicator helped you, please leave a review! ⭐


おすすめのプロダクト
市場のモメンタムを正確に可視化 MultiMA_ICHIMOKU_STO_Color は、3つの強力なインジケーターを1つのスマートなシステムに統合することで、明確な市場シグナルを提供するように設計された包括的なテクニカル分析ツールです。 このインジケーターは、3つのカスタマイズ可能な移動平均線(MA)、一目均衡表の主要要素、およびストキャスティクス・オシレーターを統合しています。そのユニークな特徴は、市場の状況を瞬時に明らかにするインテリジェントなローソク足の色分けシステムです:     強気 (青): 価格が3つのMAすべてを上回り、かつストキャスティクスが50を超えている場合。強い上昇モメンタムを示します。     弱気 (赤): 価格が3つのMAすべてを下回り、かつストキャスティクスが50を超えている場合。強い下降モメンタムを示します。     中立 (グレー): 状況が混在している、またはモメンタムが弱い場合(ストキャスティクスが50未満)。 利点:     チャートの乱雑さを解消し、複数のインジケーターを切り替える必要がなくなります。     確率の高い取引機会を一目で特定
OrderFlux | MetaTrader 5 用フットプリント・オーダーフロー バージョン 2.0 – アクティブトレーダー向けのリアルタイム Bid/Ask 可視化 OrderFlux は MT5 用のフットプリントおよびオーダーフローインジケーターです。価格がどこに動いたかだけでなく、その動きの中で何が起きているか(各価格レベルの Bid/Ask ボリューム、デルタ、インバランス、ボリューム分布)を表示します。 多くのチャートはローソク足の最終結果しか表示しません。OrderFlux はそこに至るまでの過程を表示します。ローソク足の形状だけでなく、市場参加者の動向を読み取りたい場合にまさに役立ちます。 Manual   -->   Klick ライブチャートにおいて、OrderFlux は主に次の3つの質問に答えます: 現在、どこで積極的な買いまたは売りの圧力が市場に参入しているか? どの価格レベルでボリュームが吸収、または拒否されているか? 現在の動きはセッションのコンテキスト(背景)にどう適合しているか? インターフェースで得られるもの メインチャートは、Canvas ベー
SMC Market Blueprint Institutional Market Structure Analyzer Based on Smart Money and ICT Concepts Overview SMC Market Blueprint is a comprehensive institutional-grade indicator designed to decode the true structure of the market using Smart Money Concepts (SMC) and ICT (Inner Circle Trader) methodology. It maps the internal market framework — identifying structure shifts, liquidity zones, and order flow transitions across multiple timeframes — giving traders a clear blueprint of how institution
H1 Trade
Davi Dos Santos Galucio
Robot for the Brent ASSET for Metratrader5 on the H1 time frame Support: fgtecham@gmail.com Developed with AI and automatically adjusted using mathematical calculation bases that collect inputs of very high precision. Using volume data, RSI, moving averages, MACD, average size of bullish and bearish candles, and mathematical equations that adjust according to the current market.Various tests have been conducted, and the result is impressively high.
This product is designed for the MT5 platform and offers two key features: VWAP (Volume Weighted Average Price) calculation and Volume Profile analysis. Advantages: VWAP Calculation: The product calculates the VWAP, which is a popular indicator used by traders to determine the average price of a security based on its trading volume. It helps identify potential buying or selling opportunities by comparing the current price to the average price weighted by volume. Volume Profile Analysis: The prod
Footprint MT5
Mahmoud Ahmed Abdou Ali
Footprint charts in MetaTrader 5 (MT5) provide traders with a detailed view of market activity, allowing for better analysis of price movements and trading decisions. What is a Footprint Chart? A footprint chart is a specialized visualization tool that displays market data beyond traditional candlestick or bar charts. It reveals how volume was distributed at each price level within a specific time frame, often segmented by bid and ask activity. This level of detail helps traders understand the
Top indicator   for MT5   providing alert and notification for symbols if any price freezes! Guys, try to buy at least one month version for testing purposes! This indicator displays the current time for multiple Forex pairs and alerts when there's a disconnection between broker and PC time. It'll be very help full for trading platforms administrator who are monitoring hundreds of symbols in a time.
Ultimate Double Top & Bottom (Pro Volume Matrix) Stop trading retail breakouts. Start trading Institutional Traps. The   Ultimate Double Top & Bottom   is not a standard, lagging pattern scanner. It is a highly advanced, non-repainting structural engine equipped with a proprietary   3-Leg Volume Matrix . Designed exclusively for Smart Money Concepts (SMC) and order flow traders, this indicator mathematically dissects the tick volume inside M and W patterns to reveal true institutional intent:  
Full detailed blogpost is here: https://www.mql5.com/en/blogs/post/770442 Abiroid Genesis Matrix Scanner: Complete User Guide This strategy uses four complementary indicators working together to identify trend momentum: TVI, CCI, T3, GannHiLo and when all four agree, the signal carries considerably more weight than any single indicator could on its own. This scanner takes that concept and applies it across multiple pairs and timeframes simultaneously, surfacing only the moments worth paying att
Samurai sun
Saiful Izham Bin Hassan
日本語訳(# 記号は一切使用しません): サムライ・サンは、現代の外国為替および貴金属市場向けに設計された高度なアルゴリズム取引システムです。堅牢なトレンドフォローエンジンと、ダイナミックな機関投資家グレードのリスク管理を組み合わせています。このシステムは、適応型トレーリングストップおよび部分決済メカニズムを通じてトレンドの捕捉を最大化しながら、資本を保護するように設計されています。 エキスパートアドバイザーは、移動平均、RSI、MACDを組み合わせて市場のノイズを除去し、高確率のエントリーポイントを特定します。完全に自動で動作し、日次パフォーマンスとリスク指標をリアルタイムで監視する対話型ダッシュボードを内蔵しています。 主な利点 多層リスク管理:固定ロット、リスクパーセンテージ、アンチマーチンゲール、またはボラティリティ調整済みサイジングから選択可能。 適応型取引管理:ATRベースのトレーリングストップ、段階的利益追跡、ブレークイーブン保護を搭載。 スプレッドおよびフリーズレベル保護:高ボラティリティまたはスプレッド拡大期間中に注文を保護する動的セーフティバッファを自動計算
Phantom Stat-Arb Scanner (Institutional Arbitrage) The "Unfair Advantage" Prop Firms & Hedge Funds Use Phantom Stat-Arb Scanner is an institutional-grade utility that brings Statistical Arbitrage (Stat-Arb) to the MetaTrader 5 platform. While retail traders struggle with single-pair indicators, Hedge Funds and Prop Firms thrive on "Mean-Reversion Divergence"—trading the spread between highly correlated assets. Our scanner tracks up to 20 currency pairs in real-time, building a dynamic c
PowerMagic
Pranav Himmataughade
The Pranavtrxx ( Author ) Levels Indicator is a precision-based trading tool designed to identify key price levels in the market, helping traders make informed entry and exit decisions. This indicator automatically plots dynamic support and resistance zones derived from historical price action, psychological price levels, and recent market structure. Whether you're a day trader or swing trader, this tool offers real-time market level tracking that adjusts with price movement, helping you pinpoin
このインジケーターは、離散ハートレー変換に基づいています。この変換を使用すると、財務時系列を処理するときにさまざまなアプローチを適用できます。このインジケーターの特徴は、その読み取り値がチャート上の1つのポイントではなく、インジケーター期間のすべてのポイントを参照していることです。 時系列を処理する場合、インジケーターを使用すると、時系列のさまざまな要素を選択できます。フィルタリングの最初の可能性は、このアプローチに基づいています。不要な高周波成分はすべて単に破棄されます。最初の図は、この方法の可能性を示しています。CutOffパラメーターを選択すると、元の時系列の詳細を選択できます(赤い線-主要な情報のみが残りますCutOff = 0、黄色-主要な最低周波数期間CutOff = 1 、青-最も高周波のノイズはすべて破棄されますCutOff = 4)。ただし、これが唯一の可能性ではありません。ノイズ成分は、追加のフィルタリングで抑制できます。 このインジケーターには両方のオプションが実装されています。そのパラメータは次のとおりです。 iPeriod-インジケーター期間 Shift-現
VWAP 機械学習バンド:トレーダーのための予測優位性 市場分析の次のレベルを解き放ちましょう。VWAP 機械学習バンドは、市場トレンド、動的なサポート/レジスタンス、そして高確率の取引シグナルに関する比類ない洞察を提供するように設計された、革新的な MQL5 インジケーターです。 このインジケーターは、独自の適応型機械学習アルゴリズムと、出来高加重平均価格(VWAP)の力を統合することで、従来の分析を超越します。価格の動きを予測し、市場の機会が完全に開花する前にそれらを捉えるのに役立つ、真の予測優位性を提供するように設計されています。 VWAP 機械学習バンドがあなたの頼れるインジケーターになる理由: インテリジェントな適応型 ML-VWAP コア: 真に動的な VWAP 計算を体験してください。当社の独自の機械学習アプローチは、リアルタイムのボラティリティと市場状況に基づいてスムージングを自動的に調整し、標準の VWAP よりもはるかに応答性が高く正確なトレンド表現を提供します。 独自の予測メカニズム: 「予測」パラメーターで先見の明を得ましょう。この最先端の機能は、ML で平滑化
Ai Scalper Pro
Dhiraj Shivprabhu Pattewar
1. Precision Entry Engine (The Edge) True-Swing Breakout Technology: The EA doesn't rely on lagging indicators. It maps live market structure, identifying localized "True Swings" (fractal highs and lows) to anticipate explosive momentum breakouts. Pre-Emptive Stacking: Anticipates major moves by placing resting Stop orders exactly at critical levels. When Gold breaks out, you are already in the trade. Daily Clean-Sweep: Every day at rollover (23:50), the bot automatically purges all resting o
XENON SUPERTRENDS : The Institutional Gold Standard for MT5 "Precision. Stability. Dominance. Experience the Truth in Every Tick." Welcome to the pinnacle of trend-following precision.   XENON SUPERTRENDS Master Edition   is not just an indicator; it is a high-performance analytical environment engineered for professional traders who demand absolute transparency and unshakeable accuracy. Specifically optimized for the world’s most volatile assets like   Gold (XAUUSD) ,   Global Indices (NASD
BY Strategy — Smart Money Concepts (Structure + Order Blocks + FVG) A complete Smart Money Concepts indicator for MT5 — market structure (BOS/CHoCH), dual-layer Order Blocks, Fair Value Gaps, and Strong/Weak level tracking. Works on all timeframes and instruments. BY Strategy — Smart Money Concepts brings institutional price action analysis directly to your MT5 chart. The indicator identifies how smart money moves markets by mapping market structure breaks, order block zones, imbalances, and key
KT Advance Ichimoku
KEENBASE SOFTWARE SOLUTIONS
KT Advance Ichimoku plot the arrows and provide alerts for the four trading strategies based on Ichimoku Kinko Hyo indicator. The generated signals can be filtered by other Ichimoku elements.  Four Strategies based on the Ichimoku Kinko Hyo 1.Tenkan-Kijun Cross Buy Arrow: When Tenkan-Sen cross above the Kijun-Sen. Sell Arrow: When Tenkan-Sen cross below the Kijun-Sen. 2.Kumo Cloud Breakout Buy Arrow: When price close above the Kumo cloud.  Sell Arrow: When price close below the Kumo cloud. 3.C
RSImaxmin
Carlos Andrés Moya Erazo
4.5 (10)
The indicator shows when there are overprice and divergences on the RSI. In addition, it has configurable alerts, dynamic overprice levels and a special “RSI cleaner” function. The indicator that automatically calculates the premium rates! RSImaxmin is an indicator based on the Relative Strength Index (RSI) oscillator that effectively identifies changes in price trends as it reflects the relative strength of bullish movements compared to bearish movements. It is widely used by traders to measur
ArroX Indicator Description ArroX is a technical analysis indicator designed for MetaTrader 5 platform. This indicator analyzes price movements and market trends to provide trading signals. Key Features: - Displays buy and sell arrows on the chart - Includes trend filtering capabilities - Provides multiple take profit levels - Shows market analysis information panel - Supports different signal sensitivity modes - Uses Bollinger Bands and moving averages for analysis - Includes stop loss calc
MTF VWAP Indicator - Quick Overview   This indicator shows you where institutional money is flowing across multiple timeframes using Volume Weighted Average Price (VWAP) to identify high-probability trading zones.     What It Actually Does:     1. Tracks Smart Money Levels: - Shows Daily, Weekly, and Monthly VWAP lines where big players (banks, funds) are trading - Tells you if price is above or below these key institutional levels - Shows distance from VWAP as a percentage (tells you how extend
Sapphire Strat Maker
Emanuel Cavalcante Amorim Filho
Sapphire Strat Maker  is an EA builder (Expert Advisor Builder or Strategy Maker) designed to make the creation of trading strategies easier . The goal is to provide the most intuitive, functional and fast environment to test and execute new strategies. Check out the free version here - Sapphire Strat Maker Alt . Also, check out the Emerald EA Builder : an easier to use EA builder, with a few more functionalities (trailing stop, limit orders, etc.). With this Expert Advisor you can create thousa
Quantum Smart Money PRO – Institutional Trading Indicator (MT5) Quantum Smart Money PRO is a premium institutional-grade trading indicator for MetaTrader 5, built using Smart Money Concepts (SMC), market structure analysis, liquidity detection, and momentum confirmation. This system is designed for traders who demand precision entries, high-probability setups, and clean chart clarity across Forex, Gold (XAUUSD), Indices, and Crypto. Core Trading Logic Quantum Smart Money PRO identifies hi
Zenith Leo Standard Zenith Leo Standard is an Expert Advisor designed for MetaTrader 4/5 and XAUUSD trading conditions. The product includes five predefined strategy configurations. Each configuration uses a different combination of entry logic, market filter, and risk management parameters. The objective of this product is to provide a structured execution framework for Gold trading. Users can select the configuration that best matches their testing results, risk preference, and trading environ
FREE
Boom 600 Precision Spike Detector The Boom 600 Precision Spike Detector is your ultimate tool for trading the Boom 600 market with precision and confidence. Equipped with advanced features, this indicator helps you identify potential buy opportunities and reversals, making it an essential tool for traders aiming to capture spikes with minimal effort. Key Features: Non-Repainting Signals: Accurate, non-repainting signals that you can trust for reliable trading decisions. Audible Alerts: Stay on t
Ultimate Breakout Sniper AI EA MT5 Breakthrough AI-Powered Gold Trading Expert Advisor WORKS on Bitcoin Also The Ultimate Breakout Sniper AI EA MT5 is an advanced automated trading system engineered for precision breakout trading on Gold (XAUUSD) — while remaining fully adaptable to indices, forex pairs, and cryptocurrencies. Built with institutional-grade logic, adaptive AI filters, and smart trade management, it aims to capture explosive price movements with maximum consistency and minimal
Develop this indicator for periods of 30 minutes or more, focus on getting market trends right and making sure they are met. MFOP v8.1 gets straight to the point: it scans the market and tells you exactly when there is enough strength to enter a trade. This indicator doesn't do magic, it uses mathematical algorithms to filter out market noise, not enter into false breakouts and show you clear BUY (blue arrow) and SELL (red arrow) opportunities. It is designed and optimized specifically to take
Smart Money Guardian The Ultimate Trade Manager & Equity Protection Expert Transform your manual trading with professional-grade discipline. Smart Money Guardian is not just a tool; it is your "Digital CEO" that manages every trade with mathematical precision, protecting your capital from emotional decisions and unexpected market volatility. ️ Why Choose Smart Money Guardian? Most manual traders fail due to a lack of exit discipline and poor risk management. This EA solves that by automating
Introducing the Forex Trading EA on Elliott Waves – Optimizing Profit with Minimal Capital The Elliott Wave Theory is one of the foundational principles of technical analysis in any market. Most traders aim to trade within the primary market trend. However, through AI-powered analysis, I have tested and validated that predicting exactly when a main trend begins and ends is virtually impossible. My machine-learning algorithms revealed an intriguing insight during research: there are specific wave
PROMOTIONAL PERIOD - ONLY 2 COPIES LEFT OF FIRST 10 BUYERS AT PRICE 300,00$!!! CHECK SCREENSHOTS AND COMMENTS FOR OUR STRATEGY RULES AND LIVE TRADES SIGNALS PULL IT BACK  is a revolutionary trading system and a complete strategy with advanced algorithm developed to detect the trend direction after a  PULLBACK , a  RETREACEMENT  or a  KEY LEVEL BOUNCE . The goal of this indicator is to get as many pips as possible from market trend. Following strictly the rules of the strategy, you can become a
このプロダクトを購入した人は以下も購入しています
Neuro Poseidon is a new indicator by Daria Rezueva. It combines precise trading signals with adaptive TP/SL levels - creating best possible trades as a result! Message me and get  Neuro Poseidon Assistant  as a gift to automize your trading process! What makes it stand out? 1. Proven profitability on all assets and timeframes 2. Only confirmed BUY and SELL signals present on the chart 3. Adaptive TP & SL levels generated by the software for each trade 4. Easy to understand - suitable for al
PrimeScalping is a powerful trading companion designed to generate high-probability entry signals with dynamic TP/SL/DP levels based on volatility. Built-in performance tracking shows win/loss stats, PP1/PP2 hits, and success rates — all updated live. Key Features: Buy/Sell signals with adaptive volatility bands Real-time TP/SL/DP levels based on ATR Built-in MA Filter with optional ATR/StdDev volatility Performance stats panel (Success, Profit/Loss, PP1/PP2) Alerts via popup, sound, push, or e
このインジケーターを購入された方には、以下の特典を 無料 で提供しています: 各トレードを自動で管理し、ストップロスとテイクプロフィットを設定し、戦略ルールに基づいてポジションを決済する補助ツール 「Bomber Utility」 様々な銘柄に合わせたインジケーターの設定ファイル(セットファイル) 「最小リスク」、「バランスリスク」、「待機戦略」 の3つのモードで使用できる Bomber Utility 用の設定ファイル このトレーディング戦略をすぐに導入・設定・開始できる ステップバイステップのビデオマニュアル ご注意: 上記の特典を受け取るには、MQL5のプライベートメッセージシステムを通じて販売者にご連絡ください。 オリジナルのカスタムインジケーター 「Divergence Bomber(ダイバージェンス・ボンバー)」 をご紹介します。これは、MACDのダイバージェンス(乖離)戦略に基づいた 「オールインワン」型のトレーディングシステム です。 このテクニカルインジケーターの主な目的は、価格とMACDインジケーターの間に発生するダイバージェンスを検出 し、将来の価格の動きを示す
ScalpPoint is a powerful trading companion designed to generate high-probability entry signals with dynamic TP/SL/DP levels based on volatility. Built-in performance tracking shows win/loss stats, PP1/PP2 hits, and success rates — all updated live. Key Features: Buy/Sell signals with adaptive volatility bands Real-time TP/SL/DP levels based on ATR Built-in MA Filter with optional ATR/StdDev volatility Performance stats panel (Success, Profit/Loss, PP1/PP2) Alerts via popup, sound, push, or emai
SignalTech is an unique fully rule based trading system delivers an Institutional approach for both Independent Traders and Prop Firm Challengers. Never Repaint. Push Notification available. No over-optimization. All the winning trades with chart setups are published on the comments page. 2026-05 4107 Pips (Until 05-29 NY Closed) 2026-04 2243 Pips 2026-03 2165 Pips 2026-02 2937 Pips 2026-01 2624 Pips 2025-12 1174 Pips It can generate signals with Buy/Sell Arrows, Push Notification (To Mobile) an
MasterTrend Indicator for MT5 A powerful trend-following and signal-evaluation tool MasterTrend   is a custom MT5 indicator that combines Moving Averages and ATR-based risk/reward logic to generate clear buy/sell signals. It visualizes dynamic SL/TP levels, evaluates past trade outcomes, and displays win/loss statistics in a clean on-chart panel. Key features include: Buy/Sell signals based on MA crossovers ATR-based SL/TP1/TP2/TP3 levels with visual lines and labels Signal outcome tracking wit
Quantum TrendPulse を ご紹介します。これは、   SuperTrend   、   RSI   、および Stochastic のパワーを 1 つの包括的なインジケーターに組み合わせて、取引の可能性を最大限に引き出す究極の取引ツールです。精度と効率を求めるトレーダー向けに設計されたこのインジケーターは、市場のトレンド、勢いの変化、最適なエントリー ポイントとエグジット ポイントを自信を持って特定するのに役立ちます。 主な特徴: SuperTrend 統合: 現在の市場動向に簡単に追従し、収益性の波に乗ることができます。 RSI精度: 買われすぎと売られすぎのレベルを検出し、市場の反転のタイミングに最適で、SuperTrendのフィルターとして使用されます。 確率的精度: 確率的振動を活用して、変動の激しい市場で隠れたチャンスを見つけます。SuperTrend のフィルターとして使用されます。 マルチタイムフレーム分析:   M5 から H1 または H4 まで、さまざまなタイムフレームで市場を常に把握します。 カスタマイズ可能なアラート: カスタム取引条件が満たされ
ご紹介     Quantum Breakout PRO は 、ブレイクアウト ゾーンの取引方法を変革する画期的な MQL5 インジケーターです。 13年以上の取引経験を持つ経験豊富なトレーダーのチームによって開発されました。     クォンタム ブレイクアウト プロ   は、革新的でダイナミックなブレイクアウト ゾーン戦略により、あなたのトレーディングの旅を新たな高みに押し上げるように設計されています。 クォンタム ブレイクアウト インジケーターは、5 つの利益ターゲット ゾーンを備えたブレイクアウト ゾーン上のシグナル矢印と、ブレイクアウト ボックスに基づいたストップロスの提案を提供します。 初心者トレーダーにもプロのトレーダーにも適しています。 量子EAチャネル:       ここをクリック 重要!購入後、インストールマニュアルを受け取るためにプライベートメッセージを送ってください。 推奨事項: 時間枠: M15 通貨ペア: GBPJPY、EURJPY、USDJPY、NZDUSD、XAUUSD アカウントの種類: ECN、Raw、またはスプレッドが非常に低い R
Azimuth Pro
Ottaviano De Cicco
5 (7)
Azimuth Pro V2:MT5向けシンセティック・フラクタル構造分析と確認済みエントリー 概要 Azimuth Pro は Merkava Labs によるマルチレベルスイング構造インジケーターです。4つのネストされたスイングレイヤー、スイングアンカーVWAP、ABCパターン検出、3タイムフレーム構造フィルタリング、そして確定バーでの確認済みエントリー — 1つのチャートで、ミクロスイングからマクロサイクルまでを網羅するワークフロー。 これはブラインドシグナル製品ではありません。ロケーション、コンテキスト、タイミングを重視するトレーダーのための構造ファーストワークフローです。 V2発売記念オファー — Azimuth Pro V2をUSD 399で(次の100本)。最終価格:USD 499。 1. V2での変更点 シンセティック・マルチタイムフレームエンジン 上位タイムフレーム分析をMeridian Proと同じ独自のシンセティックアーキテクチャで一から再構築。よりクリーンなHTFコンテキスト、安定したライブ動作、従来のMTF同期問題なし。シンセティックエンジンは 固定比率タ
Meridian Pro
Ottaviano De Cicco
5 (2)
Meridian Pro 2.00:MT5向けプロ仕様マルチタイムフレーム・トレンドマトリクス Meridian Pro 2.00 は、MetaTrader 5 向けのプロ仕様の適応型トレンドマトリクスです。オリジナルの Meridian トレンドエンジン、クリーンなチャート ribbon、確定足ベースのシグナル矢印、8時間足 dashboard、Fuel momentum、weighted consensus、synthetic HTF processing、そしてチャート上に直接表示される上位足コンテキストラインを統合します。 目的はシンプルです。現在のトレンド、マルチタイムフレーム構造、強度、momentum、EA-ready 状態を、複数チャートに無関係なインジケータを重ねるのではなく、1つの整理された workflow で読むことです。 Meridian Pro の違い 1つの適応型エンジン - 同じ volatility-aware Meridian ロジックを M1 から W1 まで適用します。 Synthetic HTF architecture - 上位足行は下位足デ
SmartScalping is a powerful trading companion designed to generate high-probability entry signals with dynamic TP/SL/DP levels based on volatility. Built-in performance tracking shows win/loss stats, PP1/PP2 hits, and success rates — all updated live. Key Features: Buy/Sell signals with adaptive volatility bands Real-time TP/SL/DP levels based on ATR Built-in MA Filter with optional ATR/StdDev volatility Performance stats panel (Success, Profit/Loss, PP1/PP2) Alerts via popup, sound, push, or e
ARIPoint
Temirlan Kdyrkhan
1 (1)
ARIPoint is a powerful trading companion designed to generate high-probability entry signals with dynamic TP/SL/DP levels based on volatility. Built-in performance tracking shows win/loss stats, PP1/PP2 hits, and success rates all updated live. Key Features: Buy/Sell signals with adaptive volatility bands Real-time TP/SL/DP levels based on ATR Built-in MA Filter with optional ATR/StdDev volatility Performance stats panel (Success, Profit/Loss, PP1/PP2) Alerts via popup, sound, push, or email Cu
この製品は 2026 年の市場向けに更新され、最新の MT5 ビルドに最適化されています。 価格更新のお知らせ: Smart Price Action Concepts は現在 $200 で提供されています。 次の 30 件の購入 後、価格は $299 に上がります。 特別オファー: 購入後、私にプライベートメッセージを送ることで、 無料ボーナス + ギフト を受け取ることができます。 まず、このトレーディングツールはリペイントなし、再描画なし、遅延なしのインジケーターであり、プロフェッショナルな取引に最適であることを強調しておきます。 Online course , and manual Smart Price Action Concepts Indicator は、初心者から経験豊富なトレーダーまで使える非常に強力なツールです。20 種類以上の便利なインジケーターを 1 つにまとめ、Inner Circle Trader Analysis や Smart Money Concepts Trading Strategies などの高度な取引アイデアを組み合わせています。このインジケ
MasterTrend Indicator for MT5 A powerful trend-following and signal-evaluation tool MasterTrend   is a custom MT5 indicator that combines Moving Averages and ATR-based risk/reward logic to generate clear buy/sell signals. It visualizes dynamic SL/TP levels, evaluates past trade outcomes, and displays win/loss statistics in a clean on-chart panel. Key features include: Buy/Sell signals based on MA crossovers ATR-based SL/TP1/TP2/TP3 levels with visual lines and labels Signal outcome tracking wit
RelicusRoad Pro: 定量的市場オペレーティングシステム 【期間限定】無制限アクセス 70% OFF - 2,000人超のトレーダーと共に なぜ多くのトレーダーは「完璧な」インジケーターを使っても失敗するのでしょうか? それは、文脈を無視して 単一の概念 だけでトレードしているからです。文脈のないシグナルは単なるギャンブルです。勝ち続けるには、 根拠の重なり(コンフルエンス) が必要です。 RelicusRoad Proは単なる矢印インジケーターではありません。完全な 定量的市場エコシステム です。独自のボラティリティモデリングを用いて、価格が推移する「適正価値の道(Fair Value Road)」をマッピングし、ノイズと真の構造的ブレイクを判別します。 推測はやめましょう。機関投資家レベルの「ロード・ロジック」でトレードを。 コアエンジン:「Road」アルゴリズム システムの中心となる Road Algo は、市場環境にリアルタイムで適応するダイナミックなボラティリティチャネルです。 安全ライン(平衡点) と、価格が数学的に反転しやすい 拡張レベル を投影します。 Si
マーケットメーカーのためのツール。 Meravith は次の機能を提供します: すべての時間足を分析し、現在有効なトレンドを表示します。 強気と弱気の出来高が等しくなる流動性ゾーン(出来高均衡)を強調表示します。 異なる時間足のすべての流動性レベルをチャート上に直接表示します。 テキスト形式の市場分析を生成し、参考情報として表示します。 現在のトレンドに基づいて目標値、サポートレベル、ストップロスを計算します。 取引のリスクリワード比を算出します。 口座残高に基づいてポジションサイズを計算し、潜在的な利益を推定します。 また、市場に大きな変化があった場合には警告を表示します。 インジケーターの主要ライン: 強気/弱気の出来高エグゾーストライン ― 目標値として機能します。 市場のトレンドを示すライン。市場が強気か弱気かによって色が変わり、トレンドのサポートとして機能します。主にその色が市場センチメントを示します。 出来高均衡ライン(Eq)。Eq(Volume Equilibrium)ラインはシステムの中核です。これは買い手と売り手の出来高のバランスポイントを表します。市場の流動性を示し
MetaForecast M5
Vahidreza Heidar Gholami
5 (3)
MetaForecastは、価格データのハーモニクスに基づいて、どんな市場の未来を予測し視覚化します。市場が常に予測可能ではありませんが、価格にパターンがある場合、MetaForecastは可能な限り正確な未来を予測できます。他の類似製品と比較して、MetaForecastは市場のトレンドを分析することでより正確な結果を生成することができます。 入力パラメータ Past size (過去のサイズ) MetaForecastが将来の予測を生成するために使用するバーの数を指定します。モデルは選択したバー上に描かれた黄色の線で表されます。 Future size (将来のサイズ) 予測すべき将来のバーの数を指定します。予測された将来は、ピンクの線で表示され、その上に青い回帰線が描かれます。 Degree (程度) この入力は、MetaForecastが市場で行う分析のレベルを決定します。 Degree 説明  0 Degree 0の場合、価格の全てのピークや谷、そして詳細をカバーするために、「Past size」の入力に大きな値を使用することが推奨されています。  1 (推奨) Degre
ACB Breakout Arrows MT5
KEENBASE SOFTWARE SOLUTIONS
3.5 (2)
ACB Breakout Arrows インジケーターは、特別なブレイクアウトパターンを検出することで、市場における重要なエントリーシグナルを提供します。このインジケーターはチャートを常に監視し、一方向に勢いが定着してきた段階で、主要な値動きの直前に精度の高いエントリーシグナルを表示します。 マルチシンボル・マルチタイムフレームスキャナーはこちらから - ACB Breakout Arrows MT5 用スキャナー 主な機能 ストップロスとテイクプロフィットの水準が自動で表示されます。 すべての時間足のブレイクアウトシグナルを監視できるMTFスキャナーダッシュボードを搭載。 デイトレーダー、スイングトレーダー、スキャルパーに最適。 シグナル精度を高めるための最適化されたアルゴリズム。 損益分岐点やスキャルピングターゲットに使える特別なライン(クイックプロフィットライン)。 勝率、平均利益などのパフォーマンス分析メトリクスを表示。 リペイントなし。 トレードの確認 - 低確率のトレードを除外するために ACB Trade Filter インジケーター を使用してください。 強い買い:
多くの矢印インジケーターは、シグナルだけを表示して、その後の判断をすべてトレーダーに任せてしまいます。KT Alpha Hunter Arrows は、完整なトレードプランをチャート上に提示します。 各シグナル矢印が表示されるたびに、エントリーライン、ストップロス、4つのテイクプロフィット水準、そして現在の銘柄と時間足が今トレードに値するかどうかを示すリアルタイムのエッジ判定が、すでに描画された状態で表示されます。付属の Trade Manager EA は、あなたが手動でエントリーした後の実行管理を担当し、相場が荒れて判断がぶれやすい場面でも規律あるトレードを保ちやすくします。リペイントなし。確定足シグナルのみ。Forex、ゴールド、指数、その他あなたが取引するあらゆる銘柄に対応します。 主な機能 リペイントしない買い矢印と売り矢印を、足の確定後にのみ表示。 各シグナルに、エントリーライン、構造的ストップロス、4つのテイクプロフィット水準を表示。 Edge Dashboard が、現在のチャートで買いセットアップと売りセットアップを別々に評価。 判定システム:No Edge、Mar
BTMM State Engine Pro is a MetaTrader 5 indicator for traders who use the Beat The Market Maker approach: Asian session context, kill zone timing, level progression, peak formation detection, and a multi-pair scanner from a single chart. It combines cycle state logic with a built-in scanner dashboard so you do not need the same tool on many charts at once. What it does Draws the Asian session range; session times can follow broker server offset or be set in inputs. Tracks level progression (L
UZFX {SSS} スキャルピング・スマートシグナル MT5は、変動の激しい市場において正確かつリアルタイムのシグナルを求めるスキャルパー、デイトレーダー、スイングトレーダー向けに設計された、リペイントしない高性能な取引インジケーターです。(UZFX-LABS)によって開発されたこのインジケーターは、価格行動分析、トレンド確認、スマートフィルタリングを組み合わせることで、すべての通貨ペアおよび時間軸において、高確率の売買シグナルを生成します。 推奨* 最適な時間足:15分足以上。 {1時間足}が私のお気に入りです。そして、その成果は驚くべきものです...! 注:{ LTL 164343 }インジケーターと組み合わせることで、シグナルの勝率を高めることができます。 LTLシグナルでトレンドを判断し、SSSシグナルをエントリーシグナルとして活用してください。 このアプローチにより勝率が最大化され、誤ったシグナルの発生を防ぐことができます。 主な機能 スマートシグナル検出 – 強力なトレンド反転や継続パターンを正確に特定します。 マルチタイムフレーム・スキャルピング – すべての時間
Current event:  https://c.mql5.com/1/326/A2SR2025_NoMusic.gif MT5向けA2SR インジケーター:自動実需給(S/R)。 + 取引商品。 Product description in English here. --   Guidance   : -- at   https://www.mql5.com/en/blogs/post/734748/page4#comment_16532516 -- and  https://www.mql5.com/en/users/yohana/blog 強力で信頼性が高く、時間を節約。よりスマートな取引判断を実現。 + EA互換オブジェクト。 主な利点 先行する実SRレベル(遅延やリペイントなし) 2014年以来、MT4で長年にわたり信頼性が実証されてきたA2SRが 、MetaTrader 5でも利用可能になりました。 価格がサポートレベルとレジスタンスレベルに到達する前に、実際のサポートレベルとレジスタンスレベルを特定できる、リペイントなしの先行インジケーターにより、トレー
ARICoin is a powerful trading companion designed to generate high-probability entry signals with dynamic TP/SL/DP levels based on volatility. Built-in performance tracking shows win/loss stats, PP1/PP2 hits, and success rates all updated live. Key Features: Buy/Sell signals with adaptive volatility bands Real-time TP/SL/DP levels based on ATR Built-in MA Filter with optional ATR/StdDev volatility Performance stats panel (Success, Profit/Loss, PP1/PP2) Alerts via popup, sound, push, or email Cust
Trend Forecaster – Since 2023. The Trend Forecaster indicator utilizes a unique proprietary algorithm to determine entry points for a breakout trading strategy. The indicator identifies price clusters, analyzes price movement near levels, and provides a signal when the price breaks through a level. The Trend Forecaster indicator is suitable for all financial assets, including currencies (Forex), metals, stocks, indices, and cryptocurrencies. You can also adjust the indicator to work on any time
ICT PO3 (Power of 3) AMD Protocol Framework Indicator True Time & Structure Integration   |  Non-Repainting | Real-Time  | Multi-Asset  | MT4 Version Available Full Setup Guide & Strategy Playbook: https://www.mql5.com/en/blogs/post/768683 MT4 Version: https://www.mql5.com/en/market/product/171742 Indicator Overview The ICT PO3 AMD Protocol Framework is a complete structural overlay for MetaTrader 5 that maps the True Daily Cycle directly onto your lower-timeframe execution chart. It projects
Precision Spike Detector
Francisco Mandomo Simbine
5 (1)
Precision Spike Detector V3 – Institutional-Grade AI Trading System Attention: The price increases by US$50 for every 10 purchases.  Final price: US$599 Precision Spike Detector V3   is a   state-of-the-art, institutional-grade market analysis system   for   MetaTrader 5 , designed to detect   high-probability market movements   in synthetic indices such as   Boom, Crash, GainX, and PainX . After purchase, please contact me through the MQL5 messaging system to receive the order management tool
優れたテクニカルインジケーター「Grabber」をご紹介します。これは、すぐに使える「オールインワン」トレーディング戦略として機能します。 ひとつのコードに、市場のテクニカル分析ツール、取引シグナル(矢印)、アラート機能、プッシュ通知が強力に統合されています。 このインジケーターを購入された方には、以下の特典を無料で提供します: Grabberユーティリティ:オープンポジションを自動で管理するツール ステップバイステップのビデオマニュアル:インジケーターのインストール、設定、取引方法を解説 カスタムセットファイル:インジケーターをすばやく自動設定し、最大限の成果を出すための設定ファイル 他の戦略はもう忘れてください!Grabberだけが、あなたを新たなトレードの高みへと導いてくれるのです。 Grabber戦略の主な特徴: 推奨タイムフレーム:M5〜H4 対応通貨ペア・資産:どれでも使用可能ですが、私が実際に検証した以下を推奨します(GBPUSD、GBPCAD、GBPCHF、AUDCAD、AUDUSD、AUDSGD、AUDCHF、NZDUSD、NZDCAD、EURCAD、EURUSD、E
Ziva LSE System
Hassan Abdullah Hassan Al Balushi
ZIVA LSE System A Professional Liquidity & Structure Execution Framework Executive Overview ZIVA LSE System is a professionally engineered analytical framework designed to interpret market behavior through structural logic and liquidity dynamics. It is not positioned as a conventional indicator. Rather, it functions as a structured execution environment that organizes price action into a clear, disciplined decision-making model. The system is built to deliver consistency, clarity, and controlled
OmniSync Projection
Antonio-alin Teculescu
5 (1)
Chronos Fractal Engine is an innovative price projection indicator for MetaTrader 5, designed to transform your technical analysis by intelligently identifying and projecting historical price patterns. Built upon an advanced correlation algorithm and the fractal principles of the market, this powerful tool visualizes potential future price movements, giving you a unique edge in your trading decisions. What is Chronos Fractal Engine? At its core, the Chronos Fractal Engine employs a sophisticat
AriX
Temirlan Kdyrkhan
1 (4)
AriX Indicator for MT5 A powerful trend-following and signal-evaluation tool AriX is a custom MT5 indicator that combines Moving Averages and ATR-based risk/reward logic to generate clear buy/sell signals. It visualizes dynamic SL/TP levels, evaluates past trade outcomes, and displays win/loss statistics in a clean on-chart panel. Key features include: Buy/Sell signals based on MA crossovers ATR-based SL/TP1/TP2/TP3 levels with visual lines and labels Signal outcome tracking with real-time stat
作者のその他のプロダクト
Smart OrderBlocks Indicator for MetaTrader 5 A Differentiated Vision and a Bit of Price Action! Smart OrderBlocks is an advanced indicator that reveals market structure from a unique perspective through intelligent supply and demand zone detection. Key Features OrderBlocks Detection Internal OrderBlocks : Capture micro-level market dynamics Swing OrderBlocks : Identify macro market momentum trends Advanced Volatility Intelligence Volatility detection using: Adaptive Average True Range (AT
FREE
SuperTrendAshi
Fillipe Dos Santos
5 (2)
SuperTrendAshi Description SuperTrendAshi is an advanced and optimized version of the SuperTrend indicator that incorporates Heikin Ashi calculation to provide smoother and more reliable signals. This unique combination results in an indicator that reduces false signals and identifies trends with greater precision. Key Features Combines the strength of SuperTrend with Heikin Ashi smoothing More stable signals with less noise Intuitive color system (Aqua for uptrend, Magenta for downtrend) Custo
FREE
Pivot Points Levels Description The Pivot Points Levels indicator is an advanced and comprehensive tool for technical analysis based on support and resistance levels calculated from pivot points. This free indicator combines 6 different calculation methods with support for multiple timeframes, offering a robust solution for identifying key price reversal and continuation areas. Key Features 6 Calculation Methods : Traditional, Fibonacci, Woodie, Classic, DeMark (DM), and Camarilla Multi-Timefram
FREE
An anchored Vwap With Arrows is an indicator that includes a moving average weighted by volume that allows you to plot on a bottom or a top. Usually banks and institutions measure an average price, this average price is a price range where they agree to make a trade. Using the logic of anchored vwap with arrows it is possible to understand that if the price breaks the vwap it means that someone with enough buying and selling power has lost control. You can use vwap anchored with arrows in any ti
MovingRegressionBands - Polynomial Regression Indicator with Adaptive Bands Description MovingRegressionBands is an advanced technical indicator that combines polynomial regression with adaptive bands to identify market trends and reversal points. Using sophisticated mathematical calculations, the indicator provides a more precise view of price movements through a higher-order regression model. Key Features Configurable polynomial regression order for greater accuracy Adaptive bands based on mod
FREE
through this indicator you can make  analysis and also can to distinguish possible weakness or continuous strength  on  price, it is an indicator initially developed by David Weis. This version is for the meta trader 5 platform. The Weis Waves indicator is based on volume and is aligned with the price, being able to find not only possible strenght and weakness, but also possible divergences between price and volume, bringing an interesting analysis between both.
The result as the name explain, displays the result of a swing. Sometimes weis waves show a big effort, but a little result... The weis waves result is a better revelation about the volume, if united with weis waves. it is a volume indicator, but it is different from a conventional volume indicator, this indicator came from the wyckoff method, if you use the result you will have a different view of the market, regardless of which asset is operating.
this indicator is essential when it's necessary to identify  trade locations on  chart. You can initially get an idea of ​​the candlestick's direction with other graphical tools and then identify the best regions with the DMP. The Dash Market Profile is a statistical indicator, that mean it is an indicator that is based on mathematical calculations, identifying the best regions and observing the candles of the best regions to trade. The financial market is not as easy as it seems, it is necessar
CandleVolume is an indicator that colors bars according to increasing or decreasing volume. You can use it to identify strategic regions of the chart and complete an analysis. White means low volume, yellow means medium volume and red means climax volume. It is a recommended indicator if you like to interpret market contexts and understand how market cycles work.
BetterVolumeTick it is a volume indicator. It marks the volume regions where there was a great aggression, also shows the volume intensity. Yellow means low volume, normal activity. Orange means activity with a pretty amount of volume. Red means ultra high volume. This indicator combined with the price chart will give you another view of the market context.
Hurst Cycles Diamonds Description This indicator is an alternative version inspired by the pioneering work of David Hickson and the Hurst Cycles Notes indicator developed by Grafton. The main objective is to provide a clear and intuitive view of the Hurst cycles. Credits Original Concept : David Hickson - Hurst Cycles Theory Inspiration : Grafton - Hurst Diamond Notation Pivots Alternative Version : Fillipe dos Santos Main Features Identifies and displays pivots in multiple time cycles Visual t
Moving Regression Bands EA  Description The Moving Regression Bands EA is a robust automated trading system that uses polynomial regression analysis to identify market opportunities. Based on moving regression bands, this EA offers a mathematical and statistical approach to trading. Key Features Advanced Analysis : Uses polynomial regression to calculate trends and volatility bands Operational Flexibility : Normal and Inverse modes for different market strategies Risk Management : Configurable S
SuperTrendAshi EA - Automated Trading System A versatile Expert Advisor based on the SuperTrend indicator adapted for Heikin Ashi candles Key Features: Automated trading system combining SuperTrend precision with Heikin Ashi smoothing Flexible operation with multiple trading modes Advanced risk management with dynamic Trailing Stop Intuitive interface with customizable parameters Detailed Features: Operation Modes Stop Loss and Take Profit Mode: Operates with defined targets Signal-Only Mode: F
Smart Order Blocks EA - Automated Trading with OrderBlocks Description The Smart Order Blocks EA is an advanced Expert Advisor designed to identify, visualize, and automatically trade based on Order Block formations - a powerful concept used by many traders. This tool is quite comprehensive, capable of detecting market opportunities with precision and executing strategies autonomously. What are Order Blocks? Order Blocks are specific areas on the chart that represent zones of support and resista
フィルタ:
レビューなし
レビューに返信