Energy X
- Indicadores
-
Chi Sum Poon
 This is Gary Poon
I will first study of trading on demo account then to real account.
This is my only account on MQL5.com, I will not create another one for now.
If there are any queries or concerns, please refer to the broker details from my signals.
Thank you. - Versão: 1.0
- Ativações: 5
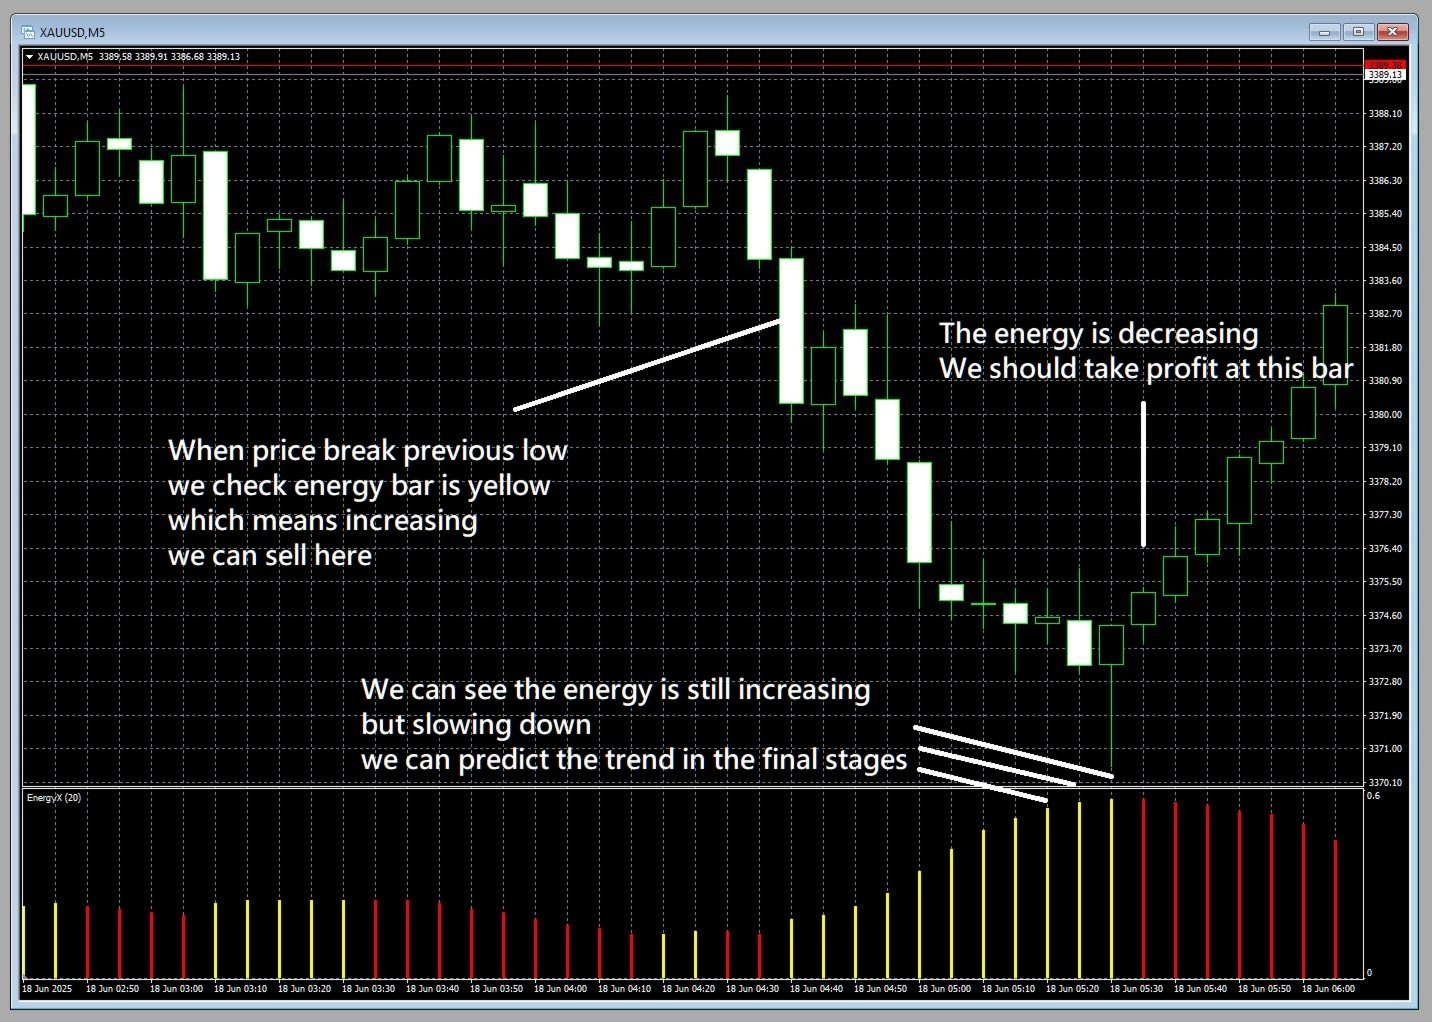
EnergyX Indicator
EnergyX is a unique tool that visualizes the "energy" of the market in a separate window. It helps you quickly see when energy is rising or falling, making it easier to spot potential trading opportunities.
- Yellow bars show when energy is increasing.
- Red bars show when energy is decreasing.
How to Use:
- When price is approaching a resistance level:
- If energy is high and increasing (yellow), there is a higher chance the price will break the resistance. You may consider a buy.
- If energy is low or decreasing (red), there is a lower chance the price will break the resistance. You may consider a sell.
- When price is approaching a support level:
- If energy is high and increasing (yellow), there is a higher chance the price will break the support. You may consider a sell.
- If energy is low or decreasing (red), there is a lower chance the price will break the support. You may consider a buy.
- If you already have an order and it is in profit:
- If energy is increasing (yellow), you can keep holding your position.
- If energy is decreasing (red), you may consider taking profit, partial profit, or setting a trailing stop.
Check the energy level to see if the market is gaining or losing momentum. Use this information to support your trading decisions. Simple, clear, and effective—add EnergyX to your chart and watch the market’s energy in action!