Market Structure Signal

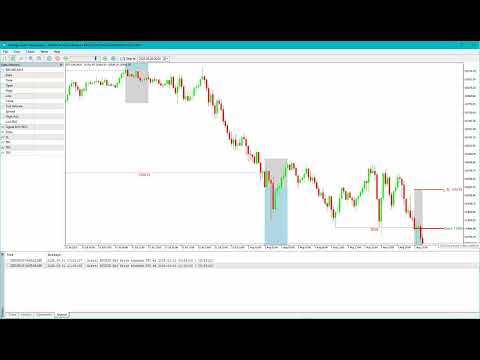
The Market Structure Signal indicator is designed to detect Change of Character (CHoCH) and Break of Structure (BOS) in price action, helping traders identify potential trend reversals or continuations. It combines market structure analysis with volatility (ATR) to highlight possible risk/reward zones, while also supporting multi-channel alerts so that no trading signal is missed.

Interpretation

Trend Analysis: The indicator’s trend coloring, combined with BOS and CHoCH detection, provides an immediate view of market direction. Rising structures indicate bullish momentum, while falling structures signal bearish momentum. CHoCH markers highlight potential trend reversals or significant liquidity sweeps.

Volatility and Risk Assessment: ATR-based calculations determine stop-loss distances and target levels, giving a quantitative measure of risk relative to market volatility. Wide ATR readings indicate periods of high price fluctuation, whereas narrow readings suggest consolidation and reduced risk exposure.

Market Structure Insights: By monitoring swing highs and lows alongside break confirmations, traders can identify where institutional players are likely active. Areas with multiple structural breaks or overlapping targets can indicate liquidity hotspots, potential reversal zones, or areas of market congestion.

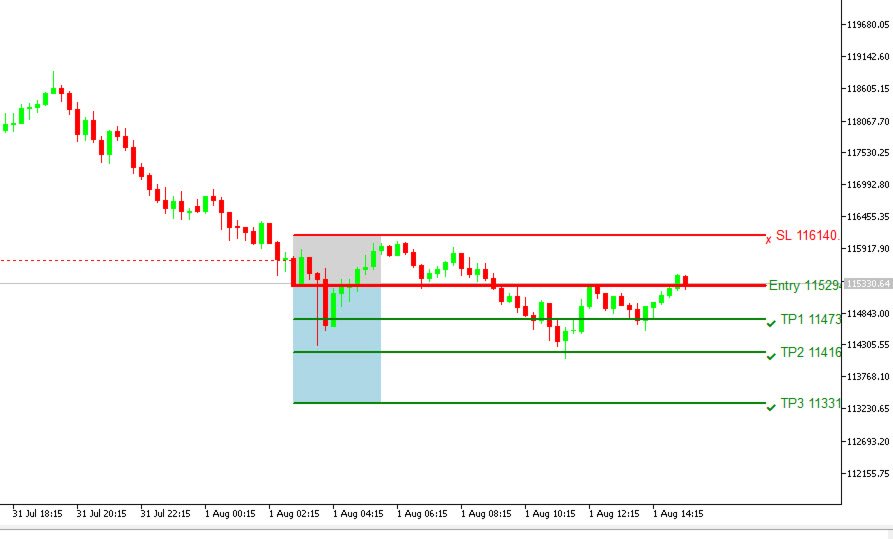
Trade Management: The built-in trade zones allow traders to visualize entry, risk, and reward simultaneously. Progressive targets (TP1, TP2, TP3) reflect incremental profit-taking strategies, while dynamic stop-loss levels help preserve capital during adverse moves.

Input Parameters

SETTING

Structure Period  (default 20) → Number of periods to detect swing highs/lows and build market structure.
Display Structure  (true/false) → Enable/disable structure visualization on chart.
Volatility (ATR) period  (default 14) → ATR period for volatility measurement.
Volatility Multiplier  (default 2) → ATR multiplier for risk/reward zone projection.

    STYLES

    Bullish  (default Green) → Color for bullish structure.
    Bearish  (default Red) → Color for bearish structure.
    Structure style (line style: dashed/solid/...) → Line style for market structure.
    Target risk  (default LightGray) → Color for risk area.
    Target reward  (default LightBlue) → Color for reward area.

      ALERTS

      Alert  (true/false) → Enable/disable on-screen alerts when signal detected.
      Send Notification  (true/false) → Send MT5 push notification.
      Send Email (true/false) → Send signal via email.

        Core Features

        CHoCH & BOS Detection → Marks breakouts and structural shifts on chart.
        Risk/Reward Analysis → Uses ATR to define projected zones for trade management.
        Customizable Display → Flexible color, line style, and visibility options.
        Multi-channel Alerts → Never miss a signal with built-in support for MT5, Email.

           Buffers for EA Integration

          To allow Expert Advisors (EAs) to read signals programmatically, the indicator provides buffers:

          Buffer 0 → 1  when a BUY is detected, -1  when a SELL is detected.
          Buffer 1 → Entry price
          Buffer 2 → Stoploss price
          Buffer 3 → Takeprofit 1 Price
          Buffer 4 → Takeprofit 2 Price
          Buffer 5 → Takeprofit 3 Price

            These buffers make it possible for an EA to automatically read market structure signals and execute trades accordingly.

            The Market Structure Signal transforms complex market behavior into an actionable visual framework. By combining market structure analysis, liquidity tracking, ATR-based risk/reward mapping, and a dynamic trade dashboard, it provides a multidimensional view of the market. Traders can focus on execution, interpret trends, and evaluate overextensions or reversals without relying on guesswork. The indicator is suitable for scalping, intraday, and swing strategies, offering a comprehensive system for understanding and trading alongside institutional participants.

            Produtos recomendados
            Buy Sell Smart
            Syamsurizal Dimjati
            BUY and SELL smart The BUY and SELL Smart Indicator is a next-generation trading tool engineered for precision scalpers, intraday strategists, and professional analysts who demand both speed and clarity in market visualization. It seamlessly integrates smart candle-based analytics, adaptive ATR logic, and real-time economic event awareness — giving you a fully synchronized view of market volatility and momentum. Through an elegant and optimized interface, FlashScalp delivers   instant signal fee
            Volume Profile V6
            Andrey Kolesnik
            4.67 (3)
            Indicador de perfil de volume de mercado + oscilador inteligente. Funciona em praticamente todos os instrumentos — pares de moedas, ações, futuros, criptomoedas, tanto em volumes reais quanto em ticks. É possível configurar a definição automática do intervalo de construção do perfil (por exemplo, por uma semana ou um mês, etc.), bem como definir o intervalo manualmente movendo os limites (duas linhas verticais: vermelha e azul). É exibido na forma de um histograma. A largura do histograma em um
            Sinas
            Yvan Musatov
            The Sinas indicator for Forex can be used both for pips on short periods and for long-term trading. It tracks the market trend, ignoring sharp market fluctuations and noise around the average price. Catches the trend and shows favorable moments for entering the market with arrows. The indicator implements a type of technical analysis based on the idea that the market is cyclical in nature.
            Hi Traders, MTF FVGs (Extend) – Smart Supply & Demand Zones. This indicator automatically identifies bullish (demand) and bearish (supply) FVG zones on your chart using multi-timeframe analysis. Zones are displayed as rectangles with optional midlines, helping you visualize key support and resistance levels more clearly. Key Features: Multi-timeframe support: detect zones on the current or higher timeframe Adjustable lookback period and minimum zone size Limit the number of visible bullish and
            Cansado de traçar linhas de suporte e resistência? A Resistência de suporte é um indicador de período múltiplo que detecta e plota automaticamente linhas de suporte e resistência no gráfico com um toque muito interessante: conforme os níveis de preços são testados ao longo do tempo e sua importância aumenta, as linhas se tornam mais espessas e mais escuras. [ Guia de instalação | Guia de atualização | Solução de problemas | FAQ | Todos os produtos ] Melhore sua análise técnica da noite para o d
            RBreaker
            Zhong Long Wu
            RBreaker Gold Indicators é uma estratégia de negociação intradiária de curto prazo para futuros de ouro que combina duas abordagens: o seguimento de tendência e as reversões intradiárias. Ela permite capturar lucros durante mercados em tendência e também realizar lucros oportunamente e operar na direção oposta quando o mercado se reverte. Esta estratégia foi classificada por 15 anos consecutivos entre as dez estratégias de negociação mais lucrativas pela revista americana Futures Truth. Ela pos
            Cumulative delta indicator As most traders believe, the price moves under the pressure of market buying or selling. When someone redeems an offer standing in the cup, the deal is a "buy". If someone pours into the bid standing in the cup - the deal goes with the direction of "sale". The delta is the difference between purchases and sales. A cumulative delta - the difference between the cumulative sum of purchases and sales for a certain period of time. It allows you to see who is currently contr
            # DRAWDOWN INDICATOR V4.0 - The Essential Tool to Master Your Trading ## Transform Your Trading with a Complete Real-Time Performance Overview In the demanding world of Forex and CFD trading, **knowing your real-time performance** isn't a luxury—it's an **absolute necessity**. The **Drawdown Indicator V4.0** is much more than a simple indicator: it's your **professional dashboard** that gives you a clear, precise, and instant view of your trading account status. --- ## Why This Indicator
            "Impulses and Corrections 5" is created to help traders navigate the market situation. The indicator shows multi-time frame upward and downward "Impulses" of price movements. These impulses are the basis for determining the "Base" , which is composed of zones of corrections of price movements, as well as "Potential" zones for possible scenarios of price movement. Up and down impulses are determined based on a modified formula of Bill Williams' "Fractals" indicator. The last impulse is always "U
            Momentum Wave Analyzer
            AL MOOSAWI ABDULLAH JAFFER BAQER
            Momentum Wave Analyzer Unlock the True Force of the Market with Momentum Wave Analyzer Are you looking for an indicator that goes beyond simple buy and sell signals? Do you want to not only identify the trend but also measure its underlying strength and conviction? The Momentum Wave Analyzer is a sophisticated yet intuitive tool designed to give you a clear, visual representation of market momentum, helping you catch powerful moves and avoid weak signals. For just $30, you can equip your tradin
            TRI Visualizer
            Yoshimi Mon 三 Ura
            TRI Visualizer MT5 – Thermodynamic Market Analysis Overview The TRI (Thermal Range Indicator) Visualizer Enhanced is a rare market analysis indicator that goes beyond conventional technical analysis, applying principles of thermodynamics from physics. It interprets market price fluctuations as “thermodynamic energy,” enabling the highly accurate detection of subtle market changes that are often overlooked. Innovative Mechanisms 1. Dual Calculation Engines Classic TRI Mode Formula: |Close
            This simple indicator helps defining the most probable trend direction, its duration and intensity, as well as estimate the possible range of price fluctuations. You can see at a glance, at which direction the price is moving, how long the trend lasts and how powerful it is. All this makes the indicator an easy-to-use trend trading system both for novice and experienced traders. Parameters Period - averaging period for the indicator calculation. Deviation - indicator deviation. Lag - calculatio
            PrimeTrend ML e um indicador de sinais para XAUUSD M15 que combina um algoritmo proprietario de deteccao de tendencias multi-temporais com dois modelos dedicados de aprendizado de maquina em formato ONNX - um para configuracoes de COMPRA e outro para configuracoes de VENDA. A Ideia Central A maioria dos indicadores da sinais em cada barra. PrimeTrend ML funciona de forma diferente. O motor de tendencias interno primeiro identifica uma mudanca estrutural na direcao do mercado atraves de quatro
            MFI Divergence for MetaTrader 5 MFI Divergence is a practical and easy-to-use MT5 indicator that detects regular and hidden divergences using the Money Flow Index (MFI) . It is built for traders who want a cleaner way to spot possible reversals , continuation setups , and momentum weakness directly from chart structure. The indicator runs in a separate window and automatically analyzes MFI pivot highs and lows against price highs and lows . When divergence conditions are found, it draws cle
            KT Renko Patterns MT5
            KEENBASE SOFTWARE SOLUTIONS
            O KT Renko Patterns analisa o gráfico Renko tijolo por tijolo para identificar padrões gráficos conhecidos que são amplamente utilizados por traders em diversos mercados financeiros. Em comparação com gráficos baseados em tempo, os gráficos Renko tornam a identificação de padrões muito mais fácil e visualmente clara, graças à sua aparência limpa e objetiva. O KT Renko Patterns possui vários padrões Renko, muitos dos quais são explicados com profundidade no livro "Profitable Trading with Renko
            CVD (Cumulative Volume Delta) for MT5 CVD (Cumulative Volume Delta) for MT5 Simple, fast CVD for volume and order flow trading. It tracks net buying vs selling pressure and plots CVD as candles. The Data Window also shows tick count per candle. What it does Accumulates volume delta from ticks or a chosen timeframe Optional reset: No Reset, Current Chart Period, or a specific timeframe Works on any symbol and timeframe How it’s calculated Tick-based: each incoming tick is labeled as buyer- or sel
            ALGOTRIBE Volatility Filter (GVZ + ATR) Institutional Volatility Intelligence for Smart Risk Control Category: Volatility & Risk Management Platform: MetaTrader 5 Type: Indicator (Chart Window) Overview ALGOTRIBE Volatility Filter is a next-generation volatility intelligence tool engineered to help traders anticipate, interpret, and manage market volatility with precision. By combining the CBOE Gold Volatility Index (GVZ) with a dynamic ATR-based engine , the indicator identifies real-ti
            O WaveTrend Oscillator MT5 é um poderoso indicador de trading projetado para aprimorar sua análise de mercado ao identificar mudanças de momentum e potenciais reversões de tendência. Ideal para traders de todos os níveis, essa ferramenta oferece insights valiosos sobre condições de sobrecompra e sobrevenda em vários mercados, incluindo forex, criptomoedas e commodities. Com sua capacidade de gerar sinais de compra e venda precisos, o WaveTrend Oscillator MT5 capacita os traders a tomarem decisõe
            Weis Wave Scouter
            Jean Carlos Martins Roso
            Descubra o poder da análise avançada de volume com o Weis Wave Scouter, um indicador revolucionário para MetaTrader 5 que combina os princípios consagrados do método Wyckoff e da análise VSA (Volume Spread Analysis). Desenvolvido para traders que buscam precisão e profundidade em suas operações, este indicador oferece uma leitura tática do mercado por meio da análise de ondas de volume cumulativo, ajudando a identificar pontos-chave de reversão e continuação de tendência. O Weis Wave Scouter a
            FXC iMACD-DivergencE MT5 Indicator This is an advanced MACD indicator that finds trend-turn divergences on the current symbol. The indicator detects divergence between the MACD and the price movements as a strong trend-turn pattern. Main features: Advanced divergence settings Price based on Close, Open or High/Low prices Give Buy/Sell open signals PUSH notifications E-mail sending Pop-up alert Customizeable Information panel Input parameters: MACD Fast-EMA: The Fast-EMA variable of the MACD indi
            Overview Harmonic Patterns MT5 is a technical analysis indicator designed for the MetaTrader 5 platform. It identifies and displays harmonic price patterns, such as Butterfly, Cypher, Crab, Bat, Shark, and Gartley, in both bullish and bearish directions. The indicator calculates key price levels, including entry, stop loss, and three take-profit levels, to assist traders in analyzing market movements. Visual elements and customizable alerts enhance usability on the chart. Features Detects six ha
            FXC iDeM-DivergencE MT5 Indicator This is an advanced DeMarker indicator that finds trend-turn divergences on the current symbol. The indicator detects divergence between the DeMarker and the price movements as a strong trend-turn pattern. Main features: Advanced divergence settings Price based on Close, Open or High/Low prices Give Buy/Sell open signals PUSH notifications E-mail sending Pop-up alert Customizeable Information panel Input parameters: DeM Period: The Period size of the DeMarker in
            Triangle Pattern Gann v3.1 - Complete Feature Documentation Core Functionality OverviewTriangle Pattern Gann v3.1 is a sophisticated MetaTrader 5 indicator that combines W.D. Gann's geometric trading principles with advanced triangle pattern recognition to deliver actionable trading signals. Primary Features1. Triangle Pattern Detection SystemAscending Triangle Recognition Function: Automatically identifies bullish continuation patterns Detection Criteria: Flat horizontal resistance line
            STRICTLY FOR BOOM INDEX ONLY!!!!! Here I bring the Maximum Trend Arrows OT1.0 MT5 indicator. This indicator is made up of a combination of different trend indicators for entries and exits, for entries an orange arrow will paint on the chart below the current market and a red flag for closing of trades and it produces buy arrows only. When the orange arrow appears, it will appear along with it's sound to notify you. The 1H timeframe is recommended, don't use it anywhere else than on the 1H timefr
            Gold Structure Scalper v4 The indicator built specifically for XAUUSD M5 scalpers who want structure-aware, confluence-filtered signals — not noise. Most gold indicators fire signals based on one or two conditions. Gold Structure Scalper v4 requires 4 or more confluence factors to align before painting a signal. The result is a cleaner, more selective signal that respects where price actually wants to go.
            The RSI Divergence + FVG Signal indicator combines Relative Strength Index (RSI) Divergence with Fair Value Gap (FVG) detection to generate high-probability buy and sell signals based on both momentum shifts and institutional imbalance zones. Core Features: RSI Divergence Detection : Identifies both regular and hidden bullish/bearish divergences between price and RSI. Divergences indicate potential trend reversals or continuation. FVG Zone Recognition : Detects Fair Value Gaps (imbalances caused
            This indicator is based on the classical indicators: RSI (Relative Strangth Index) and CCI (Commodity Channel Index) and will be helpful for those who love and know how to use not a visual but digital representation of the indicators. The indicator shows values from each timeframe. You will be able to change the main input parameters for each RSI and CCI for every TF. Parameters OverboughtLevel_R = 70; OversoldLevel_R = 30; OverboughtLevel_C = 100; OversoldLevel_C = -100; Example for M1: sTF1 =
            Indicador Crypto_Forex "WPR com 2 Médias Móveis" para MT5, sem repintura. - O WPR em si é um dos melhores osciladores para scalping. - O indicador "WPR e 2 Médias Móveis" permite visualizar as Médias Móveis Rápida e Lenta do oscilador WPR. - O indicador oferece oportunidades para identificar correções de preço muito cedo. - É muito fácil configurar este indicador através de parâmetros, podendo ser usado em qualquer período gráfico. - Você pode ver as condições de entrada de compra e venda nas
            **   All Symbols   x   All Timeframes   scan just by pressing scanner button ** Discount: The price is $50$, But now it is just $39, Limited time offer is active. *** Contact me  to send you instruction and add you in "Trend Reversal group" for sharing or seeing experiences with other users. Introduction: Trendlines are the most famous technical analysis in trading . Trendlines continually form on the charts of markets across all the different timeframes providing huge opportunities for traders
            VM Heiken Ashi Pro
            Van Minh Nguyen
            5 (1)
            VM Heiken Ashi Pro  Heiken-Ashi suavizado (HMA ou EMA) para filtrar ruído e gerar sinais claros de BUY/SELL, sem repintura (opcional ConfirmOnClosedBar). Exibe velas HA no gráfico (as velas originais podem ser ocultadas), posicionamento de setas por ATR ou deslocamento fixo, envia alertas (popup, email, push) com tratamento anti-spam. Objetivo principal Converter velas brutas em Heiken-Ashi suavizadas para detectar mudanças de cor (bear para bull / bull para bear) e desenhar setas para entrada
            Os compradores deste produto também adquirem
            SuperScalp Pro
            Van Minh Nguyen
            4.57 (21)
            SuperScalp Pro – Sistema avançado de scalping com múltiplos filtros SuperScalp Pro é um indicador avançado de scalping que combina o clássico Supertrend com múltiplos filtros inteligentes de confirmação para ajudar a identificar oportunidades de trading. Funciona de forma eficiente em vários timeframes de M1 até H4, com desempenho otimizado para XAUUSD, BTCUSD e principais pares Forex. O indicador fornece sinais claros de Buy e Sell, juntamente com níveis calculados automaticamente de entrada, S
            Divergence Bomber
            Ihor Otkydach
            4.9 (86)
            Cada comprador deste indicador recebe adicionalmente, e de forma gratuita: A ferramenta exclusiva "Bomber Utility", que acompanha automaticamente cada operação, define os níveis de Stop Loss e Take Profit e fecha operações de acordo com as regras da estratégia; Arquivos de configuração (set files) para ajustar o indicador em diferentes ativos; Set files para configurar o Bomber Utility nos modos: "Risco Mínimo", "Risco Balanceado" e "Estratégia de Espera"; Um vídeo tutorial passo a passo que aju
            Entry In The Zone and SMC Multi Timeframe is a real-time 2-in-1 market analysis tool that combines market structure analysis and a No Repaint BUY / SELL signal system into a single indicator, built on Smart Money Concepts (SMC) — a widely adopted framework used by professional traders to understand market structure. This indicator helps you see the market more clearly, make decisions based on structure rather than guesswork, and focus on high-probability zones where price is more likely to react
            Azimuth Pro
            Ottaviano De Cicco
            5 (6)
            Azimuth Pro V2: Estrutura Fractal Sintética e Entradas Confirmadas para MT5 Visão geral Azimuth Pro é um indicador de estrutura swing multinível da Merkava Labs . Quatro camadas de swing aninhadas, VWAP ancorado em swings, detecção de padrões ABC, filtragem estrutural de três timeframes e entradas confirmadas em barra fechada — um gráfico, um fluxo de trabalho dos micro-swings aos macro-ciclos. Este não é um produto de sinais cegos. É um fluxo de trabalho baseado em estrutura para traders que v
            Gann Made Easy   é um sistema de negociação Forex profissional e fácil de usar, baseado nos melhores princípios de negociação usando a teoria do sr. W. D. Gann. O indicador fornece sinais precisos de COMPRA e VENDA, incluindo níveis de Stop Loss e Take Profit. Você pode negociar mesmo em movimento usando notificações PUSH. Entre em contato comigo após a compra para receber instruções de negociação e ótimos indicadores extras gratuitamente! Provavelmente você já ouviu muitas vezes sobre os método
            Quantum TrendPulse
            Bogdan Ion Puscasu
            5 (23)
            Apresentando   Quantum TrendPulse   , a ferramenta de negociação definitiva que combina o poder do   SuperTrend   ,   RSI   e   Stochastic   em um indicador abrangente para maximizar seu potencial de negociação. Projetado para traders que buscam precisão e eficiência, este indicador ajuda você a identificar tendências de mercado, mudanças de momentum e pontos de entrada e saída ideais com confiança. Principais características: Integração SuperTrend:   siga facilmente a tendência predominante do
            Se você comprar este indicador, receberá meu Gerenciador de Operações Profissional + EA  GRATUITAMENTE. Primeiramente, vale ressaltar que este Sistema de Trading é um Indicador Não Repintado, Não Redesenho e Não Atrasado, o que o torna ideal tanto para o trading manual quanto para o automatizado. Curso online, manual e download de predefinições. O "Sistema de Trading Inteligente MT5" é uma solução completa de trading projetada para traders novos e experientes. Ele combina mais de 10 indicadores
            OmniSync Projection
            Antonio-alin Teculescu
            5 (1)
            Chronos Fractal Engine is an innovative price projection indicator for MetaTrader 5, designed to transform your technical analysis by intelligently identifying and projecting historical price patterns. Built upon an advanced correlation algorithm and the fractal principles of the market, this powerful tool visualizes potential future price movements, giving you a unique edge in your trading decisions. What is Chronos Fractal Engine? At its core, the Chronos Fractal Engine employs a sophisticat
            Power Candles MT5
            Daniel Stein
            4.75 (8)
            Power Candles – Sinais de entrada baseados em força para qualquer mercado Power Candles leva a análise de força comprovada da Stein Investments diretamente para o seu gráfico de preços. Em vez de reagir apenas ao preço, cada candle é colorido com base na força real do mercado, permitindo identificar instantaneamente a construção de momentum, aceleração de força e transições limpas de tendência. Uma única lógica para todos os mercados Power Candles funciona automaticamente em todos os símbolos de
            FX Trend MT5 NG
            Daniel Stein
            5 (4)
            FX Trend NG: A Nova Geração de Inteligência de Tendência Multi-Mercado Visão Geral FX Trend NG é uma ferramenta profissional de análise de tendências e monitoramento de mercado em múltiplos períodos de tempo. Permite compreender a estrutura completa do mercado em segundos. Em vez de alternar entre vários gráficos, você visualiza instantaneamente quais ativos estão em tendência, onde o momentum está enfraquecendo e onde existe alinhamento forte entre diferentes timeframes. Oferta de Lançamento
            Apresentando       Quantum Breakout PRO   , o inovador Indicador MQL5 que está transformando a maneira como você negocia Breakout Zones! Desenvolvido por uma equipe de traders experientes com experiência comercial de mais de 13 anos,       Quantum Breakout PRO       foi projetado para impulsionar sua jornada comercial a novos patamares com sua estratégia de zona de fuga inovadora e dinâmica. O Quantum Breakout Indicator lhe dará setas de sinal em zonas de breakout com 5 zonas-alvo de lucro e su
            Grabber System MT5
            Ihor Otkydach
            4.83 (23)
            Apresento a você um excelente indicador técnico: Grabber, que funciona como uma estratégia de trading “tudo incluído”, pronta para usar. Em um único código estão integradas ferramentas poderosas de análise técnica de mercado, sinais de entrada (setas), funções de alertas e notificações push. Cada comprador deste indicador também recebe gratuitamente: Utilitário Grabber: ferramenta para gerenciamento automático de ordens abertas Vídeo tutorial passo a passo: como instalar, configurar e operar com
            Vamos ser honestos primeiro. Nenhum indicador sozinho vai te tornar lucrativo. Se alguém te disser o contrário, está te vendendo um sonho. Qualquer indicador que mostre setas perfeitas de compra/venda pode ser feito para parecer impecável — basta dar zoom na parte certa da história e tirar um print das operações vencedoras. Nós não fazemos isso.  SMC Intraday Formula é uma ferramenta. Ela lê a estrutura do mercado para você, identifica as zonas de maior probabilidade de preço e mostra exatament
            CGE Trading Suite
            Carl Gustav Johan Ekstrom
            5 (2)
            Institutional-Grade Analytics for MT5 C GE Trading Suite delivers the analytical edge typically reserved for professional trading desks. The platform integrates a full suite of analytical tools into one seamless workflow: dynamic grid mapping, liquidity behavior analysis, ECM, trend lines, MIDAS, trade cycles, and directional channel projections. Together, these provide a unified view of market structure and momentum. Directional clarity is further enhanced by the capital flow index, which meas
            Veja qual estrategia realmente funciona no seu simbolo - antes de arriscar dinheiro real. Power Bar detecta barras de preco extremas em qualquer simbolo e qualquer timeframe, e entao faz backtest instantaneo de 3 estrategias de trading diferentes para que voce possa comparar taxas de acerto, fatores de lucro e P&L lado a lado. Tudo em um unico painel interativo. Sem suposicoes. Sem curve-fitting. Apenas dados. O que torna o Power Bar unico? A maioria dos indicadores fornece um sinal e deixa voc
            Atomic Analyst MT5
            Issam Kassas
            3.94 (31)
            Primeiramente, vale ressaltar que este Indicador de Negociação não repinta, não redesenha e não apresenta atrasos, tornando-o ideal tanto para negociação manual quanto automatizada. Manual do utilizador: configurações, entradas e estratégia. O Analista Atômico é um Indicador de Ação de Preço PA que utiliza a força e o momentum do preço para encontrar uma vantagem melhor no mercado. Equipado com filtros avançados que ajudam a remover ruídos e sinais falsos, e aumentam o potencial de negociação.
            Trend Screener Pro MT5
            STE S.S.COMPANY
            4.85 (104)
            Desbloqueie o poder da negociação de tendências com o indicador Trend Screener: sua solução definitiva de negociação de tendências, alimentada por lógica difusa e sistema de múltiplas moedas! Eleve sua negociação de tendências com o Trend Screener, o revolucionário indicador de tendências alimentado por lógica difusa. É um poderoso indicador de acompanhamento de tendências que combina mais de 13 ferramentas e recursos premium e 3 estratégias de negociação, tornando-o uma escolha versátil para to
            Meridian Pro
            Ottaviano De Cicco
            5 (1)
            Meridian Pro: Matriz Profissional de Tendência Multi-Timeframe para MT5 Visão geral Meridian Pro é uma matriz de tendência multi-timeframe da Merkava Labs que comprime estado direcional, força, condição de momentum e concordância da matriz em um painel compacto. Um motor adaptativo, aplicado consistentemente de M1 a W1. Sem ajuste por símbolo. Sem acúmulo de indicadores. Uma leitura estruturada em todos os ativos e todos os timeframes. Oferta de lançamento — Obtenha o Meridian Pro por USD 99 (in
            Btmm state engine pro
            Garry James Goodchild
            5 (4)
            BTMM State Engine Pro is a MetaTrader 5 indicator for traders who use the Beat The Market Maker approach: Asian session context, kill zone timing, level progression, peak formation detection, and a multi-pair scanner from a single chart. It combines cycle state logic with a built-in scanner dashboard so you do not need the same tool on many charts at once. What it does Draws the Asian session range; session times can follow broker server offset or be set in inputs. Tracks level progression (L
            Crystal Heikin Ashi Signals
            Muhammad Jawad Shabir
            5 (2)
            Crystal Heikin Ashi Signals - Professional Trend & Signal Detection Indicator Advanced Heikin Ashi Visualization with Intelligent Signal System for Manual & Automated Trading Final Price: $149 ---------> Price goes up $10 after every 10 sales . Limited slots available — act fast . Overview Crystal Heikin Ashi Signals is a professional-grade MetaTrader 5 indicator that combines pure Heikin Ashi candle visualization with an advanced momentum-shift detection system. Designed for both manual traders
            Smart Stop Indicator – Precisão inteligente de stop-loss diretamente no seu gráfico Visão geral O Smart Stop Indicator é a solução ideal para traders que desejam definir seu stop-loss de forma clara e metódica, sem adivinhações ou decisões baseadas apenas na intuição. A ferramenta combina lógica clássica de price action (topos mais altos, fundos mais baixos) com um sistema moderno de detecção de rompimentos para identificar onde realmente deve estar o próximo nível lógico de stop. Seja em tend
            Auto Optimized Parabolic RSI: Avançado Motor de Momentum 3D A maioria dos indicadores de varejo falha porque depende de parâmetros estáticos que quebram no momento em que a volatilidade do mercado muda. O Auto Optimized Parabolic RSI resolve o problema de "obsolescência do indicador" recalculando continuamente a sua própria vantagem matemática, trazendo uma adaptação quantitativa de nível institucional diretamente para o seu terminal MT5. A Vantagem Principal: Otimização 3D em Memória Personaliz
            FX Power MT5 NG
            Daniel Stein
            5 (31)
            FX Power: Analise a Força das Moedas para Decisões de Negociação Mais Inteligentes Visão Geral FX Power é a sua ferramenta essencial para compreender a força real das principais moedas e do ouro em quaisquer condições de mercado. Identificando moedas fortes para comprar e fracas para vender, FX Power simplifica as decisões de negociação e revela oportunidades de alta probabilidade. Quer você prefira seguir tendências ou antecipar reversões usando valores extremos de Delta, esta ferramenta adap
            Market Structure Order Block Dashboard MT5 é um indicador MT5 desenvolvido para traders que querem ler a estrutura de mercado e as principais zonas de reação do preço diretamente no gráfico. Ele combina BOS, ChoCH, Order Blocks, Fair Value Gaps (FVG), Liquidity, Kill Zones, Volume Profile e um dashboard compacto para uma análise rápida. Este indicador foi pensado para traders que usam estrutura de mercado, conceitos ICT e Smart Money como base para tomada de decisão. Ele pode ajudar a identifica
            ARICoins
            Temirlan Kdyrkhan
            ARICoin is a powerful trading companion designed to generate high-probability entry signals with dynamic TP/SL/DP levels based on volatility. Built-in performance tracking shows win/loss stats, PP1/PP2 hits, and success rates all updated live. Key Features: Buy/Sell signals with adaptive volatility bands Real-time TP/SL/DP levels based on ATR Built-in MA Filter with optional ATR/StdDev volatility Performance stats panel (Success, Profit/Loss, PP1/PP2) Alerts via popup, sound, push, or email Cust
            ARIPoint
            Temirlan Kdyrkhan
            ARIPoint is a powerful trading companion designed to generate high-probability entry signals with dynamic TP/SL/DP levels based on volatility. Built-in performance tracking shows win/loss stats, PP1/PP2 hits, and success rates all updated live. Key Features: Buy/Sell signals with adaptive volatility bands Real-time TP/SL/DP levels based on ATR Built-in MA Filter with optional ATR/StdDev volatility Performance stats panel (Success, Profit/Loss, PP1/PP2) Alerts via popup, sound, push, or email Cu
            SignalTech MT5 is a trading system for EURUSD, USDCHF, USDJPY, AUDUSD, NZDUSD, EURJPY, AUDJPY, NZDJPY, CADJPY H2 and H3 Timeframe.  It can generate signals with Buy/Sell Arrows and Pop-Up/Sound Alerts. Each signal has clear Entry and Stop Loss levels, which should be automatically flagged on the chart, as well as potential Targets 1, 2, and 3. The Entry and TP levels are fixed after the trade is taken. The exit level is dynamic. If there are signs of a potential short-term trend reversal, the
            Meravith Scanner
            Ivan Stefanov
            5 (1)
            O MERAVITH SCANNER é um indicador profissional de mercados financeiros para MetaTrader 5 que consolida várias ferramentas analíticas em um único sistema integrado. Ele realiza todos os cálculos automaticamente usando uma metodologia proprietária de preço médio ponderado por volume (VWAP), eliminando completamente a interpretação subjetiva. O indicador funciona em todas as classes de ativos (Forex, Ações, Índices, Commodities, Criptomoedas) e em todos os prazos, de M1 a Mensal. O princípio fundam
            Blahtech Supply Demand MT5
            Blahtech Limited
            4.54 (13)
            Was: $299  Now: $99  Supply Demand uses previous price action to identify potential imbalances between buyers and sellers. The key is to identify the better odds zones, not just the untouched ones. Blahtech Supply Demand indicator delivers functionality previously unavailable on any trading platform. This 4-in-1 indicator not only highlights the higher probability zones using a multi-criteria strength engine, but also combines it with multi-timeframe trend analysis, previously confirmed swings a
            A Master Edition é uma ferramenta analítica de nível profissional projetada para visualizar a estrutura do mercado através da lente do volume e do fluxo de dinheiro. Ao contrário dos indicadores de volume padrão, esta ferramenta exibe um Perfil de Volume Diário diretamente no seu gráfico, permitindo ver exatamente onde a descoberta de preços ocorreu e onde o "dinheiro inteligente" está posicionado. Esta Master Edition é projetada para clareza e velocidade, apresentando um sistema único de Auto-T
            Mais do autor
            Fair Value Gaps
            Cao Minh Quang
            4.88 (64)
            Fair Value Gap (FVG) Indicator Overview The Fair Value Gap (FVG) Indicator identifies inefficiencies in price action where an imbalance occurs due to aggressive buying or selling. These gaps are often created by institutional traders and smart money, leaving areas where price may later return to "fill" the imbalance before continuing its trend. Key Features: Automatic Detection of FVGs – The indicator highlights fair value gaps across different timeframes. Multi-Timeframe Support – View FVGs fr
            FREE
            Market Sessions Pre
            Cao Minh Quang
            4.67 (6)
            The Market Sessions indicator is a popular tool among forex and stock traders for visually representing global trading sessions on a price chart. It highlights the time periods for major trading sessions — such as the Asian (Tokyo) , European (London) , and American (New York) sessions — directly on the chart. This helps traders identify when markets open and close, allowing for better decision-making based on session-specific trading behavior. - Asian Session (Default: 00:00-09:00) - London Se
            FREE
            Fair Value Gaps MT4
            Cao Minh Quang
            3.88 (8)
            The Fair Value Gap (FVG) is a price range where one side of the market liquidity is offered, typically confirmed by a liquidity void on the lower time frame charts in the same price range. Price can "gap" to create a literal vacuum in trading, resulting in an actual price gap. Fair Value Gaps are most commonly used by price action traders to identify inefficiencies or imbalances in the market, indicating that buying and selling are not equal. If you're following the ICT Trading Strategy or Smart
            FREE
            MACD Indicator It has MACD line, Signal line, and Histogram. The Histogram has 4 colors based on Direction Above and Below the Zero Line, showing its movement direction as simple as possible. Allows Show MACD & Signal Line, Show Change In color of MACD   Line based on cross of Signal Line. Show Dots at Cross of MacD and Signal Line, Turn on and off Histogram. Enjoy your trading experience, and feel free to share your comments and reviews. If you are interested in this indicator, you might be i
            FREE
            The Market Sessions indicator is a popular tool among forex and stock traders for visually representing global trading sessions on a price chart. It highlights the time periods for major trading sessions — such as the   Asian (Tokyo) ,   European (London) , and   American (New York)   sessions — directly on the chart. This helps traders identify when markets open and close, allowing for better decision-making based on session-specific trading behavior. - Asian Session (Default: 00:00-09:00) - Lo
            FREE
            MACD Indicator It has MACD line, Signal line, and Histogram. The Histogram has 4 colors based on Direction Above and Below the Zero Line, showing its movement direction as simple as possible. Allows Show MACD & Signal Line, Show Change In color of   MACD     Line based on cross of Signal Line. Show Dots at Cross of MacD and Signal Line, Turn on and off Histogram. Enjoy your trading experience, and feel free to share your comments and reviews. If you are interested in this indicator, you might
            FREE
            The latest version of Indicator is fully integrated into an all-in-one package, including: Fair Value Gaps (FVG).  Implied Fair Value Gap (IFVG).  OrderBlock (OB).  The options in the settings section are relatively easy to navigate, and you can even use them right away upon activation without encountering difficulties when using the default configuration. The indicator utilizes an algorithm to automatically draw and identify Order Blocks (OB), Fair Value Gaps (FVGs), and Implied Fair Value Gaps
            Simple ICT Concepts
            Cao Minh Quang
            5 (2)
            The Simple ICT Concepts Indicator is a powerful tool designed to help traders apply the principles of the Inner Circle Trader (ICT) methodology. This indicator focuses on identifying key zones such as liquidity levels, support and resistance, and market structure, making it an invaluable asset for price action and smart money concept traders. Key Features Market Structure: Market structure labels are constructed from price breaking a prior swing point. This allows a user to determine the curren
            The Market Structure Trend Targets is a powerful trading indicator designed to give traders a clear, structured, and data-driven view of market momentum, breakouts, and key price reaction zones. Built on the principles of smart market structure analysis , it helps identify not only trend direction, but also precise breakout levels , trend exhaustion , and potential reversal zones — all with visual clarity and trader-friendly metrics. Key Features Breakout Points with Numbered Markers Track signi
            Order Block Multi Timeframe The Order Block Multi Timeframe is a powerful tool for Smart Money Concept (SMC) traders, combining high-accuracy Order Block detection with real-time Break of Structure (BOS) and Change of Character (CHoCH) analysis across multiple timeframes. Smart Money Insight, Multi-Timeframe Precision This indicator automatically identifies institutional Order Blocks —key price zones where large players have entered the market—and plots them directly on your chart. It also track
            The Area of Value Detection indicator automatically identifies and highlights key institutional price zones, including Liquidity areas, Order Blocks, and Fair Value Gaps (FVG). It is designed to help traders visualize market imbalances and potential points of interest (POIs) used by smart money participants. Main Features Liquidity Zones: Detects clusters of equal highs/lows and liquidity pools where stop orders are likely accumulated. Order Blocks: Highlights potential bullish and bearish or
            Smart Market Structure Simple is a powerful indicator that helps traders identify market structure based on the Smart Money Concept (SMC) . This indicator automatically detects Break of Structure (BOS), Change of Character (CHoCH), Fair Value Gaps (FVG), Order Blocks (OB), Liquidity Zones (LQZ), and key swing points Higher High (HH), Higher Low (HL), Lower High (LH), Lower Low (LL) . Main Objective: Assist traders in tracking institutional flow ( Smart Money ) and finding high-probability trade
            The Trend Duration Forecast MT5 indicator is designed to estimate the probable lifespan of a bullish or bearish trend. Using a Hull Moving Average (HMA) to detect directional shifts, it tracks the duration of each historical trend and calculates an average to forecast how long the current trend is statistically likely to continue. This allows traders to visualize both real-time trend strength and potential exhaustion zones with exceptional clarity. KEY FEATURES Dynamic Trend Detection:   Utiliz
            Automatically detect bullish or bearish order blocks to optimize your trade entries with our powerful indicator. Ideal for traders following ICT (The Inner Circle Trader). Works with any asset type, including cryptocurrencies, stocks, and forex. Displays order blocks on multiple timeframes, from M2 to W1. Alerts you when an order block is detected, migrated, or a higher timeframe order block is created/migrated. Perfect for both scalping and swing trading in Smart Money Concepts.  Enhanced by st
            The latest version of Indicator is fully integrated into an all-in-one package, including: Fair Value Gaps (FVG).  Implied Fair Value Gap (IFVG).  OrderBlock (OB).  The options in the settings section are relatively easy to navigate, and you can even use them right away upon activation without encountering difficulties when using the default configuration. The indicator utilizes an algorithm to automatically draw and identify Order Blocks (OB), Fair Value Gaps (FVGs), and Implied Fair Value Gap
            The   Linear Regression Oscillator (LRO)   is a technical indicator based on linear regression analysis, commonly used in financial markets to assess the momentum and direction of price trends. It measures the distance between the current price and the value predicted by a linear regression line, which is essentially the best-fit line over a specified period. Here’s a breakdown of how it works and its components: Key Components of the Linear Regression Oscillator Linear Regression Line (Best-Fit
            The   Simple  ICT Concepts Indicator   is a powerful tool designed to help traders apply the principles of the   Inner Circle Trader (ICT)   methodology. This indicator focuses on identifying key zones such as liquidity levels, support and resistance, and market structure, making it an invaluable asset for price action and smart money concept traders. Key Features Market Structure : Market structure labels are constructed from price breaking a prior swing point. This allows a user to determine t
            This Simple Smart Money Concepts indicator displays real-time market structure (internal & swing BOS / CHoCH), order blocks, premium & discount zones, equal highs & lows, and much more...allowing traders to automatically mark up their charts with widely used price action methodologies. "Smart Money Concepts" (SMC) is used term amongst price action traders looking to more accurately navigate liquidity & find more optimal points of interest in the market. Trying to determine where institutional
            The Pure Price Action ICT Tools indicator is designed for pure price action analysis, automatically identifying real-time market structures, liquidity levels, order & breaker blocks, and liquidity voids. Its unique feature lies in its exclusive reliance on price patterns, without being constrained by any user-defined inputs, ensuring a robust and objective analysis of market dynamics. Key Features Market Structures A Market Structure Shift, also known as a Change of Character (CHoCH), is a pivot
            Multiple Non-Linear Regression MT4 This indicator is designed to perform multiple non-linear regression analysis using four independent variables: close, open, high, and low prices. Here's a components and functionalities: Inputs: Normalization Data Length: Length of data used for normalization. Learning Rate: Rate at which the algorithm learns from errors. Show data points: Show plotting of normalized input data(close, open, high, low) Smooth?: Option to smooth the output. Smooth Length: Lengt
            The Market Structure with Inducements & Sweeps indicator is a unique take on Smart Money Concepts related market structure labels that aims to give traders a more precise interpretation considering various factors. Compared to traditional market structure scripts that include Change of Character (CHoCH) & Break of Structures (BOS) -- this script also includes the detection of Inducements (IDM) & Sweeps which are major components of determining other structures labeled on the chart. SMC & pri
            Smart Market Structure Simple   is a powerful indicator that helps traders identify   market structure   based on the   Smart Money Concept (SMC) . This indicator automatically detects   Break of Structure (BOS), Change of Character (CHoCH), Fair Value Gaps (FVG), Order Blocks (OB), Liquidity Zones (LQZ),   and key swing points   Higher High (HH), Higher Low (HL), Lower High (LH), Lower Low (LL) . Main Objective:   Assist traders in tracking institutional flow ( Smart Money ) and finding high-p
            Unicorn Model ICT Indicator — Smart Trading with Precision The   Unicorn Model ICT Indicator   is a powerful and intelligent tool designed for traders who follow   Smart Money Concepts (SMC)   and   Inner Circle Trader (ICT)   methodologies. This indicator simplifies complex price action by visually identifying key market structures and providing high-probability trade setups. Key Features: A Bullish Unicorn Pattern A Lower Low (LL), followed by a Higher High (HH) A Fair Value Gap (FVG), overla
            The   Quasimodo Pattern Indicator  is no more difficult than the Head and Shoulders. Still, only a few traders know about it, and some even confuse one with the other. However, this is not a reason to avoid this tool in your forex trading strategy.    Features: Automatic Detection:   The indicator automatically scans for valid QM patterns across any timeframe, reducing the need for manual chart analysis. Visual Highlights:   Clear and customizable on-chart drawing of shoulders, heads, and breako
            Order Block Multi Timeframe The   Order Block Multi Timeframe   is a powerful tool for Smart Money Concept (SMC) traders, combining high-accuracy   Order Block detection   with real-time   Break of Structure (BOS)   and   Change of Character (CHoCH)   analysis across multiple timeframes. Smart Money Insight, Multi-Timeframe Precision This indicator automatically identifies   institutional Order Blocks —key price zones where large players have entered the market—and plots them directly on your ch
            Rectangle Trading Custom   is a powerful technical analysis tool designed for price action and range-based traders. It allows users to define consolidation zones and receive alerts when the price breaks out of these zones or approaches trendlines drawn on the chart. Rectangles and Trendlines will be extended into future with one click. Rectangle point size, name and prices will be displayed around rectangle. Key Features: Draw Trading Zones (Rectangle Zones) Users can manually draw rectangles t
            SMC Analyzer Single-Timeframe (STF) for MT4 The   SMC Analyzer STF  MT4  is a powerful, single-timeframe Smart Money Concepts (SMC) analysis tool designed for precision trade confirmations based on core SMC components. It evaluates market structure across four levels of confirmation using elements such as   Break of Structure (BOS), Change of Character (CHoCH), Order Blocks (OB), Fair Value Gaps (FVGs), Liquidity Zones , and   Higher Timeframe Trend Bias . Each level has configurable elements (
            The Fibonacci Confluence Toolkit  is a powerful indicator designed to highlights areas of interest where significant price action or reactions are anticipated, automatically applies Fibonacci retracement levels to outline potential pullback zones, and detects engulfing candle patterns.. This tool automates the detection and visualization of key market structures and potential reversal zones. Key Features: CHoCH Detection (Change of Character): Automatically identifies structural shifts in marke
            The Market Structure Trend Targets   is a powerful trading indicator designed to give traders a clear, structured, and data-driven view of market momentum, breakouts, and key price reaction zones. Built on the principles of   smart market structure analysis , it helps identify not only trend direction, but also   precise breakout levels ,   trend exhaustion , and   potential reversal zones   — all with visual clarity and trader-friendly metrics. Key Features Breakout Points with Numbered Markers
            Supertrend Targets Signal   is a powerful trend-following and breakout confirmation indicator designed to help traders   identify high-probability entry points ,   visualize dynamic target zones , and   receive clean, reliable signals   across various market conditions. The core trend logic is built on a custom Supertrend that uses an ATR-based band structure with long smoothing chains—first through a WMA, then an EMA—allowing the trend line to respond to major shifts while ignoring noise. A key
            Filtro:
            Sem comentários
            Responder ao comentário