Conheça o Mercado MQL5 no YouTube, assista aos vídeos tutoriais
Como comprar um robô de negociação ou indicador?
Execute seu EA na
hospedagem virtual
hospedagem virtual
Teste indicadores/robôs de negociação antes de comprá-los
Quer ganhar dinheiro no Mercado?
Como apresentar um produto para o consumidor final?
Expert Advisors e Indicadores para MetaTrader 5 - 173
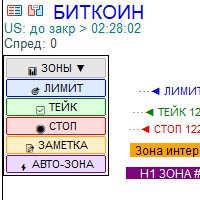
Удобная панель для разметки графика в MT5 Рисует зоны и авто-зоны с привязкой к таймфрейму Это компактная панелька, которая всегда под рукой на графике. В один клик она разворачивается, чтобы вы могли моментально наносить важные уровни, и так же легко сворачивается, чтобы не мешать обзору. ЛИМИТ — для отметки точек входа. ТЕЙК — для целей по взятию прибыли. СТОП — для уровней остановки убытков. ЗОНЫ — рисует прямоугольные области (например, важный ценовой диапазон или зону кон

# MT Trading Tools - Professional Trading Suite
## Product Overview
**MT Trading Tools** is a professional trading management solution designed specifically for the MT5 platform, integrating intelligent closing, rapid trading, risk control, and multiple core functionalities. Whether you're a manual trader or algorithmic trader, this tool significantly enhances your trading efficiency and risk management capabilities.
### Core Value Proposition - **Enhanced Efficiency** : One-click oper

SmartWay EA MT5 – Built for Gold. Built for Trends. SmartWay EA (formerly SmartTrade EA) is a professional Expert Advisor created specifically for trading XAUUSD (Gold) on MT5.
With the release of V2.0 , SmartWay introduces a powerful new feature: Smart Step Size Boost with Spike Detection . This upgrade makes the EA more adaptive in volatile markets and especially effective in one-way markets (bullish or bearish trends). It combines cycle-based money management , drawdown protection , and prof
Momentum Surge Tracker: Unleash the Power of Smart Momentum Unlock a new edge in your trading with the Momentum Surge Tracker, a sophisticated indicator designed to identify and capitalize on market momentum with unparalleled precision. For just $30, you can equip your trading arsenal with a powerful tool that intelligently adapts to market volatility, providing clear, actionable signals to help you stay ahead of the curve. The Logic Behind the Momentum Surge Tracker At its core, the Momentum S

InfinityBreak v2.0 – EA Breakout Premium
. Negocie de forma inteligente e sem estresse
. InfinityBreak detecta automaticamente os rompimentos chave e gerencia TP, SL e tamanhos de lote com precisão cirúrgica
. Recomendado usar no **timeframe M1** para **XAU/USD**
Versão MT4 : Infinity Break 2 | Acheter le Robot de trading (Expert Advisor) pour MetaTrader 5
Canal Quantum EAs : Private Messages - Evan Pierre Clement - KurukoPro - Trader's profile
Informações sobre o preço :
O pr
Features List 1:
FVG->iFVG Order Block High Transaction Line (Personal strategy) Premium Discount 50% and 61% Previous day high low Previous week high low Candle end countdown Feature List 2 : (Implemented based on feedback from community groups) trend identification Hide FVG, Order Block, Large Transaction line below 50% equilibrium. Hide all/Individual texts/features FUTURE Feature List (Will be implemented only if at least 5 people request for it.)
Asia, London, NY lq zones (Implemented) Def

Visual Portfolio Analyzer: Trade Your Portfolio, Not Just a Pair Unlock a new dimension of market analysis with the Visual Portfolio Analyzer, the ultimate tool for traders who think in terms of a complete portfolio. Stop making isolated decisions on single currency pairs and start trading with a holistic view of your combined positions. This indicator is meticulously designed to filter out market noise and provide clear, high-probability signals based on the collective momentum of your chosen

Visual Dynamic Envelope Crossover: Precision Signals for Modern Traders Unlock a new level of clarity in your trading with the Visual Dynamic Envelope Crossover indicator. Designed for traders who demand precision and simplicity, this powerful tool eliminates guesswork by identifying high-probability entry points with clear, non-repainting buy and sell arrows directly on your chart. For just $30, you get a sophisticated yet easy-to-use indicator that can become the cornerstone of your trading s

Smart ATR Trader EA – Adaptive Scalping & Risk Management Smart ATR Trader EA is a lightweight, fast, and fully automated trading system designed for scalping and intraday trading .
It uses simple yet powerful logic: candle momentum entries with ATR-based exits and professional risk management controls . Write me in personal messages to get .set files Key Features Flexible Risk Control
Trade with fixed lot size , money-based risk , or percent of balance . ATR-Based TP & SL
Dynamic
Fractal Momentum Analyzer: Decode the Market's Hidden Structure Unlock a new dimension of market analysis with the Fractal Momentum Analyzer. While traditional indicators measure price and volume, this powerful tool goes deeper, quantifying the underlying complexity and geometric structure of market movements. For just $30, you can gain a unique edge by understanding the very nature of price action before a major move occurs. This is not just another oscillator. The Fractal Momentum Analyzer is

Visual Momentum Wave Sync: Master Market Momentum with Unmatched Clarity Unlock the market's rhythm and trade with confidence for just $30! Are you tired of noisy indicators that clutter your charts and provide conflicting signals? Do you struggle to accurately gauge market momentum and identify high-probability entry and exit points? The Visual Momentum Wave Sync indicator is the definitive tool designed to solve these problems, offering a crystal-clear view of market dynamics for traders who

Dynamic Momentum Wave: Trade with Adaptive Intelligence Unlock the market's true momentum and leave lagging, noisy indicators behind. For just $30, gain an intelligent edge. Are you tired of momentum indicators that give signals too late, or get you caught in false breakouts during choppy markets? The Dynamic Momentum Wave is a professional-grade trading tool engineered to solve this problem. It moves beyond outdated, fixed-period calculations and uses a sophisticated engine that adapts in real

This Expert Advisor is a specialized trading bot that operates on a unique price reversal cycle strategy . It's designed to identify and trade reversals that occur within specific time windows, starting at a designated hour and minute (for example, 9:15 AM Pakistan Time). The EA defines trading cycles by a set number of bars and looks for a price to deviate by a set percentage from a reference bar's high or low before opening a position. The bot can also automatically reverse its position if it

An effective tool for traders, the Equilibrium Gauge indicator is designed to identify significant price shocks and subsequent market reactions. It automatically detects large, impactful candles and projects three key zones—Shock, Absorption, and Tension—to forecast potential areas of market reversal or continuation. When the price enters the critical "Tension Zone" and specific conditions are met, the indicator will generate a clear BUY or SELL arrow, providing a straightforward signal for pote

The LBArrow-2 indicator is a sophisticated tool designed for MetaTrader 5 (MT5), delivering precise arrow-based signals derived from a linear breakout strategy. This versatile indicator empowers traders to customize their experience by selecting their preferred signal style—choose between visually appealing blocks or traditional arrows—ensuring seamless integration into your trading workflow. Additionally, you can adjust the starting period from which signals are displayed and fine-tune the line
Guia de Configuração — Currency Strength Money PRO Cada parâmetro abaixo está explicado de forma direta para configurar o indicador. Parâmetro Valor padrão Descrição
Moedas alvo separadas por vírgula USD,EUR,GBP,JPY,CHF, AUD,NZD,CAD,XAU … Lista de moedas analisadas. Separe por vírgula. Pode incluir/retirar moedas conforme o seu uso. Janela (horas) para variação percentual 12 Janela de tempo para medir a variação percentual de preço usada no cálculo de força.
Atualização (segundos) 1 Intervalo

Visual Weekdays Indicator: Master the Market's Weekly Rhythm Unlock a new dimension of market analysis with the Visual Weekdays Indicator, the ultimate tool for traders who understand that time is as critical as price. The market ebbs and flows with a distinct weekly rhythm, with each day presenting unique characteristics, volatility, and trading opportunities. This powerful indicator is engineered to make this rhythm instantly visible and fully customizable on your chart, providing you with an

HYBRID MULTI-STRATEGY PRO-P Enhanced: Maestria Multiestratégica de Precisão para FOREX e XAUUSD Desfrute do potencial máximo do HYBRID MULTI-STRATEGY PRO-P Enhanced , um Expert Advisor (EA) de ponta projetado para dominar os mercados FOREX e XAUUSD com precisão cirúrgica. Desenvolvido para traders de elite, fundos de hedge e investidores institucionais, este EA alimentado por inteligência artificial combina estratégias híbridas avançadas — incluindo breakout, reversão à média, acompanhamento de

Dynamic Momentum Oscillator System: Trade with the Trend, Adapt to Volatility Are you tired of oscillators that give false signals in choppy markets and lag behind strong trends? The Dynamic Momentum Oscillator System is a professionally engineered trading tool designed to overcome these exact challenges. It's not just another indicator; it is a complete trading system that provides clear, actionable signals by intelligently adapting to ever-changing market conditions. The Logic: A Deeper Look

Visual Dynamic Channel Breakout Unlock the Power of Market Volatility with Precision Breakout Signals Are you tired of noisy indicators and missed opportunities? The Visual Dynamic Channel Breakout indicator is a professional-grade tool designed to help you identify and capitalize on market trends with confidence. By intelligently adapting to real-time volatility, this indicator provides clear, actionable signals that cut through market noise, allowing you to focus on what matters: making profi

Dynamic Flux Oscillator Pro Unlock the Market's True Momentum and Trade with Unprecedented Clarity Are you tired of lagging indicators that generate signals long after the optimal entry point has passed? The Dynamic Flux Oscillator Pro is a professional-grade trading tool meticulously engineered to solve this problem. It moves beyond traditional oscillators by analyzing the raw, underlying momentum of the market—what we call "market flux"—to provide you with timely, high-probability trading sig

Visual Trend Direction and Force Indicator (TDF) Unlock the True Force of the Market and Trade with Unprecedented Clarity Are you tired of trend indicators that lag, produce false signals in choppy markets, and fail to distinguish between a weak trend and a powerful, profitable move? The Visual Trend Direction and Force (TDF) Indicator is the definitive solution, engineered to provide a crystal-clear and immediate view of both the trend's direction and, more importantly, its underlying strength

Dynamic Volatility Corridor: Your Ultimate Breakout and Trend Companion Unlock the power of market volatility with the Dynamic Volatility Corridor, a sophisticated indicator designed to identify high-probability breakout opportunities with exceptional clarity. For just $30, this tool provides a powerful and intuitive way to visualize price action and capture significant market moves. The Core Logic: How It Works The Dynamic Volatility Corridor is not just another channel indicator. Its strength

Unlock the Market's Rhythm with Visual Dynamic Volatility Bands Are you tired of navigating the unpredictable swings of the market with outdated tools? Do you struggle to find clear, reliable entry and exit points in today's volatile trading environment? It's time to stop guessing and start trading with confidence. Introducing the Visual Dynamic Volatility Bands , a sophisticated, next-generation indicator engineered to give you a distinct edge. For just $30, this powerful tool moves beyond sim

So Easy Indicator: Your Simple Path to Clearer Market Signals Unlock a clearer view of the market with the So Easy Indicator, a powerful yet intuitive tool designed to simplify your trading decisions. For just $30, you can add this robust indicator to your MetaTrader platform and start identifying potential market turning points with greater confidence. Forget chart clutter and confusing signals; the So Easy Indicator focuses on the core dynamics of market volatility and momentum to provide cle

Visual DynamicWave Oscillator: Master Market Reversals with Precision Unlock a new level of trading clarity with the Visual DynamicWave Oscillator, an advanced technical indicator meticulously engineered to identify high-probability market turning points. While many oscillators falter in volatile conditions, the DynamicWave Oscillator thrives by intelligently adapting to the market's ever-changing rhythm. This is not just another overbought and oversold indicator; it is a sophisticated tool des
RSI Arrows Professional v1.00 Advanced Technical Indicator for MetaTrader 5
Overview RSI Arrows Professional is a sophisticated technical indicator that combines the power of the traditional RSI (Relative Strength Index) with an intelligent directional signal system. Designed specifically for traders looking to identify optimal entry and exit points in the market, this indicator implements conservative trading strategies based on momentum analysis.
Key Features Conservative Signal Strategy

EA 100% focused on GBPUSD on M15. DCA strategy with a basket of up to 5 orders, additions based on percentage deviation, and basket take-profit. Comes with two presets: Funding (conservative): built to pass prop-firm challenges with low drawdown.
Turbo (aggressive): same algorithm with higher lot size and equity SL for those seeking speed while accepting higher risk. ️ No external indicators or news filters (pure price execution).
️ Equity SL as % of balance (hard risk cut).
️ Grid-less logic

Super Neural Gold – Robô para XAUUSD
O Super Neural Gold é um sistema automatizado desenvolvido para operar XAUUSD. O robô utiliza price action, detecção de padrões técnicos e lógica adaptativa para fornecer operações consistentes, tanto em contas reais quanto em backtests de alta qualidade. Princípios de Funcionamento O robô analisa o mercado em tempo real utilizando os seguintes componentes: 1. Análise de Padrões Gráficos
• Identificação de rompimentos de suportes e resistências.
• Reconhec

**Expert Advisor Smart Money EUR/USD H1**
Transforme seu trading com nosso Expert Advisor avançado baseado no conceito Smart Money, desenvolvido especificamente para EUR/USD no timeframe H1. Este algoritmo sofisticado identifica movimentos de dinheiro institucional e mudanças na estrutura do mercado para capturar oportunidades de trading de alta probabilidade.
**Características Principais:** - Implementação avançada do conceito Smart Money - Otimizado para EUR/USD timeframe H1 - Análise de me

Discover a powerful and intelligent MT5 Expert Advisor designed for traders who demand precision, speed, and consistency. This EA specializes in fast scalping on the 5-minute timeframe , entering the market during breakout opportunities triggered by institutional volume spikes . Built for efficiency, the bot combines a robust entry strategy with strict risk management. Every trade is protected with both Take Profit and Stop Loss , while a trailing stop automatically secures profits as the market

“Plug & Play Signal Dashboard – Multi-Indicator Signals for H1, H4, D1!”
No setup needed! This EA provides Buy, Sell, and Neutral signals per timeframe using MA, RSI, and MACD . Ideal for beginners and traders who want fast, actionable market insights . Features: Plug & play, zero configuration Signals for H1, H4, D1 Clear BUY/SELL/NEUTRAL alerts per timeframe Alerts via pop-up, email & push notifications Built-in optimized settings for stability Custom versions available on

Assuma o controle das suas trades!
Infinity Breakout v1.0 transforma o seu trading numa experiência simples e lucrativa . Chega de stress com decisões de última hora: seu EA gerencia entradas, TP e SL automaticamente .
Versão MT4 : Infinity Break 1 | Acheter le Robot de trading (Expert Advisor) pour MetaTrader 5
Canal Quantum EAs : Private Messages - Evan Pierre Clement - KurukoPro - Trader's profile
Informações sobre o preço :
O preço aumenta $50 a cada 10 compras Preço final: $

Market state detector: Super Trend, Transition, Chaos, Consolidation, Breakout (from consolidation squeeze)
Plots a color-coded histogram in a separate window where value = state code and color = state category.
State codes (ENUM_MARKET_STATE): 0 MARKET_QUANTUM_SUPER_TREND 1 MARKET_QUANTUM_TRANSITION 2 MARKET_QUANTUM_CHAOS 3 MARKET_QUANTUM_CONSOLIDATION 4 MARKET_QUANTUM_BREAKOUT
Instant Clarity "Read the market’s mood in seconds." "From chaos to trend — spot the

Professional TMA Version 1.0 - Advanced Technical Analysis
OVERVIEW The Professional TMA Centered is an advanced technical indicator based on the Triangular Moving Average (TMA) that provides multidimensional market analysis through accurate signals, dynamic bands, and automatic reversal point detection.
What is a TMA (Triangular Moving Average)? The TMA is a doubly smoothed moving average that significantly reduces market noise while remaining sensitive to trend changes. Unlike traditiona
Do you want trading robots? Read this:
Before investing in a trading robot, take a moment to understand what it entails. Trading is a game of probabilities. No one can guarantee a profit on every trade or every month. What truly matters is long-term profitability. If you can't accept that, there's no point in buying my robot. Go find another job. Don’t buy a robot based solely on its price or popularity on a platform. An expensive bot isn’t necessarily profitable. Even with a profitable robot,

NO DLL NEEDED !
Centundecim Automata Negotiationis Estratégia matemática inspirada em níveis numéricos universais O Centundecim Automata Negotiationis é um Expert Advisor totalmente automatizado que identifica padrões de preço em milésimos e abre operações em pontos matematicamente relevantes do gráfico. Características principais: Entradas baseadas em gatilhos numéricos (L1–L6) , sem indicadores externos. Gestão automática de volume : adapta o lote ao saldo e à margem disponível. Controle d

Fibonacci Xcel – The Fibonacci Indicator That Thinks Ahead. It fuses advanced Fibonacci analytics , real‑time sentiment tracking , and a proprietary Market Quantum State Engine to give traders a crystal‑clear view of what’s happening now — and what’s likely to happen next. Core Capabilities Dynamic Fibonacci Mapping – Automatically adapts retracements, extensions, and projections to evolving price structures. Sentiment Fusion Layer – Integrates live market sentiment data to validate or ch

Compounding Smart Bot is a fully automated Expert Advisor designed for traders who want consistent results through precision and speed. Built with a trend bias algorithm , it identifies the prevailing market direction to increase the probability of winning trades. It also integrates a support and resistance strategy , ensuring that entries and exits are placed at the most reliable market levels. For added performance, the bot employs scalping techniques , capturing quick profits during intraday

The Next Evolution in Fibonacci Intelligence FiboChampion isn’t just another Fibonacci tool—it’s a paradigm shift in how traders interpret price action. Engineered for precision and adaptability, this advanced indicator fuses quantum-inspired logic , machine-learned pattern recognition , and non-linear Fibonacci geometry to uncover market turning points with uncanny accuracy. What Sets FiboChampion Apart: Non-Linear Fibonacci Mapping : Goes beyond static retracements by adapting to fractal m

Welcome to SuperTrend Grid EA
SuperTrend Grid EA is a versatile grid trading system with supertrend as filtr to open main position. EA allows you to set different calculation methods for points distance and lot sizes. The EA handles all calculations and executes trades automatically. Lot Size and Grid Calculations: Constant – same lot size for each new trade in the grid. Linear – lot size increases linearly with each new trade. Martingale – lot size increases using the martingale method.

Feyra - O Futuro do Trading One-Chart EA: Feyra deve ser executado em um único gráfico apenas ( XAUUSD ) M15 e automaticamente negocia em todos os símbolos.
Extra details on set-up: (link) - Por favor, entre em contato conosco para o link do sinal ao vivo após a compra. Pricing starts at 85. Only 2 traders have access so far. After 10 licenses are issued, price increases to 131. Kindly join our MQL5 channel : (link)
Gestão de Risco: Recursos robustos de stop-loss e take-profit garantem que su
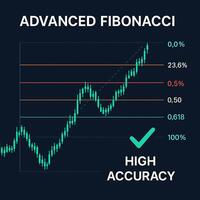
Fibonacci Advanced Indicator – Precision Meets Intelligence The Fibonacci Advanced Indicator is a cutting-edge technical analysis tool designed for traders who demand more than conventional retracement levels. Built on the foundational principles of Fibonacci mathematics, this indicator transcends tradition by integrating dynamic market behavior , multi-timeframe analysis , and adaptive algorithms to deliver high-probability trading zones with surgical accuracy.
1. Multiple Fibonacci Levels

Architectural Griding Expert Advisor: Advanced Grid Trading System Overview This Expert Advisor (EA) is a sophisticated grid-based trading system designed for MetaTrader 5 (MT5). Developed by me, this EA automates grid trading strategies with separate configurations for Buy and Sell grids, allowing traders to capitalize on market ranges, trends, and reversals. It incorporates advanced risk management, customizable grid levels, lot sizing modes, and a user-friendly graphical interface (UI) for r
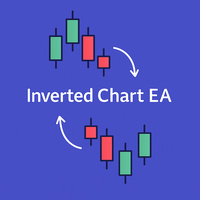
Inverted_Chart_EA Utility Expert Advisor Inverted_Chart_EA creates and maintains a mirror-inverted chart of any symbol and timeframe.
It automatically generates a custom instrument (e.g. US30_INV ) and keeps its price history updated in real time, with bars mirrored around a chosen pivot. This utility gives traders a new way to analyze the market from a different perspective by flipping the chart upside down. Why use an inverted chart? Highlight hidden patterns – price formations that look ordin

This Expert Advisor is an intraday trading bot that exclusively targets reversals at key price levels. It operates by identifying the daily high and low and then executes trades when the price retraces to one of two predefined levels. The bot offers both fixed and dynamic lot sizing , the latter of which calculates your position size based on account balance for precise risk management. It also features a trailing stop to lock in profits as the trade moves in your favor. This strategy is best su
Gold Sniper Grid EA: Scalping de Precisão com Ajuste de Risco para XAU/USD Revolucione a negociação de ouro com este expert advisor (EA) algorítmico que combina a precisão de entrada de atirador especial (sniper), execução de grid adaptativa e proteção dinâmica de capital. Projetado para crescimento explosivo com controle matemático de risco – lucrativo a partir de um capital de $10 e pronto para FTMO. Parâmetros de Configuração Inteligentes Parâmetro Descrição Exemplo/Impacto Recomendado magicN
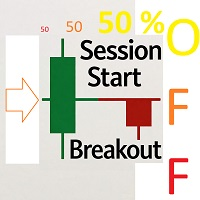
Session Start Breakout - O Caçador do Início da Sessão Descrição Completa
A arte de um trader é encontrar o "ponto de partida" . Muitos dos principais e poderosos movimentos do mercado tomam forma logo após a excitação inicial no início das principais sessões de negociação (Ásia, Londres e Nova York) diminuir. O indicador Session Start Breakout é uma ferramenta analítica avançada projetada precisamente para ajudá-lo a identificar esses momentos críticos e oportunidades potenciais.
Esta f

NoobEA.mq5 – Robô de Negociação Inteligente para MetaTrader 5 Descrição do Produto: O NoobEA.mq5 é um Expert Advisor avançado desenvolvido para traders que buscam automatizar suas operações de forma segura, eficiente e personalizada. Projetado para operar em múltiplos mercados e ativos internacionais — o NoobEA combina indicadores técnicos consagrados com gestão de risco inteligente, proporcionando uma abordagem estruturada e robusta para operações diárias. Principais Funcionalidades: Estratégia

V-FORCE PRO - O INDICADOR DE VOLUME AVANÇADO PARA METATRADER 5 Descubra o Poder do Volume Real com V-Force Pro - A Revolução na Análise de Mercado! Pare de Operar no Escuro! Visualize a Força dos Grandes Players em Tempo Real O Problema que Todo Trader Enfrenta:
Você já se perguntou por que alguns movimentos do mercado falham mesmo com todos os indicadores técnicos apontando na mesma direção? A resposta está no VOLUME REAL - a peça mais importante do quebra-cabeça que a maioria dos traders

### **Title: FX KINGS EMBASSY - Wick Fill EA v12.0 | The Ultimate Volatility Hunter**
**Short Description:** Unleash the power of precise price action with the FX KINGS EMBASSY Wick Fill EA. This next-generation trading robot is engineered to capitalize on market momentum by identifying high-probability "Wick Fill" patterns. Its proprietary **Unlimited Cascade System** is designed to let your winners run indefinitely, making it the ultimate tool for conquering volatile symbols like the Volati

This expert advisor named TradeManager provides a manual trading management panel in MetaTrader 5 that allows precise control over open positions.
It is designed for traders who want dynamic management of Stop Loss (SL), Take Profit (TP), Break Even (BE), and Partial Close functionality. Key Features: Dynamic Trade Management : Manually set or drag-and-drop SL, TP, and BE levels. Supports partial closing at different profit levels (1:1, 1:1.5, 1:2). Automated Drawing : Automatically draw
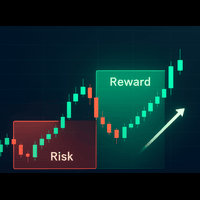
Smart Risk Manager – Risk/Reward Ratio & Position Sizing Tool for MT5 Overview (Short Description) A professional risk management indicator that helps traders calculate lot size, risk percentage, and reward ratio in real time. Perfect for Forex, Indices, Gold, and Synthetic Indices traders who want precise control over their capital. Full Description Trading without proper risk management is like driving without brakes.
The Smart Risk Manager for MT5 gives you full control over your position siz

Introduction The Order Block Support & Resistance Zones SMC Indicator is a powerful trading tool designed to detect order blocks effectively.
This indicator displays both support and resistance order blocks , calculated based on zigzag levels .
We have three zigzag levels , each calculated based on the previous one.
In the Basic version , you get access to Level 1 and Level 2 blocks only. Order blocks represent key price levels where the market is likely to

Synchronized Multi-Pair Trading
Live Signal SwingSync EA is a sophisticated automated trading system that synchronizes trading across multiple currency pairs simultaneously, combining proprietary market analysis with advanced risk management to deliver steady account growth. This true multi-currency EA manages all pairs in parallel from a single chart, maximizing opportunities while spreading risk across your entire portfolio.
Timeframe Recommendation:
This product is designed for the 30-mi

Deixe um comentário após a sua compra para receber o manual do usuário. Market Sniper Pro é um Expert Advisor profissional projetado para operações de breakout com gestão adaptativa de posições. Combina a detecção de rompimentos com entradas escalonadas baseadas no ATR e controle global de risco, oferecendo uma abordagem estruturada e disciplinada. Principais características Tamanho de lote configurável e escalonamento automático pelo saldo Lógica de entrada por rompimento com lookback e buffer
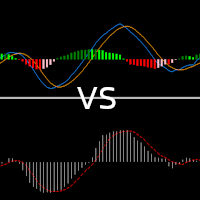
Optimized version of colored MACD indicator
MACD (Moving Average Convergence/Divergence) is a popular trading indicator used in technical analysis of securities prices. It is designed to identify strength, direction, momentum, and trend duration.
Default values: 12,26,9 MA Type: Exponential
Values i use:
8,21,5
MA Type: simple
Feel free to use what is work for you.
Trading interpretation:
MACD is positive when the histogram value is increasing, then upside momentum is increasing.
MACD i
Advanced BuySell Signals ATR Enhanced - Professional Trading Indicator Revolutionary Multi-Strategy Signal System with Real-Time Performance Analytics Transform your trading experience with this cutting-edge indicator that combines multiple proven technical analysis methods with advanced ATR-based risk management. Specially optimized for EURUSD H1 timeframe, this indicator delivers precise entry and exit signals with comprehensive performance tracking.
Key Features & Advantages Mult
DowAlgo Breaker EA works on Time and Price theory. As the price patterns change, there will be no difference in performance of the EA, which is why this system has long-term stability and performance. The EA finds important and valuable price and executes trades based on them.
This system works 100% automatically. Suitable for US30 index.
MT4 : https://www.mql5.com/en/market/product/145607 Public channel : https://www.mql5.com/en/channels/mqlexp
Note : If you have any problems running i

Valkyrie USDJPY – Special Launch Price! Special Price 50 USD Valkyrie USDJPY – Precision. Safety. Consistency. Valkyrie USDJPY is a fully automated Expert Advisor designed for traders who value stability, safety, and consistent growth .
It has been thoroughly tested and proven since 2020 , maintaining a 100% win rate for 5 years . Key Features: Proven Performance : Unbroken 100% win rate since 2020 . Safe & Transparent : No Martingale No Grid No Arbitrage No Hidden Risky Strategies Best Pair
Unlock Market Trends and Eliminate Noise with the Visual Dynamic Range Analyzer Are you tired of struggling with choppy markets and false signals? Do you find it difficult to identify the true trend direction amidst constant market noise? The Visual Dynamic Range Analyzer is the definitive tool designed to bring clarity and confidence to your trading, transforming complex market dynamics into simple, actionable visual signals. For just $30, this powerful indicator for MetaTrader 5 will become a

Visual Trend Flux Analyzer: Your Ultimate Guide to Market Momentum Unlock a clearer, more intuitive way to view market trends and momentum with the Visual Trend Flux Analyzer. This powerful indicator for MetaTrader 5 is designed to cut through market noise and provide you with a clean, visual representation of trend strength and potential reversals. Stop guessing the market's direction and start making informed decisions based on a sophisticated, multi-layered analysis. For just $30, you can eq

Of course. Here is an attractive and detailed description for the "Visual Pulse Dynamics Flow" indicator, designed for a sales page. Visual Pulse Dynamics Flow: Master Market Momentum Unlock a new level of market insight with the Visual Pulse Dynamics Flow indicator. Designed for the discerning trader who demands precision and responsiveness, this tool moves beyond traditional oscillators to provide a clearer, faster signal of market momentum and potential trend reversals. For just $30, gain an

Visual Dynamic Trend Analyzer: Your Ultimate Trend Trading Companion Unlock the power of clear, confident trend trading with the Visual Dynamic Trend Analyzer. This meticulously crafted indicator for MetaTrader is designed to eliminate market noise and provide you with precise, easy-to-follow buy and sell signals, transforming your chart into a clear map of market direction. For just $30, gain an indispensable edge in any market condition. The Logic Behind the Edge The Visual Dynamic Trend Anal

Welcome to InfinityGrid EA
InfinityGrid EA is a versatile grid trading system that allows you to set different calculation methods for points distance and lot sizes. The EA handles all calculations and executes trades automatically. Lot Size and Grid Calculations: Constant – same lot size for each new trade in the grid. Linear – lot size increases linearly with each new trade. Martingale – lot size increases using the martingale method. Fibonacci – lot size follows the Fibonacci sequence based

This Expert Advisor is a sophisticated, multi-indicator strategy designed for disciplined, trend-following trading. By combining Moving Averages (MAs) for trend direction, RSI for momentum, ATR for volatility, and ADX for trend strength, it meticulously filters for high-probability entry points. Its core feature is a 200-period Exponential Moving Average (EMA) filter that acts as a long-term trend confirmation, ensuring trades are only opened in the direction of the dominant market trend. The bo
Let me introduce you to an Expert Advisor, built on the foundation of my manual trading system. I upgraded this strategy with key tweaks and filters, so I’m dropping a trading bot that: · - Cruhes the market with an advanced strategy that worked for way over a decade, · - Works with Stop Loss orders to protect your capital, · - Can be used on own capital AND propfirms, · - Trades clean without a a martingale or grid system, · - Manages Nasdaq, Gold

Adaptive Momentum Wave: Unlock the Market's True Rhythm Tired of lagging indicators that get you into trades too late and whipsaw you in choppy markets? The Adaptive Momentum Wave is a next-generation trend analysis tool meticulously engineered to solve this exact problem. It dynamically adjusts to market volatility, providing you with a clearer, more responsive, and less noisy view of the underlying trend. Stop guessing and start trading with an indicator that thinks like the market moves. The

Unlock True Market Momentum with the Visual Volume Momentum Flow Indicator Are you tired of standard volume indicators that only tell you half the story? The Visual Volume Momentum Flow Indicator is a professional-grade tool designed to give you a decisive edge by dissecting market volume with unparalleled precision. Move beyond simple volume bars and see the real buying and selling pressure behind every price movement. The Logic: A Deeper Look into Volume This indicator is built on a sophistic

Visual Dynamic Price Alert: Your Personal Market Monitor Stop wasting hours watching charts for a price that may never come. The Visual Dynamic Price Alert is a professional and intuitive tool designed to do the watching for you. It transforms your trading platform into a smart, automated monitoring system, giving you the freedom to step away from your screen without ever missing a critical price movement. How It Works: Set Custom Price Alerts in Seconds The logic is simple, transparent, and pu
Você sabe por que o mercado MetaTrader é o melhor lugar para vender as estratégias de negociação e indicadores técnicos? Não há necessidade de propaganda ou software de proteção, muito menos problemas de pagamentos. Tudo é providenciado no mercado MetaTrader.
Você está perdendo oportunidades de negociação:
- Aplicativos de negociação gratuitos
- 8 000+ sinais para cópia
- Notícias econômicas para análise dos mercados financeiros
Registro
Login
Se você não tem uma conta, por favor registre-se
Para login e uso do site MQL5.com, você deve ativar o uso de cookies.
Ative esta opção no seu navegador, caso contrário você não poderá fazer login.