Conheça o Mercado MQL5 no YouTube, assista aos vídeos tutoriais
Como comprar um robô de negociação ou indicador?
Execute seu EA na
hospedagem virtual
hospedagem virtual
Teste indicadores/robôs de negociação antes de comprá-los
Quer ganhar dinheiro no Mercado?
Como apresentar um produto para o consumidor final?
Indicadores Técnicos para MetaTrader 5 - 47

The draws trend lines with adjustable trend width, with trend breakout settings and notifications of trend breakout (Alert, Sound, Email) and of a new appeared arrow. Arrows point at the direction of the order to open (BUY, SELL).
Parameters MaxHistoryBars - the number of bars in the history. Depth (0 = automatic settings) - Search area. width trend ( 0 = automatic settings) - Trend width. (true = closed bars on direction trend),(false = just closed bars for line) - true = closure of candlestic

The indicator is based on the relationship between two sets of Stochastic lines. The first set consists of 6 Stochastic with periods: 5, 8, 10, 12, 14, 16. The second set consists of 6 Stochastic with periods: 34, 39, 44, 50, 55, 60. These periods are customizable. Input parameters Stochastic MA Method Method of calculation ===== Short-term ===== Stochastic #1 %K Period Stochastic #2 %K Period Stochastic #3 %K Period Stochastic #4 %K Period Stochastic #5 %K Period Stochastic #6 %K Period Short
FREE

The Candle Smoother is an indicator for MetaTrader 5 that helps you see price movements more calmly and clearly. It removes unnecessary "market noise" and displays the true trend more effectively.
What does the "Candle Smoother Indicator" do?
It smooths the classic candlestick data (Open, High, Low, Close). This filters out chaotic, hectic candles. Additionally, an EMA line (Exponential Moving Average) is calculated based on the smoothed prices. This helps you better recognize where the market
FREE

Choose the best trading tool: The impact of news on the exchange rate of a currency pair! As a news source you can use: Terminal calendar or Investing.com website In the second case, you will additionally need the Get News5 utility. The indicator combines well with the Trade maker utility, providing multi-currency trading. Calculates: indices of the impact of current news on currency pairs, taking into account market expectations. actual trend directions for 5 customizable timeframes and levels

Logarithmic chart in new window You can use both chart as half or full window All features are active in both arithmetic and logarithmic charts Magnet in arithmetic chart is standard metatrader magnet in logarithmic chart magnet have two modes: first mode only select high or low, if this mode is enabled, you can set how many candles will be search before and after to find the highest or lowest points second mode select the closest point of the candle to click, its choose between 4 points (High,
FREE

Esse indicador utiliza o conceito NR7. Esse conceito diz que se a setima vela for a de menor range, isto é, menor diferença entre máxima e mínima de todas as 7 velas. O indicador marca essa vela com dois marcadores e fica aguardando o rompimento do range composto das 7 velas, isto é, a maior máxima entre as 7 velas anteriores e menor mínima entre as 7 velas anteriores. O indicador é chamado "Timeframe" porque digamos que tenhamos uma sessão de negociação que dura 9 horas, e temos a terceira vela
FREE

BinaWin NoTouch is an indicator that sends an alert signal when the trade is in the right position to wait for the breakdown of a side market.
It is specially designed to trade under the “No Touch” strategy of the Binary.Com platform with synthetic indexes N.10, N.25, N.50, N.75 and N.100
Similarly, trading can be done with the conventional CALL and PUT strategy of any Binary Options platform.
Requirements to use the indicator:
1. Have an account at Binary.Com
2. Configure the Binary.Com d
FREE

MACD indicators https://mql5.com This MACD indicator looks slightly different from the MACD indicator found in many other charting software. When the value of the signal line parameter is greater than the value of the MACD parameter, the indicator will give a buy prompt, and when the signal line parameter is less than the value of the MACD parameter, the indicator will give a sell prompt.
FREE

Se você está procurando uma maneira de melhorar seus resultados de negociação, então o indicador VWAPiEagleVision é o que você precisa! Este robô é programado para rastrear o VWAP em tempo real e usar essas informações para identificar tendências e oportunidades de negociação lucrativas.
O VWAP (Volume Weighted Average Price) é um indicador amplamente utilizado pelos traders para determinar o preço médio ponderado pelo volume negociado. Ele é comumente usado por traders institucionais e pode
FREE
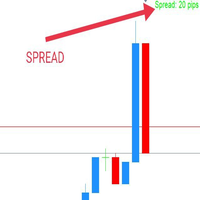
WaSpread MT5 Indicator shows the current spread in pips with color.
* Set the Spread Threshold and the color to identify when the current spread is below or above the Spread Threshold.
* Set X axis and Y axis and chose the Corner and the Anchor to position the Spread Label on the chart.
* Write the font and the font size for more confort.
* Activate alert if the current spread is above the spread threshold.
* For more precision, the user can choose to show the decimal numbers.
* The user
FREE

This indicator is a zero-lag indicator and displays exact trend as is. True Trend Moving Average Pro works best in combination with True Trend Oscillator Pro that displays strength of trend change.
True Trend Oscillator Pro: https://www.mql5.com/en/market/product/103589
If you set PERIOD input parameter to 1 this indicator becomes a sharpshooter for binary options.
Default input parameters: TT_Period = 10; TT_Meth = MODE_SMA; TT_Price = PRICE_MEDIAN;
Before you buy this product, please do t
FREE

We have all seen a currency pair enter the overbought or oversold territory and stay there for long periods of time. What this indicator does is gives you the emphasis. So if you are looking for reversals then you may want to take notice when oversold territory is entered into with a bullish engulfing candle or if the trend is your thing then check for bearish engulfing candles while entering oversold. This indicator will show a downward arrow when it detects a bearish engulfing candle while cro
FREE

O Escâner de Painel CCI do MT5 O Escâner de Painel CCI do MT5 é uma ferramenta que ajuda a monitorar os níveis do Índice de Canal de Commodities (CCI) em diferentes períodos e instrumentos, fornecendo alertas em tempo real quando uma nova sinalização é detectada. É fácil de usar e leve em poder computacional, garantindo um desempenho suave em qualquer computador. Principais Recursos Agrupamento Automático de Instrumentos : O escâner coleta todos os instrumentos da sua lista de Monitoramento de M
FREE

The volatility scanner indicator is a tool that helps traders identify and analyze volatility in all the market timeframes for the current chart. This way you can find potentially profitable trades on every timeframe for the current symbol.
What It Does? Scan all timeframes to find a volatility contraction. Color the button yellow if there is a volatility squeeze at that timeframe. Clicking on the button instantly changes timeframe.
How To Use It? Just put it on the chart and click on the yel
FREE
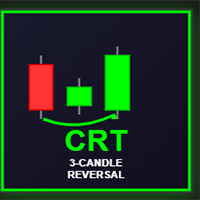
CRT Bomb Indicator - MT5 Full Version The CRT Bomb is a professional trading indicator that detects high-probability 3-candle reversal patterns (CRT - Candle Reversal Technique) across all timeframes and symbols. VPS is recomended so that you dont miss any CRT setups as they form , for entries you can use your manual analysis for confirmation like FVG, OBS etc Works on all Pairs ,Metals & Indices Key Features: Identifies impulse-trap-reversal candle structures Provides visual arrows and patter

MultiTimeframe Trend Pro shows you the market direction across 7 timeframes at a glance. Clear colors, no repainting, fully customizable. Perfect as a quick filter for any intraday or swing strategy.
Key Features Supports M1, M5, M15, H1, H4, D1 and W1
Colors MediumSeaGreen when the close is above the MA, and Red when below
No repainting → always based on the last closed candle for each timeframe
Fully customizable: MA period (200 by default) font, size and colors X/Y offsets, spacing
FREE

Análise de trading precisa na ponta dos dedos: software de análise de trading de última geração O software de análise de trading convencional disponível no mercado geralmente fornece apenas estatísticas de índice de lucro e perda por hora ou semana, o que não atende à necessidade de uma análise de trading mais precisa. No entanto, no mercado de trading real, cada dia apresenta circunstâncias únicas. As segundas-feiras são tranquilas, as quartas-feiras são ativas com juros noturnos triplos e as
FREE

Nós, na Stonehill Forex, estamos a publicar o nosso primeiro indicador desenvolvido internamente, que foi apresentado no site da Stonehill Forex em março de 2025. A versão original foi codificada para MetaTrader 4 (MT4) e, posteriormente, para MT5 e TradingView, com base no interesse da comunidade. Este indicador chega até si sem qualquer custo e inicia a nossa biblioteca.
É uma sobreposição de preço cruzado de duas linhas que, na sua essência, utiliza duas linhas de média móvel ponderada, pas
FREE

Positions panel
This is a panel for counting current icon holdings. Convenient traders at any time to view the position and profit and loss situation. Perfect for traders who like to hold multiple orders at the same time. Main functions: Position statistics Total profit Average price calculation TP price calculation ST price calculation Positions valume
FREE

O indicador Hyper Force, originalmente criado em 1984 pelo David Weis, indica em formato de ondas a força da tendência de um symbol. Quanto Maior a onda, maior é a força da tendência. Ondas pequenas quer dizer tendência fraca ou mercado sem tendência. Em uma onda, quanto maio a diferença entre uma barra e outra, mais forte é a tendência. Quando a distância entre uma barra e outra começa a diminuir, quer dizer que a onda começou a perder a força de tendência. Portanto pegar a onda com a força for
FREE

Highly configurable Force Index indicator. Features: Highly customizable alert functions (at levels, crosses, direction changes via email, push, sound, popup) Multi timeframe ability Color customization (at levels, crosses, direction changes) Linear interpolation and histogram mode options Works on strategy tester in multi timeframe mode (at weekend without ticks also) Adjustable Levels Parameters:
Force Index Timeframe: You can set the current or a higher timeframes for Force Index. Force Ind
FREE

Indicador Slope Channel para MetaTrader
Está procurando uma ferramenta para analisar tendências de mercado que se adapta a qualquer estilo de negociação? Slope Channel – é o seu assistente confiável para identificar movimentos de preços e níveis-chave do mercado! O que é Slope Channel? Slope Channel é um indicador inovador que constrói um canal inclinado no gráfico, calculando automaticamente seus parâmetros com base em extremos locais. Esta ferramenta destaca a melhor opção de canal, pe
FREE
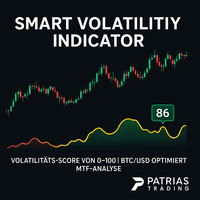
Smart Volatility Indicator – Precise Volatility Detection for MetaTrader 5 The Smart Volatility Indicator is an innovative tool for accurately measuring market volatility – specifically developed for MetaTrader 5. It combines candle range, wick ratios, and smart filtering logic into a clear, scalable volatility score from 0 to 100 . Perfect for traders who want to respond to breakouts, trend dynamics, or consolidating markets – manually or via Expert Advisors (EAs). Key Features Smart Volatility
FREE
RCH FX Spread + Bar Close Countdown Indicator
What This Indicator Does
A simple, professional tool that displays real-time spread information and bar closing countdown directly
on your MT5 charts.
Key Features
• Real-time spread display - Shows current spread in pips or points
• Bar close countdown timer - Exact seconds remaining until current bar closes
• Customizable alerts - Audio notification before bar closes
• Fully adjustable display - Position, colors, fonts, and sizing options
• Works o
FREE

The utility draws pivot levels for the selected timefram in classic method. Pivot = (high + close + low) / 3 R1 = ( 2 * Pivot) - low S1 = ( 2 * Pivot) - high R2 = Pivot + ( high - low ) R3 = high + ( 2 * (Pivot - low)) S2 = Pivot - (high - low) S3 = low - ( 2 * (high - Pivot)) you can change the timeframe, colors and fontsize. also you can change the text for the levels.
Have fun and give feedback...
FREE

Помощник для торговой системы SystZ . Чертит трендовые линии по соседним экстремумам зигзага. Условие для линии сопротивления - правый должен быть ниже левого. Для линии поддержки - правый выше левого. Не допускается, чтобы между экстремумами, по которым проводится трендовая линии были другие. Экстремумы, удовлетворяющие этим условиям, отмечены символом фрактала. Закрытие свечи за линией - сигнал для открытия позиции.
FREE

Monte Carlo simulation is an Indicator that uses a Monte Carlo model to calculate the probability of the price going up or down. If the price has a probability of going up or down more than 90%, the system will enter a trade by doing a back test of gold assets. It was found that it was able to generate a return of more than 20% in a period of 5 months while having a MAX DD of less than 7%.
What is a Monte Carlo simulation?
A Monte Carlo simulation is a model used to predict the probability of
FREE
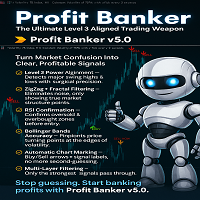
N/B: All our product purchase comes with our free ‘’DAILY SCALPER EA’’ - bit.ly/4qlFLNh Whatsapp Developer for yours after successful purchase
THE 4 GUARDIANS OF PROFIT BANKER
1. LEVEL 3 POWER INDICATOR (The General)
· Identifies MAJOR market turning points · Filters out noise and minor fluctuations · Only acts on significant high/low points
2. ZIGZAG FRACTALS (The Confirmer)
· Validates the Level 3 signals · Ensures swing point authenticity · Adds second-layer confirmation

HolyGrail M N/B: All our product purchase comes with our free ‘’DAILY SCALPER EA’’ - bit.ly/4qlFLNh Whatsapp Developer for yours after successful purchase
m ost wanted Edition Overview ATTENTION ALL TRADERS!
FINALLY UNVEILED: The "HolyGrail MostWanted" Indicator - Your All-in-One Institutional Trading Dashboard for MetaTrader 5
SPECIAL BONUS (VALID TILL JUNE 2026)- OUR DAILY SCALPER EA for BTCUSD and VIX75 •·································································•

SSACD - Singular Spectrum Average Convergence/Divergence This is an analogue of the MACD indicator based on the Caterpillar-SSA ( Singular Spectrum Analysis ) method. Limited version of the SSACD Forecast indicator. Limitations include the set of parameters and their range.
Specificity of the method The Caterpillar-SSA is an effective method to handle non-stationary time series with unknown internal structure. The method allows to find the previously unknown periodicities of the series and make
FREE
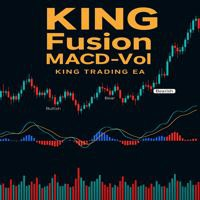
- وصف المنتج - مؤشر احترافي متكامل
لا يعد KING Fusion MACD-Vol من KING TRADING EA مجرد MACD آخر — فهو عبارة عن مجموعة أدوات تداول كاملة تجمع بين مؤشرات احترافية متعددة في نافذة فرعية واحدة أنيقة. لم تعد بحاجة إلى تحميل مخططك بأدوات منفصلة. يجمع هذا المؤشر بين:
MACD مع خطوط مزدوجة ورسم بياني مكبر
رسم بياني ملون ومثبت بالحجم
ملصقات ديناميكية مع قيم المؤشرات في الوقت الفعلي (ATR، ADX، RSI، Volume)
عداد تنازلي للبار
التنبيهات المتقاطعة (مرئية + صوتية)
كل ما تحتاجه من الوضوح والسرعة والدقة -
FREE
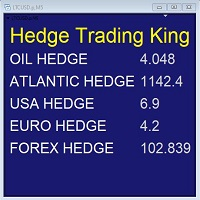
Hedge Trading Monitor e' il mio indicatore che monitora a colpo d'occhio la differenza o il ratio tra due asset utili per fare Hedge trading.
Come si utilizza + scaricare l'indicatore + applicare l'indicatore su un grafico aperto + si possono cambiare gli asset agendo nelle impostazioni.
Distribuzione + e' distribuito solo su MQL5.vom + licenza gratuita (FREE)
FREE
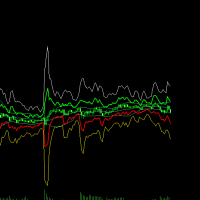
Here's a clearer, more organized description for the indicator: An enhanced ATR Bands indicator that provides flexible, configurable price bands based on Average True Range (ATR). While traditional ATR-based indicators often have limitations in their configurability and functionality, this version offers comprehensive features for both stop-loss and take-profit level calculations. Key Features: Configurable source price (close, high, low) for ATR band calculations Adjustable scaling factors wit
FREE

ATRRange-MT5-Ind — an indicator for MetaTrader 5 that builds volatility channels based on ATR with three multiplier levels. Indicator: Calculates ATR — uses the standard Average True Range Draws three channels around the closing price: Top1/Bottom1 (blue) — Close ± ATR × Multi1 Top2/Bottom2 (orange) — Close ± ATR × Multi2 Top3/Bottom3 (red) — Close ± ATR × Multi3 Dynamic levels — channels automatically expand/contract depending on volatility Parameters ATR Period : ATR period Default: 14 Multi1
FREE

SATORI Monthly Trade Statistics V15 Overview :
An MQL5 Expert Advisor for MetaTrader 5 that visualizes trading performance by month and week, offering a customizable interface to track profits. Key Features : Profit Tracking : Displays monthly and weekly profits, color-coded (green for positive, orange for negative). Customizable : Set time range, magic number, font size, and button sizes; hide zero-profit months. Interactive UI : Toggle month details, update profits, and adjust display scale wi
FREE

The indicator is designed for displaying the following price levels on the chart: Previous day's high and low. Previous week's high and low. Previous month's high and low. Each of the level types is customizable. In the indicator settings, you set line style, line color, enable or disable separate levels.
Configurations ----Day------------------------------------------------- DayLevels - enable/disable previous day's levels. WidthDayLines - line width of daily levels. ColorDayLines - line
FREE

This indicator solves the problem of chart scaling where the bar becomes too thin and it becomes difficult to determine the bar's open and close prices.
Thick Bar indicator - allows you to change the thickness of the lines and the color of the stroke, due to which you can get a thicker bar on the chart. The default indicator has a bar thickness of 2 and preset colors that can be changed in the settings
FREE

这是一个组合指标分析趋势、支撑阻力、买卖点。运用了均线MA、布林带、KDJ、CCI、RSI。 主图上下线是布林带上下线,采用的是20周期和2.3标准差可以用来支撑阻力。 中间的是分析趋势的均线,趋势分析是用均线多周期: 为涨趋势,反之为下跌趋势。在同一种颜色,基本说明趋势没有发生变化。 子图是由 KDJ、CCI、RSI三个指标组成,大于70超买,小于30超卖, 智能提示是运用了算法,主要计算布林带, KDJ、CCI、RSI指标
有三个或四个指标超出市场常态就会发出提示行情可能反转。 子图指标运用了很多数据,刚刚开始加载会有点慢,耐心等待就可以 这个指标是主图指标,还要再下我发布的RCD分析,这样就刚刚好组成一套分析 电脑分辨率的文本大小请设置100%,不然字体会不一样
FREE
Hi Traders, RSI and Stochastic are among the most popular indicators used to measure momentum and help identify overbought and oversold conditions. This indicator displays two optional RSI and Stochastic values on your chart, helping you save chart space and keep things clean and organized. You can set your desired upper and lower thresholds for RSI and Stochastic to monitor conditions. If the RSI (or Stochastic) value is between the upper and lower thresholds, the text color will remain your de
FREE

Kindly rate and comment about the product for upgradation & Support
The 5 EMA is plotted in green color ( Lime ). The 14 EMA is plotted in red color ( Red ). The 20 EMA is plotted in blue color ( Blue ). The 200 EMA is plotted in black color ( Black ). The 200 EMA is plotted in yellow color ( Yellow ).
The Quarter EMA that provided calculates and plots four Exponential Moving Averages (EMAs) on the chart using different periods: 5, 14, 20, and 200. Each EMA is
FREE

AP Session Boxes — Asian / London / NY Range Overlay (MT5 Indicator) Clean session boxes on your chart.
This lightweight indicator draws the Asian , London , and New York time windows directly on the chart, including each box’s high and low as dashed lines. It’s perfect for quick context, breakout planning, and clean screenshots. Instant structure: See where the market ranged during key sessions. Breakout prep: Use the hi/lo lines as reference for pending orders or alerts fr
FREE
Este indicador é um monitor avançado de posições em perda , projetado para ajudá-lo a reagir a tempo e proteger seu capital. Ele analisa em tempo real todas as operações abertas no símbolo atual, calcula a volatilidade usando o ATR em múltiplos timeframes e determina o quão perto o preço está do seu Stop Loss. Ele exibe linhas visuais ( Stop Loss dinâmico e Break-Even ) e um painel estilo Bloomberg com informações-chave de cada operação: Porcentagem de perda em relação ao seu saldo Distância até
FREE
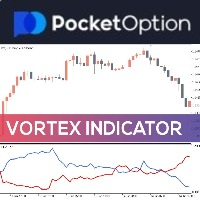
Vortex Indicator with Alert System for MT5 Overview
The Vortex Indicator with Alert System is a trend-following tool designed to help traders identify market direction and momentum shifts. This MetaTrader 5 (MT5) indicator analyzes positive and negative vortex movements (+VI and -VI) and generates buy and sell crossover signals with visual markers and customizable alerts. Directional Momentum Detection: Tracks +VI and -VI crossovers for trend confirmation. Crossover Alerts: Notifies traders of

Pinbar Outside Pattern indicator shows in a table symbol, time frame and direction of the last price candle if it matches outside pinbar input parameters. Outside pinbar means that the candle is extreme in the chosen time frame. By clicking ' Open chart ' button you can view drawn pattern. You can choose to scan through all the symbols in Market Watch or enter your favorite symbols, and also you can enter time frames you need to scan. ---------Main settings-------- Select all symbols from Market
Overview
MAM Forecast is an indicator designed to replace guesswork with probabilities. It generates two adaptive levels—UP and DN—along with probabilities that always sum to 100%, giving you a clear idea of which level price is more likely to reach within the chosen horizon. Key Features Displays UP (upper) and DN (lower) adaptive levels calibrated to market volatility. Shows touch probabilities (e.g., 62% vs 38%) for likelihood within the defined horizon. Clean, informative HUD indicates sym
FREE

The Forex Gangster Indicator allows you to determine the current trend. If the Forex Gangster Indicator line has moved below the price and turned blue, then you should open deals for an increase. If the Forex Gangster Indicator line has appeared above the price and turned red, then you should open deals for a decrease: The indicator is suitable for any time frames, but it needs to be supplemented with filtering indicators, since by itself it is late and does not have time to give an accurate si
FREE

About This Indicator: RSI vs SMA Oscillator: A Comprehensive Technical Analysis Tool for Better View of Market Price
The RSI vs SMA Oscillator is a powerful technical analysis tool designed to understanding Market Price Fluctuation for buy or sell signals. This user-friendly Oscillator good for both novice and experienced traders, providing valuable insights into market trends and price movements. Key Features: - RSI Cross Alert: The indicator is based on the Relative Strength Index (RSI), a pop
FREE

This tick indicator draws synthetic bars/candlesticks that contain a definite number of ticks. Parameters: option prices - price option. It can be Bid, Ask or (Ask+Bid)/2. the number of ticks to identify Bar - number of ticks that form OHLC. price levels count - number of displayed price levels (no levels are displayed if set to 0 or a lower value). calculated bar - number of bars on the chart. Buffer indexes: 0 - OPEN, 1 - HIGH, 2 - LOW, 3 - CLOSE.
FREE

Fisher Transformation Indicator for MT5 – Spot Trend Reversals Before They Happen! The Fisher Transformation Indicator is your go-to tool for crystal-clear market movement detection. Through mathematical transformation of price data, it delivers unmistakable buy and sell signals – right there in your chart where you need them.
Key Benefits: Early Warning System for Trend Changes – catch uptrends and downtrends before the crowd Crystal Clear Buy & Sell Signals – color-coded for instant recogniti
FREE

O Indicador Supertrend para MT5 é uma ferramenta poderosa de acompanhamento de tendências projetada para ajudar os traders a identificar a direção do mercado com precisão. Baseado no Average True Range (ATR) , ele se ajusta dinamicamente aos movimentos do preço, tornando-se adequado para diversos estilos de trading, como scalping, day trading e swing trading.
Principais características: • Detecção precisa de tendências – Identifica claramente tendências de alta e baixa com uma linha
FREE

O Indicador TRIXe é a combinação do indicador TRIX (Triple Exponential Moving Average) com adição de um sinal tipo EMA (Exponential Moving Average). Fornece sinais de continuidade de tendência e inicio de uma nova tendência. Os pontos de entrada e saída de operações ocorrem quando as curvas do indicador se cruzam. Tem melhor desempenho quando combinado com outros indicadores.
FREE

ATR Accelerator Indicator informs you about strong price movements based on the ATR Indicator. This Indicator works for all Timeframes and Symbols, the strength of movements can be configured.
Important: Get informed about new Products, join our MQL Channel: https://www.mql5.com/en/channels/etradro
Useage This Indicator works for all Timeframes and Symbols, the strength of movements can be configured. Features works on all timeframes and forex pairs or indices. Alert and Notify function inc
FREE

Reversal Oscillator — Advanced Momentum Shift Detector
Reversal Oscillator is a free indicator designed to highlight price zones that are statistically outside their normal movement patterns, helping traders anticipate potential turning points before they occur. Unlike traditional oscillators that react mainly to overbought/oversold conditions, this indicator applies third derivative analysis (the "acceleration of the acceleration" of price) calculated using two independent methods within a n
FREE
O indicador permite determinar instantaneamente a tendência atual por cor e níveis de Fibonacci. O painel HTF mostra a tendência atual de períodos mais altos, ajudando a determinar a força da tendência. Negocie na tendência ao mudar a cor das velas ou negocie contra a tendência quando o preço rompe os níveis extremos do indicador FIBO Trend PRO Benefícios do FIBO Trend PRO: O indicador nunca repinta ou altera seus valores Muito fácil de usar e intuitivo Aplicável a qualquer símbolo: FX-moedas, a

Simple candle countdown - never again miss how much time is left to open a new bar!
This indicator doesn't plot any line on the chart - it uses only objects and calculates the time left to open a new bar.
You can set custom colors for the panel background and border and for the text color. Simple as that, the indicator is ready to use.
If you find any bugs, feel free to contact me.
FREE

The ShowSessions indicator for MT5 shows up to two, self-selected, time intervals, for a free choosen number of days past and a few future days. Weekends are marked with an additional red vertical line. The indicator makes manuel backtesting of strategies more easily, but you can use ist for daily trading as well. Please note that the server time does not always correspond to the actual time.
FREE

Synthetic Timeframe Creator
Professional Custom Timeframe Visualization for MetaTrader 5
Revolutionize your multi-timeframe analysis with Synthetic Timeframe Creator.
Tired of switching between charts? Need to analyze specific time cycles that don't exist in standard timeframes?
This is your ultimate solution. Create custom D2, D3, W2, W3 (or any N-period) candles directly on your MT5 chart without needing custom symbols or complex workarounds.
KEY FEATURES
Flexible Timeframe Synthesis
Choos
FREE

PreCogniTrade : Un Indicador Técnico Avanzado para Predecir el Mercado (Fase Beta) El PreCogniTrade es un indicador técnico revolucionario diseñado para los traders que buscan una ventaja competitiva en los mercados financieros. Este indicador no solo analiza las tendencias actuales, sino que también predice los movimientos futuros de los precios con una precisión asombrosa, lo que lo convierte en una herramienta de incalculable valor para cualquier estrategia de trading. Características Pri
FREE

Trading Signal for MetaTrader5 PC platform
The Signal is based on the Investologic EA trend strategy . Trend following indicator’s and oscillator’s, can work with any symbol or market in MT5 platform FOREX, GOLD, OIL, STOCKS, INDEXES, NASDAQ SPX500 The strategy
the strategy uses multi time frame combination of indicators and moving averages to find the best entry point wen the fast MA slow MA Crossover And Stochastic , RSI , Average Directional Movement Index ,combined together to
FREE

This indicator provides common shapes as drawing object options. The shapes are rotatable, resizable, draggable, and will keep their proportions (according to their handle trendline) across different chart scales. Multiple drawings are supported.
Shapes: Square Rhombus
Triangle (quadrilateral & isosceles) Circle (grid, overlapped grid, flexi grid, rotatable grid, concentric circles) Features: rays (all object edges will be rays) show/hide each individual drawing type, or all delete last drawn ob
FREE

Tired of manually clicking through every chart just to check the current spread or overnight swap fees? The Dynamic Spread and Swap is a must-have utility that solves this problem by displaying all critical cost information for your favorite trading symbols in one clean, convenient dashboard. This lightweight tool automatically detects all symbols from your open charts and presents the data in a non-intrusive panel on your screen. Stop guessing your trading costs and start making more informed
FREE

Volume Difference - This indicator was created to make it easier to read price and volume charts. It's designed to eliminate the need to calculate the difference between past and current volumes. This indicator was created to simplify this process. Surprisingly, I couldn't find such a simple indicator anywhere, so I present it to you.
This indicator is indispensable for use in complex trading models where the dynamics of volume change, rather than absolute values, are important.
I can share t
FREE
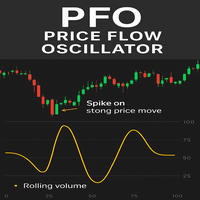
PFO Price Flow Oscillator – MT5 Indicator
The PFO Price Flow Oscillator is a highly advanced tool designed to help traders anticipate explosive price movements and identify market momentum with precision.One of its most powerful features is the ability to anticipate explosive price moves before they occur, giving traders an early edge in volatile markets. Unlike standard oscillators, the PFO does not rely on price alone—it integrates multiple market factors to provide clear, actionable insight
FREE

One of the simplest Pivot Point indicator, easy to operate, and most complete for a single chart in determining Resistance and Support level lines.
In single chart, it will show R&S Level Line with 5 popular types of Pivot Point, Highest&Lowest of closing price Include the Trend and up to 3 Time Frames.
Five types (Floor, Woodie, Camarilla, DeMark, & Fibonacci) of popular Pivot Points in determining Resistance and Support levels. With just using simple button on the
FREE
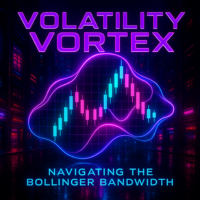
Volatility Vortex - Sistema Avançado de Análise de Volatilidade Descrição do Sistema Volatility Vortex é um indicador avançado "tudo-em-um" baseado na análise da Largura das Bandas de Bollinger (Bollinger Bands Width), projetado para: Detectar em tempo real os ciclos de expansão e contração da volatilidade com precisão superior Visualizar através de uma interface otimizada: Área BBW com coloração dinâmica e preenchimento entre BBW e MA (verde = largura crescente, vermelho = largu

O Fuzzy Trend MTF é um indicador de análise de tendência multitemporal que utiliza lógica fuzzy para fornecer uma leitura clara, intuitiva e confiável da direção do mercado. Indicado para qualquer ativo volátil.
Lógica Fuzzy + Múltiplos Timeframes Através de regras fuzzy aplicadas a múltiplos timeframes (configuráveis individualmente), o indicador avalia o comportamento dos candles e pontua a força direcional do mercado em uma escala de -100 a +100 : +100 representa forte tendência de alta, -10
FREE

Candle MAXIMUS RITZ Candle MAXIMUS adalah indikator visual cerdas yang menggabungkan kekuatan analisis tren berbasis Kaufman Adaptive Moving Average (KAMA) , informasi perubahan harian (Daily Change), perbandingan OHLC terhadap hari sebelumnya, serta panel dominasi bar multi-hari. Dirancang untuk semua pair dan semua timeframe, indikator ini menghadirkan tampilan modern, bersih, serta informatif dalam satu panel kompak di chart Anda. Fitur Utama Trend Candle Warna Adaptif (Color Candles) Warna
FREE

It is the simplest indicator in existence. It has only one function: report the seconds elapsed since the last minute end in a very convenient way, with a label that can be moved in the chart, so that the trader does not have to take his eye off the forming candle. It is used on M1, but also on larger intervals, for those interested in opening/closing positions at the best time. Sometimes an intense movement in the last 10" of the minute gives indications of future trend, and can be used for sc
FREE

عنوان: محلل الدعم والمقاومة الذكي
وصف مختصر: يقوم بتحديد مستويات الدعم والمقاومة الرئيسية بشكل ديناميكي، مع تسليط الضوء على نقاط المحور الحاسمة وأعلى الارتفاعات وأدنى الانخفاضات لاتخاذ قرارات تداول دقيقة.
الوصف الكامل: أطلق العنان لقوة تحليل السوق الديناميكي مع SmartSRAnalyzerR! يرصد هذا المؤشر المتقدم تلقائيًا قمم وقيعان نقاط المحور، ويحسب أقرب مستويات الدعم والمقاومة، ويعرضها بوضوح على مخططك البياني.
الميزات الرئيسية:
الدعم والمقاومة الديناميكية: تحدد تلقائيًا المستويات الرئيسية استنادًا
FREE

This indicator is EXCLUSIVELY to be used on the Brazilian stock exchange "B3". It automatically calculates the yesterday's Settlement Price (Ajuste) of the Symbol "DOL". It uses a mathematical calculation over the ticks received from the borker server, it DOES NOT access external sources (websites, HTTP connections, etc) so it is safe and totally reliable! For practical purposes and to maintain the longevity of the indicator it was added in the Parameters the ability to control the Time Range in
FREE
O Mercado MetaTrader é o melhor lugar para vender robôs de negociação e indicadores técnicos.
Você apenas precisa desenvolver um aplicativo para a plataforma MetaTrader com um design atraente e uma boa descrição. Nós vamos explicar como publicar o seu produto no Mercado e oferecer a milhões de usuários MetaTrader.
Você está perdendo oportunidades de negociação:
- Aplicativos de negociação gratuitos
- 8 000+ sinais para cópia
- Notícias econômicas para análise dos mercados financeiros
Registro
Login
Se você não tem uma conta, por favor registre-se
Para login e uso do site MQL5.com, você deve ativar o uso de cookies.
Ative esta opção no seu navegador, caso contrário você não poderá fazer login.