Pivot levels
- Indicadores
- Versão: 1.11
- Atualizado: 3 abril 2023

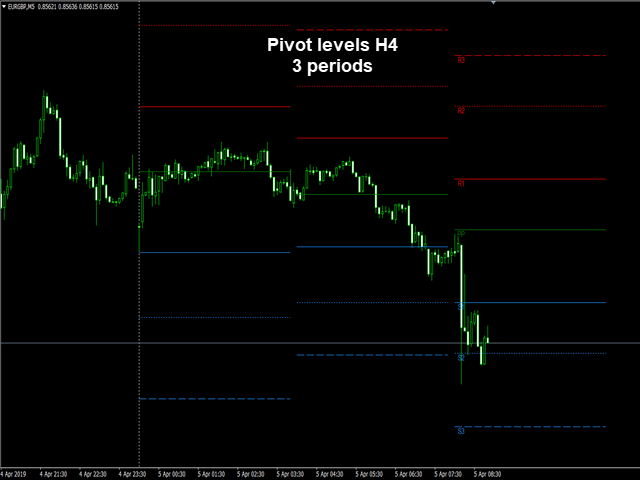
Pivot levels is indicator showing 7 pivot levels. It is adjusted for major use, including:
- all standard time frames
- choice of periods to show
- three popular calculation formulas (typical, median, weighted)
- 9 level Camarilla pivot
- pivot day shift
- choice of properties for lines and labels
- choice of showing alerts when crossing pivot lines
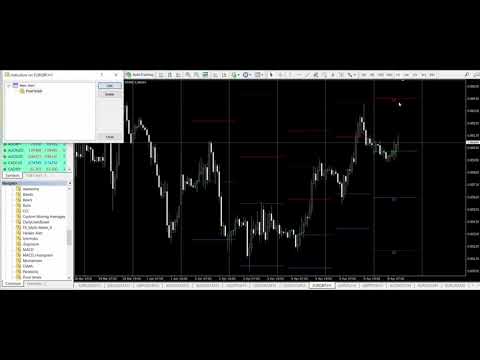
Parameters:
----------Main parameters-----------
- Timeframe - time frame for pivot levels
- Number of periods to show - displays pivot levels for number of periods
- Formula for calculation - four calculation formulas (typical, median, weighted and Camarilla) can be chosen
- Pivot day shift - offset from GMT time
----------Lines and labels-----------
- Extend lines for last period? - if true last period pivot lines are extended
- Show transitions between periods? - if true transitions are shown, if false transitions are hidden
- Show labels? - if true labels are shown, if false labels are hidden
- Font size for labels - enter font size for labels
- Bar offset for labels - enter number of bars to shift the position of labels (+ to the right)
- Pivot line color - choose the line color
- Pivot line style - choose the line style
-----------------Alerts-----------------
- Show alerts? - if true alert is shown when price crosses pivot level, if false non alerts are displayed
- Send push notification when price crosses levels? - if true notification is sent to your mobile when price crosses pivot level
For rebates go to https://premiumtrading.co/?ref=13525 and choose broker.

Perfect for Pivot trading! I just wish it included mid-Pivots