Conheça o Mercado MQL5 no YouTube, assista aos vídeos tutoriais
Como comprar um robô de negociação ou indicador?
Execute seu EA na
hospedagem virtual
hospedagem virtual
Teste indicadores/robôs de negociação antes de comprá-los
Quer ganhar dinheiro no Mercado?
Como apresentar um produto para o consumidor final?
Indicadores Técnicos para MetaTrader 4 - 33

Resistance and Support is an easy to use indicator to apply horizontal lines of resistance and support. There are two windows for adding levels. When you press the button, a line appears on the price chart. It is possible to double-click this line with the mouse to activate and move it, thereby changing the indicator readings. In the indicator menu there is a choice of possible alerts - no alert, alert on touching the level an alert for closing the candle after the level.
FREE
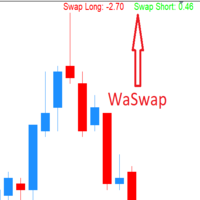
WaSwap MT4 Indicator shows the current Swap Long and current Swap Short with color.
* Set the Swap Threshold and the color to identify when the current swap is below or above the Spread Threshold.
* Set X axis and Y axis and chose the Corner and the Anchor to position the Swap Label on the chart.
* Write the font and the font size for more confort.
* Activate alert if the current Swap Long or the current Swap Short is below the swap threshold.
* The user will never swing with a negative sw
FREE

An extended version of the indicator for visualizing the time ranges of key trading sessions: Asian, European and American. The main advantage of this indicator is the automatic construction of a price profile for a trading session. The indicator has the functionality to set the start and end time of each trading session, as well as automatically determine the time zone of the trading server. The indicators include the ability to work with minimal CPU usage and save RAM. In addition, the option
FREE

MQLTA Candle Timer is an indicator that can show you the details about a symbol/pair and alert you before the close of a candle. Used in swing trading and not only, it can help your strategies knowing and be ready before the close of a candle.
How does it work Simply add the indicator to the chart and set the notifications options. You can load a minimalistic interface or a full interface. The alert will be sent once per candle.
Parameters All the parameters, that you can see in the picture, a
FREE

This is Fibo Expansion. You can use it, as profit target at any level... It use price Highs and Lows and price between... It is simple and easy to use... No Input menu, just drag it on your chart and it ready to use... The blue and red dot color indicate it direction... It also use as the same as fractal high and low price as the points to construct the levels... No more analysis to choose the points..
FREE
I decided to list it for free. Combined Informer of DeMarker with RSI MTF. Each parameter can be change values in menu. it is good for scalping or for weekly trading and looks as universal fx-toy. Now I use it for BTC, ETH, BNB. In menu you can turn on daily percentage gain info, weekly and monthly gains also included as informers. Short ATR helps to determine when price was slow/stopped and entry for pulse pump/dump. The filter of numbers of RSI can be tuned for overbought/oversold values w
FREE
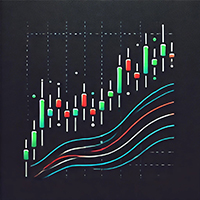
This is simple indicator for displaying Multi Moving Average line in chart, with one single Indicator. Just place the indicator in your chart, select how many MAs you want to display. And you are ready to go. Parameters can be changed on the fly by the control panel provided by the Indicator. This indicator are still in development, if you have any further feature request, please let me know in the comment.
FREE

White Crow Indicator
by VArmadA A simple yet powerful candle analysis based indicator using the White Soldiers & Crow patterns.
Works with timeframes 1H and higher and tested on all major pairs. Pay attention to the signal: An arrow indicating a long or short entry.
How It Works:
Arrows indicate a ongoing trend. After multiple bullish or bearish candles in a row the chances for another candle towards that trend is higher.
Instructions: - Crow Count: Set the number of candles that need to s
FREE
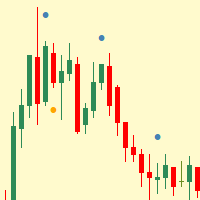
Simple indicator that shows internal (inside) bars.
Internal bars are probably one of the best price action setups to trade Forex with. This is due to the fact that they are a high-chance Forex trading strategy. They provide traders with a nice risk-reward ratio for the simple reason that they require smaller stop-losses compared to other setups. They can also be successfully utilised as reversal signals from key chart levels. Inside bar is a series of bars contained within the range of the co
FREE

Introduction The ST Cross indicator is based on the traditional Moving Average (MA) Cross which uses a fast and slow moving average. Entry signals to buy and sell are given when both moving averages cross. However with the basic strategy there are a lot of false signals. In order to filter the trades we use the 200 (MA) to identify the overall direction of the trend. Input Settings Master Trend Period - 200 Period moving average used to get the trend direction. Fast
FREE

Индикатор пригодится тем, кто использует кластеры Фибоначчи в торговле и применяет построения с разными наборами уровней. Каждый набор уровней применителен как к уровням Retracement , так и к Expansion (выбирается в настройках). Уровни задаются перечислением в формате "0;50;61.8;100". Настройки индикатора: Fibonacci #1 – Набор уровней #1 Fibonacci – Тип уровней : Retracement или Expansion Levels – Набор уровней в формате "0;23.6;38.2;50;61.8;100" Color line – Цвет линии Style line – Стиль линии
FREE

Indicador "Heikin Ashi Master" para MetaTrader: Transforma tu Análisis con Velas Japonesas Suavizadas El indicador "Heikin Ashi Master" es una herramienta innovadora diseñada para traders que buscan una perspectiva única del mercado a través de las Velas Japonesas. Compatible con MetaTrader, este indicador suaviza la acción del precio, ofreciendo una interpretación simplificada y visualmente atractiva de las tendencias y cambios en el mercado. Características Destacadas: Suavizado de la Acción
FREE

Secured Profits – Veja instantaneamente os seus lucros realmente assegurados Sabe quanto lucro está realmente a proteger em cada operação?
Secured Profits é um indicador inteligente e poderoso para MT4 que exibe, em tempo real, o valor monetário exacto do lucro efectivamente assegurado pelos seus stop-losses , com base nas suas operações abertas. Ao contrário de outras ferramentas, Secured Profits não se limita a somar o lucro flutuante "visível" ou o lucro protegido por stops. Vai mais além
FREE

The indicator automatically calculates the balanced price value. It shows in which direction and by how much the balanced price value is currently shifted. Works on all timeframes, on any currency pairs, metals and cryptocurrencies. Can be used when working with binary options. Distinctive features Not redrawn; Simple and fast setup; Clear interpretation of readings; Works on all timeframes and on all symbols; Suitable for trading currencies, metals, options and cryptocurrencies (Bitcoin, Liteco
FREE

Introducing the Professional Arka STM Signal Indicator
With Arka Candle Close Time – 100% Free Version Fast, Accurate, and Unmatched in Identifying Trading Opportunities
This indicator is the result of combining advanced price action analysis with specialized market algorithms, delivering clear, timely, and profitable signals. Completely Free – No Installation or Usage Limits
️ An automated trading bot, fully synchronized with it, is also ready to run. The Power of ARKA STM Si
FREE

Double Moving Averages with Special Time Frame and Fibonacci (DMA_Special_TF_with_Fibo) Author: Mir Mostofa Kamal
Version: 1.00
Platform: MetaTrader 4 (MT4) Overview Double MA With Special Time Frame with Fibo is a powerful, all-in-one custom indicator designed for traders who want to combine moving average crossover strategies with multi-time frame logic and Fibonacci retracement levels . It intelligently adapts its behavior based on the current chart time frame and adds visual and audibl
FREE

The TLR indicator is a market trend identification indicator. The idea behind this indicator is to use 3 linear regression lines, one short-term, one medium-term, and one long-term. The UPTREND will be determined when: The long-term linear regression line and the medium-term linear regression line have an uptrend. The long-term linear regression line has an uptrend, the medium-term linear regression line has a sideway, and the short-term linear regression line has an uptrend. The DOWNTREND will
FREE

Título do produto Smart Bears (MT4) – parte da série SmartView Descrição breve Indicador Bears com experiência de usuário única na plataforma MetaTrader. Oferece capacidades avançadas não disponíveis anteriormente, como abrir configurações com duplo clique, ocultar e mostrar indicadores sem excluí-los, e exibir a janela do indicador em tamanho completo do gráfico. Projetado para funcionar perfeitamente com o restante da série SmartView Indicators. Visão geral A série SmartView oferece uma experi
FREE

This indicator was modified according to the 'Way Of The Turtle'. It generates a channel based on the opening price and ATR values of the current bar. Turtle ATR Channel can be used to help identify overbought and oversold conditions in a market.
Calculation upper channel = Open + r1*ATR lower channel = Open - r2*ATR Among them: Open is the opening price of the current bar. ATR is the ATR value of the current bar. r1, r2 are the ATR ratios.
Input Parameters ATR Period - set the period of the A
FREE
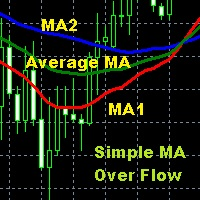
Moving Average is one of the indicators that is widely used in technical analysis which can help to smooth price movements by eliminating some price fluctuations that are less relevant based on past price calculations, so that an average line of price movements is formed within a certain time period. Simple Moving Average Over Flow is an indicator writen by MQL$ language that is given a special additional moving average line based on certain calculations so as to make this moving average better
FREE

Introducing CCI Jurik—a dynamic indicator designed to elevate your forex trading experience by integrating custom moving averages based on the Commodity Channel Index (CCI) with the MetaTrader 4 indicator, CCI.
Jurik moving averages are renowned for their accuracy and reliability in analyzing price movements in the forex market. They offer traders a smoother representation of price action, reducing noise and providing clearer signals for identifying trends and potential reversals.
The Commodi
FREE

Summorai Este indicador soma até 5 médias móveis de diferentes símbolos e as coloca convenientemente no seu gráfico. Como usar? Basta arrastar o indicador para um gráfico e inserir os nomes dos símbolos exatamente como aparecem na sua janela de observação de mercado. Dessa forma, você pode acompanhar a tendência global o tempo todo. Exemplo de uso: Você negocia DAX40 no gráfico do indicador, é bom incluir Nasdaq100, S&P500 e Dow30 para confirmar a tendência. Exemplo 2: Você negocia XRP, mas quer
FREE
Indicador Gratuito desarrollado por Mr Beast Inversiones Mr Beast : Gestión de riesgo profesional. Brindo a la comunidad la entrada a productos de M Beast. Echar un vistazo a mis señales y expert advisors. Descuentos de hasta 70% Diclaimer: La negociación en Forex, CFD y Opciones conlleva un riesgo de pérdida sustancial y no es adecuada para todos los inversores. El alto grado de apalancamiento puede actuar en su contra y también en su favor, Antes de decidirse a operar en productos tan apalanca
FREE

This simple information indicator shows the name of the current day and past working days, months and years.
On the concept of time and timeframe It is common knowledge that a timeframe is a time interval considered in technical analysis of free financial markets, during which the price and other market data changes occur when the price charts are plotted. In the MetaTrader 4 trading terminal, these periods are separated by vertical dashed line, which can be enabled or disabled by simply pressi
FREE

QuantumAlert RSI Navigator is a free indicator available for MT4/MT5 platforms, its work is to provide "alerts" when the market is inside "overbought and oversold" regions in the form of "buy or sell" signals. This indicator comes with many customization options mentioned in the parameter section below, user can customise these parameters as needful. Join our MQL5 group , where we share important news and updates. You are also welcome to join our private channel as well, contact me for the pri
FREE
Highly configurable Force Index indicator. Features: Highly customizable alert functions (at levels, crosses, direction changes via email, push, sound, popup) Multi timeframe ability Color customization (at levels, crosses, direction changes) Linear interpolation and histogram mode options Works on strategy tester in multi timeframe mode (at weekend without ticks also) Adjustable Levels Parameters:
Force Index Timeframe: You can set the current or a higher timeframes for Force Index. Force Ind
FREE

This indicator provides common shapes as drawing object options. The shapes are rotatable, resizable, draggable, and will keep their proportions (according to their handle trendline) across different chart scales. Multiple drawings are supported.
Shapes: Square Rhombus
Triangle (quadrilateral & isosceles) Circle (grid, overlapped grid, flexi grid, rotatable grid, concentric circles) Features: rays (all object edges will be rays) show/hide each individual drawing type, or all delete last drawn ob
FREE

Just INDY is a simple, and easy to use trend and reversal indicator. It will continuously monitor the movement of the price actions searching for new trends establishing or strong reversals at extreme overbought, and oversold levels.
Parameters Signal Perios
Sent Notification Please Test it with Strategy Tester and see how it work.
Happy Trading...
FREE

The indicator displays two Moving Average lines on the chart with parameters specified in the settings. It issues a signal in the form of arrows and a sound at the intersection of these Moving Average. In the indicator settings, you can set the period of fast Moving Average ( Fast MA Period ) and slow Moving Average ( Slow MA Period ). And also Shift, Applied Price, Method and Timeframe for two Moving Averages separately. Important:
The main difference from othe
FREE

Após 7 anos, decidi disponibilizar alguns dos meus próprios indicadores e Expert Advisors (EAs) gratuitamente.
Se você os achar úteis, por favor apoie com uma avaliação de 5 estrelas! Seu feedback me motiva a continuar oferecendo ferramentas gratuitas. Explore minhas outras ferramentas gratuitas aqui .
_________________________________ Indicador "RSI com Bandas" – Decisões de Negociação Melhores O indicador "RSI com Bandas" combina o RSI clássico com bandas simples para mostrar de
FREE
FlatBreakout (Free Version) Flat Range Detector and Breakout Panel for MT4 — GBPUSD Only FlatBreakout is the free version of the professional FlatBreakoutPro indicator, specially designed for flat (range) detection and breakout signals on the GBPUSD pair only.
Perfect for traders who want to experience the unique fractal logic of FlatBreakout and test breakout signals on a live market without limitations. Who Is This Product For? For traders who prefer to trade breakout of flat ranges (breakout,
FREE

!!!The free version works only on "EURUSD"!!! WaPreviousCandleLevels MT4 shows the previous candle levels, it shows the previous candle Open High Low Close levels (OHLC Levels) in different time frame. It's designed to help the trader to analyse the market and pay attention to the previous candle levels in different time frame. We all know that the OHLC Levels in Monthly, Weekly and Daily are really strong and must of the time, the price strongly reacts at those levels. In the technical analys
FREE

An “inside bar” pattern is a two-bar price action trading strategy in which the inside bar is smaller and within the high to low range of the prior bar, i.e. the high is lower than the previous bar’s high, and the low is higher than the previous bar’s low. Its relative position can be at the top, the middle or the bottom of the prior bar.
The prior bar, the bar before the inside bar, is often referred to as the “mother bar”. You will sometimes see an inside bar referred to as an “ib” and its m
FREE
Introduction and Description The commodity channel index (CCI) is an oscillator originally introduced by Donald Lambert in 1980. Since its introduction, the indicator has grown in popularity and is now a very common tool for traders in identifying cyclical trends not only in commodities but also equities and currencies. The CCI can be adjusted to the timeframe of the market traded on by changing the averaging period. CCI indicator with different colors at levels 0, 100 and -100. The cross is a
FREE

Detailed blogpost: https://www.mql5.com/en/blogs/post/766378
Key Features
Adaptive Upper/Lower bands Smooth Center Line Customizable Length (sensitivity) Non-Repainting (only current ongoing bar is updated every "Refresh After Ticks" number of ticks) Multiple Price Sources - Choose from close, open, high, low, median, typical, or weighted close Components:
The Basis Line The smooth center line represents the weighted average of price. Think of this as the "true" price level when all the noise
FREE
How To Trade
Execute your trades in 3 Easy Steps!
Step 1: Trade Setup Entry Buy = If daily open market Above Line PIVOT or can Price has touched and closed the candle above Resistance1. Entry Sell = If daily open market Under Line PIVOT or can Price has touched and closed the candle above Support1. Step 2: Set Stop Loss Stop loss BUY ----> You can set stop loss on Line Pivot or Support1. Stop loss SELL ----> You can set stop loss on Line Pivot or Resistance1. Step 3: Set Take Profit Take profi
FREE

The FxSProMT indicator shows the current market trend and trend change.
Indicator Parameters Ind_Period - the number of previous bars used to calculate actual values. Number_Bars - the number of bars to display the indicator.. Too many bars may significantly slow down the operation of the trading terminal. Signal_Sound - sound alert to notify of trend change. The sound can be played multiple times until the signal is confirmed (the bar closes). Default is disabled. Signal_Alert - an alert to no
FREE

RaysFX StepMA+Stoch Caratteristiche Principali Adattabilità: Il nostro indicatore RaysFX StepMA+Stoch è progettato per adattarsi alle mutevoli condizioni di mercato. Utilizza l’Average True Range (ATR) per misurare la volatilità del mercato e regolare di conseguenza le sue strategie di trading. Precisione: L’indicatore genera segnali di trading quando la linea minima incrocia la linea media. Questi segnali sono rappresentati come frecce sul grafico, fornendo punti di ingresso e di uscita chiari
FREE

This indicator is designed based on the Moving Origin indicator
When the moving origin indicator breaks the price, this indicator gives a signal
It is useful for better viewing of signals and analysis on them
Attributes: Can be used in all symbols Can be used in all time frames Too many signals Simple and quick settings Easy way to work
Settings: period: like moving average settings alarmShow: If you want to receive an alert in Metatrader after receiving the signal, enable this setting
alarmS
FREE

FuturePriceM15 - один из немногих индикаторов, который делает прогноз цены прямо на ценовом графике. Алгоритм расчета индикатора основан на быстром преобразовании Фурье. Имея колебательное поведение цены, функция Фурье прогнозирует ее поведение в дальнейшем. Индикатор устанавливается обычным образом на график с торговым инструментом указанным в переменной symbol с периодом M15 , данный временной период является самым оптимальным для работы с любыми торговыми символами. После установки, индикато
FREE

The Flag Streamer Pattern indicator is an indicator designed to find flag and pennant patterns. When the legend finds patterns, it draws lines on the graph screen. Magenta lines represent the streamer pattern. Aqua colored patterns represent the flag pattern. You can change the pattern colors according to your request. Our Popular Products Super Oscillator HC Cross Signal Super Cross Trend Strong Trend Super Signal Parameters fs- =======Channel Trend Setting===== Channel - Channel period setting
FREE

Quantum Swing 1. What is Quantum Swing The indicator calculates and displays future price levels based on quantum mathematics with high accuracy of probability and direction. Levels are displayed in the form of zones for making trading decisions; they clearly define a narrow price range for placing orders with a minimum stop-loss and maximum take-profit. The indicator displays future trading zones on different timeframes H1, H4, D, W. Quantum oscillations are also displayed without reference to
FREE

O indicador Overlay do gráfico exibe a ação do preço de vários instrumentos no mesmo gráfico, permitindo avaliar como os pares de moedas diferem entre si. [ Guia de instalação | Guia de atualização | Solução de problemas | FAQ | Todos os produtos ]
Encontre pares de moedas sobrecomprados ou sobrevendidos facilmente Plote até seis pares de moedas sobrepostos no mesmo gráfico Exibir símbolos invertidos, se necessário Adapte-se ao tamanho, zoom e prazo do gráfico Cálculo automático do nível de p
FREE

A flexible 2-Line MACD indicator The default MACD indicator inside MT4, limits you to using the MACD with a fast-EMA, slow-EMA, and signal-SMA. This MACD indicator allows you to set your own MA-Method choices for these 3 components, separately! You can select from SMA-EMA-SMMA-LWMA, and can even use a separate method for each 3 fast-slow-signal periods. A more featured version is available with colored candles+conditions, full alerts+conditions, line coloring, DEMA and TEMA options; MACD MAX
Fe
FREE

A new interpretation of the classical indicator in the form of an oscillator for a more accurate representation of the situation on the market. Less lagging than the standard Alligator. All settings are fully accessible, such as the type and prices for which it is built. Thanks to the additional parameters, it became possible to fine tune.
Distinctive features Does not redraw. Additional parameters for fine tuning. Works on all timeframes and symbols. Suitable for manual trading and developmen
FREE

This is a powerful indicator that groups multiple Expert Advisors (EAs) by strategy and displays aggregated performance results directly on the chart. Grouping is optional — you can use it even without organizing EAs into groups. It automatically calculates and visualizes performance within a specified aggregation period. You can exclude specific magic numbers or aggregate results across multiple magic numbers as a group. Additionally, by using partial string matching based on EA names, you can

21 simple moving average ( All Type of 21 MA River ) 51 simple moving average
Long Entry Upper 51 MA and above the 21 River Middle channel. Long Only Above Green Line (Market Opening Line) Short entry Below the lower 51 MA and below the 21 lower channel. Short Only Below Green Line (Market Opening Line)
Exit position
Initial stop loss is 20 pips below (for buy) or above (for sell) Target : Next level as per indicator Profit Target ratio 1:1.2
Download Template : https://drive.google.com/o
FREE

Liquidity Buy Sell Signal Indicator is a no-nonsense, no delay, no repaint indicator ! Liquidity pools together with a trend filter is the most powerful and reliable signal according to me (with the correct parameters depending on the timeframe used) It selects buy/sell entry signals based on liquidity in the market. The time range to scan for liquidity can be set in the parameters. Liquidity is an important aspect in the market, especially for institutional investors, as they need lots of liqu
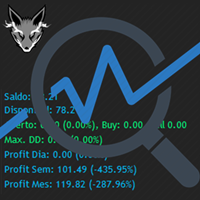
Acompanhe seus trades gerais! O Monitor New Fox é um excelente indicador, onde exibe para você seus lucros atuais, sendo eles mensais, semanais, e diários, ou seja todos lucros obtidos quando você abriu o mt4. Nosso novíssimo indicador Monitor New Fox é capaz de desbloquear todos os recursos avançados do MetaTrader 4. Este indicador pode representar graficamente com dados simples os principais dados da conta meta trader (saldo, patrimônio líquido, margem livre, lucro/perda atual, lucro/perd
FREE

EMA Above Below Bid price Технический индикатор в помощь трейдеру. Данный индикатор, показывает расположение пяти ЕМА,
пяти средних скользящих, относительно цены формирующей японские свечи или бары (цена Bid ).
О понятии ЕМА.
Скользящая средняя (moving average, MA) — это дополнительная линия на графике цены актива.
Внешне она повторяет график цены, но с небольшим запозданием и более гладко, без колебаний. Основные характеристики:
1. Показывает тренды. Если скользящая устремлена ввер
FREE

This indicator shows ratios between extremes on the chart. You can specify your own ratios (e.g. Fibonacci).
Parameters Most important Density - how much in details to search ratios in extremes. Bigger number means less details, smaller number means more details. Base unit is 1 bar on the chart. History - how far to go in history while searching. When you set -1, the indicator processes all bars from history. Base unit is 1 bar on the chart. Range - how far search ratios from given extreme. Bas
FREE

This indicator displays Point & Figure charts (PnF charts) in the indicator window. PnF charts show only price movements that are bigger than the specified box size. It helps to eliminate noise and allows focusing on main trends. Time is not a factor here. Only price movements are taken into account. That is why PnF chart is not synchronized with the main chart it is attached to. More about PnF charts: http://stockcharts.com/school/doku.php?id=chart_school:chart_analysis:pnf_charts Indicator wor
FREE

Turn chaos into clarity. Trade with precision. Bitcoin’s volatility can be your greatest ally — or your fastest downfall. Btc Trailblazer is your AI‑inspired market scout, designed to decode BTC’s behaviour in real‑time and flag the traps before you step into them . Harnessing an ensemble of advanced, pre‑defined technical algorithms, this indicator goes far beyond basic buy/sell alerts: AI‑inspired analysis engine blending trend, momentum, volatility, market structure, and regime context. Fals
# Product Name: SamuraiFX Momentum Hunter **Current Version:** 4.0 (Smart Validation Update) **Category:** Trend / Oscillators / Fractals **Timeframes:** M15, H1, H4, D1 (Recommended)
### ️ Trade with Discipline. Eliminate the Noise.
**SamuraiFX Momentum Hunter** is not just another arrow indicator. It is a complete trading system that combines the momentum of the **Awesome Oscillator (AO)** and **Accelerator Oscillator (AC)** with the structural precision of **Fractals**. Most indicators flo

A ferramenta que vai ajudar a você a calcular o lote de forma precisa para o risco que você precisa, se você quer arriscar 1% da sua conta é só colocar os valores de entrada, alvo e stop e você terá o tamanho do lote para usar e só perder a porcentagem escolhida. Você também pode escolher um valor fixo. Essa ferramenta vai ajudar a você na consistência, pois só pode ser consistente se operar de forma consistente e entradas com valores de perda fixas, é uma forma INFALÍVEL de ser consistente!!!!
FREE

Intraday Setup Indicator uses Bollinger Bands as a main indicator to find a good setup filtered with candle stick pattern such as engulfing and pin bar. This is great tool for those who trade with Bollinger bands for entry or use it as a filter for trend. It is suggested to use a higher time frame when using this tool. There are many input setting for user to conveniently find a good probability setup.
FREE

Indicator automatically draw bullish and bearish engulfing without any rules. Bearish and Bullish engulf is well known area for supply and demand area marking. This indicator can be used in any strategy that required supply demand zone. Show Last Engulf : Enable this option to show unfresh engulfing Candle to calculate : set 0 will load all history bar and can use up more memory Bearish Engulfing Colour : Pick any colour that suit Bearish Engulfing Colour : Pick any colour that suit
-Use this
FREE

The Trend Finding Channels indicator was developed to help you determine the trend direction by drawing channels on the graphical screen. It draws all channels that can be trending autonomously. It helps you determine the direction of your trend. This indicator makes it easy for you to implement your strategies. The indicator has Down trend lines and Up trend lines. You can determine the price direction according to the multiplicity of the trend lines. For example , if the Down trend lines s
FREE

The purpose of this new version of the MT4 standard indicator provided in your platform is to display in a sub-window multiple timeframes of the same indicator. See the example shown in the picture below. But the display isn’t like a simple MTF indicator. This is the real display of the indicator on its timeframe. Here's the options available in the FFx indicator: Select the timeframes to be displayed (M1 to Monthly) Define the width (number of bars) for each timeframe box Alert pop up/sound/ema
FREE

Aqui estão vários indicadores que trabalham juntos. Ele basicamente funciona com médias móveis e vários níveis de ATR criando um canal dinâmico através do qual o preço é drenado. Como eu sempre recomendo, você deve experimentá-lo antes de usá-lo ao vivo para que você entenda como ele funciona. O sinal de entrada do mercado é semelhante a outros indicadores de MA, mas com este você também tem uma análise gráfica do momento em que a tendência é encontrada e níveis dinâmicos para ajustar seu stop l
FREE

O objetivo desta nova versão do indicador-padrão em MT4 fornecida em sua plataforma é exibir em uma sub-janela vários períodos do mesmo indicador. Veja o exemplo mostrado na imagem abaixo. Mas a exibição não é como um indicador MTF simples. Esta é a exposição real do indicador no seu intervalo de tempo. Eis as opções disponíveis no indicador FFX: Selecione os prazos a serem exibidos (M1 para Mensal) Defina a largura (número de barras) para cada caixa de tempo Alerta pop up/som/e-mail/push (preço
FREE

Unleash Precision Trading with Fusion Multi-Trend Pro Are you tired of conflicting signals and missed opportunities? Introducing the Fusion Multi-Trend Pro , the indicator engineered to cut through market noise and deliver high-convection entry and exit points. This isn't just another indicator; it's a unified trading assistant that merges the power of momentum, trend, and volatility into a clear, decisive signal. Key Advantages: Why You Need Fusion Multi-Trend Pro Filter Out the Fakes: Our sys
FREE

EMA Separation plots 2 exponential moving averages, and a fill between them. The fill is colored differently according to an uptrend (short period EMA above long period EMA), or a downtrend (short period EMA below long period EMA). This is a small tool to help visualize the difference between long and short period averages. We hope you enjoy! EMA Separation can also be paired with our free EMA Separation Coefficient
Parameters Short period (Default=10): # bars used to calculate short period EMA
FREE
Welcome traders, MA SLOPE SCALPER is a really powerfoul tool to boost up your scalping! Have you been struggling with your scalping Strategies? Have you tried price action? Well, it does not work. Have you tried Rsi - Reversal Strategies? Well it'is not a clever idea. MA SLPOPE SCALPER IS A TREND FOLLOWER SYSTEM MA SLOPE SCALPER is based upon 3 different Exponential Moving averages that have bees studied and selected in order to maximize the precision of the signals! Ma SLOPE SCALPER has an i
FREE

A Swing Failure Pattern ( SFP ) is a trade setup in which big traders hunt stop-losses above a key swing high or below a key swing low for the purpose of generating the liquidity needed to push price in the opposite direction. When price 1) pierces above a key swing high but then 2) closes back below that swing high, we have a potential bearish SFP . Bearish SFPs offer opportunities for short trades. When price 1) dumps below a key swing low but then 2) closes back above that swing low, we have

Mantis Shrimp Convergence (MSC) A new way to see market momentum — no lag, no confusion.
What is MSC? Mantis Shrimp Convergence (MSC) is a powerful non-repainting oscillator, inspired by the logic of MACD but rebuilt for modern trading: zero lag, no false divergences, and dual-line precision. Designed for traders who demand clarity, speed, and reliability, MSC reveals momentum shifts with unmatched visual and structural accuracy.
How it Works MSC uses two signal lines — Fast and Slow,

It is a demo version of Advanced Arrow indicator It works only on GBPJPY but the full version works on all currency pairs.
Features Simply it gives you entry point ,SL line and 4 TP lines or less. Once SL-TP lines are shown with the arrow, they remains as they are until signal change. It is historical indicator. No Repaint.
Indicator parameters Indicator Version : choose V5 or V6. TP 1 Line color : TP1 color. TP 2 Line color : TP2 color. TP 3 Line color : TP3 color. TP 4 Line color : TP4 colo
FREE

ATR on Prices is simply an ATR indicator that plot a line for Resistance and Support using the Average True Range calculation. You can set the ATR daily periods, to be calculated. As well you can set the reference price to add and subtract the ATR measure to obtain the ATR Top and ATR Bottom lines, using the Open Price (that is fixed) or the Middle (HL/2) price (that will vary on the day) Or adding the ATR to the daily low and subtracting it from the daily high . You can use full ATR measure or
FREE

Candlestick Oscillator is a truly unique Oscillator that uses the concepts of within candlestick trading called the Record Session High. This is a method of analysing candlesticks to gauge when a trend might be wearing out and therefore ready for reversal or pause. We call it a record session high when we get 8 or more previous candles that have higher closes. We call it a record session low when we get 8 or more previous candles that have lower closes.
We don't rely on the typical Oscillation
FREE

Indicator overview Trend indicator usage Moving averages. Highest quality alerts that need no introduction. It is completely loyal to the original algorithm and uses other useful features.
Easy to trade Carry out all kinds of notifications It's not a new paint and it's not a back paint. Setting Indicator SSMA50 in Time frame H1 for any pair currency and Gold Spot. EMA200 in Time frame H1 for any pair currency and more than EMA250 for Gold spot. Using it for maximum benefit Set up notificatio
FREE
Saiba como comprar um robô de negociação na AppStore do MetaTrader, a loja de aplicativos para a plataforma MetaTrader.
O Sistema de Pagamento MQL5.community permite transações através WebMoney, PayPay, ePayments e sistemas de pagamento populares. Nós recomendamos que você teste o robô de negociação antes de comprá-lo para uma melhor experiência como cliente.
Você está perdendo oportunidades de negociação:
- Aplicativos de negociação gratuitos
- 8 000+ sinais para cópia
- Notícias econômicas para análise dos mercados financeiros
Registro
Login
Se você não tem uma conta, por favor registre-se
Para login e uso do site MQL5.com, você deve ativar o uso de cookies.
Ative esta opção no seu navegador, caso contrário você não poderá fazer login.