Participe de nossa página de fãs
Coloque um link para ele, e permita que outras pessoas também o avaliem
Avalie seu funcionamento no terminal MetaTrader 5

Parabolic SAR - indicador para MetaTrader 4

Baixe as últimas compilações nos links abaixo:
- Visualizações:
- 27277
- Avaliação:
- Publicado:
- Atualizado:
-
 Você está perdendo oportunidades de negociação:
- Aplicativos de negociação gratuitos
- 8 000+ sinais para cópia
- Notícias econômicas para análise dos mercados financeiros
Registro LoginVocê concorda com a política do site e com os termos de uso
Se você não tem uma conta, por favor registre-se -
 Precisa de um robô ou indicador baseado nesse código? Solicite-o no Freelance
Ir para Freelance
Precisa de um robô ou indicador baseado nesse código? Solicite-o no Freelance
Ir para Freelance
Parabolic SAR Technical Indicator was developed for analyzing the trending markets. The indicator is constructed on the price chart. This indicator is similar to Moving Average with the only difference that Parabolic SAR moves with higher acceleration and may change its position in terms of the price. The indicator is below the prices on the bull market (Up Trend), when the market is bearish (Down Trend), it is above the prices.
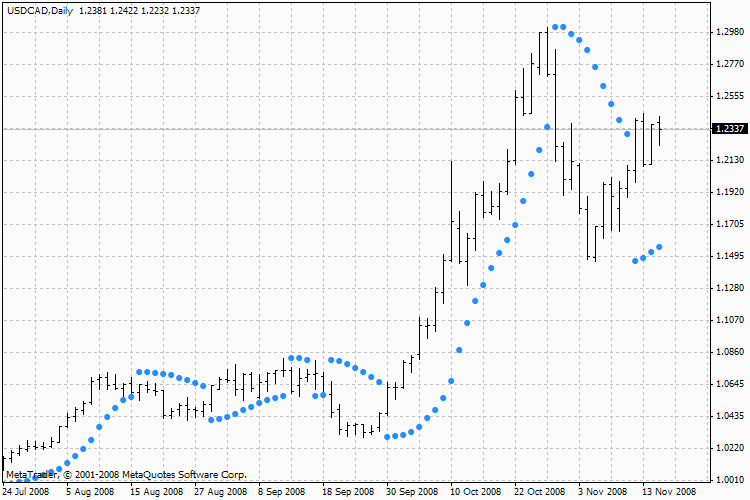
Parabolic SAR
If the price crosses the Parabolic SAR lines, the indicator reverses, and its further values are located on the other side of the price. In case of such an indicator reversal, the reference point is the previous period's high or low. The reversal of the indicator signals either the end of a trend (switch to correction or flat) or its reversal.
The Parabolic SAR is an outstanding indicator for providing exit points. Long positions should be closed when the price sinks below the SAR line, short positions should be closed when the price rises above the SAR line. The indicator is often used as the trailing stop line.
If a long position is open (i.e. the price is above Parabolic SAR), then the indicator line will move up irrespective of the
price movement. The amount of movement of the Parabolic SAR line depends on the value of the price movement.
For long positions:
SAR (i) = ACCELERATION * (HIGH (i - 1) - SAR (i - 1)) + SAR (i - 1)
For short positions:
SAR (i) = ACCELERATION * (LOW (i - 1) - SAR (i - 1)) - SAR (i - 1)
Where:
SAR (i - 1) — value of Parabolic SAR on the previous bar;
ACCELERATION — acceleration factor;
HIGH (i - 1) — the high price for the previous period;
LOW (i - 1) — the low price for the previous period.
The indicator value increases if the price of the current bar is higher than previous bullish and vice versa. The acceleration factor (ACCELERATION) will double at the same time, which would cause Parabolic SAR and the price to come together. In other words, the faster the price grows or sinks, the faster the indicator approaches the price.
Description of the technical indicator
The full description of the Parabolic SAR is available in the Technical analysis: Parabolic SAR section
Traduzido do russo pela MetaQuotes Ltd.
Publicação original: https://www.mql5.com/ru/code/7787
Ang Autoch HL.v1
The Ang Autoch HL.v1 indicator. Draws a channel.
Serg153xo
The indicator colors rising and falling candlesticks.
 Universal_1.64
The Universal_1.64 EA. It has a lot of settings.
Ticks Volume Indicator
In the futures markets data on trade volumes a reported with a one day delay. To compensate for this, many analysts use the tick volume indicator (tick volume).